Jason’s Law Commercial Motor Vehicle Parking Survey and Comparative Assessment
slide 1
National Coalition on Truck Parking
5th Meeting
December 1, 2020

Office of Freight Management and Operations
1200 New Jersey Avenue S.E.
Washington, D.C. 20590
ops.fhwa.dot.gov/freight
Printable Version [PDF 7 MB]
Contact Information: Freight Feedback at FreightFeedback@dot.gov
slide 2
Presentation Organization
- About Jason's Law
- Findings of the Survey of Truck Parking Stakeholders
- Truck Parking Metrics & Findings
- Review of State Truck Parking Plans
- Conclusion
slide 3
About Jason's Law
Section 1401 (c) of the Moving Ahead for Progress in the 21st Century (MAP-21) Act, referred to as Jason's Law, directs the United States Department of Transportation (USDOT) to conduct a survey and comparative assessment to:
- Evaluate the capability of each state to provide adequate parking and rest facilities for commercial motor vehicles engaged in interstate transportation,
- Assess the volume of commercial motor vehicle traffic in each state, and
- Develop a system of metrics to measure the adequacy of commercial motor vehicle parking facilities in each state.
The inaugural Jason's Law Final Report was published in 2015 and Section 1401 (c)(3) requires USDOT to periodically update the survey.
slide 4
Findings of the 2015 Jason's Law Report
- Most states reported truck parking shortages
- The magnitude and level of awareness varied among State DOTs.
- Variation in the information State DOTs could provide on truck parking.
- Truck parking demand is highest during night hours and mid-week.
- Consistent, continued measurement is important to understand dynamic truck parking needs and issues.
- Public and private sector coordination is critical to address long-term truck parking needs.
slide 5
Approach to 2019 Jason’s Law Update
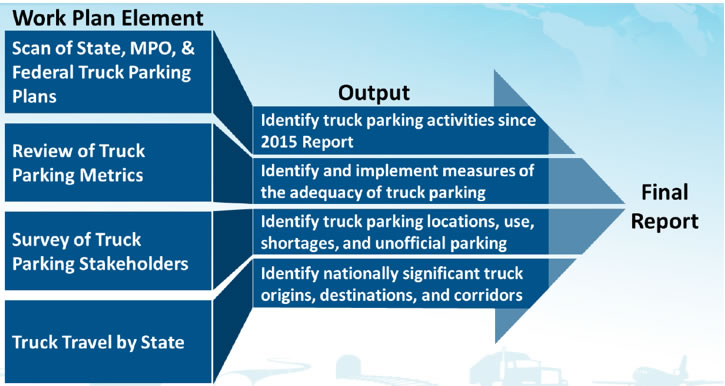
Work Plan Element: Scan of State, MPO and Federal Truck Parking Plans, Review of Truck Parking Metrics, Survey of Truck Parking Stakeholders, Truck Travel by State; Output: Identify truck parking activities since 2015 Report, Identify and implement measures of the adequacy of truck parking, Identify truck parking locations, use, shortages, and unofficial parking, ifentify nationally significant truck origins, destinations, and corridors; Final Report
slide 6
Presentation Organization
- About Jason's Law
- Findings of the Survey of Truck Parking Stakeholders
- Truck Parking Metrics & Findings
- Review of State Truck Parking Plans
- Conclusion
slide 7
2019 Surveys
|
Target Group |
Partner Organizations |
Responses |
| State Departments of Transportation |
FHWA, American Association of State Highway and Transportation Officials (AASHTO) |
50 States
(100% response rate) |
| Commercial Motor Vehicle Safety Enforcement Agencies |
Federal Motor Carrier Safety Administration |
45 States
(309% increase over 2014) |
| Truck Drivers, Trucking Operations Managers |
American Trucking Associations, Owner Operator Independent Drivers Association, Real Women in Trucking, and Trucker Path |
11,696 Drivers
(43% increase)
760 Trucking Managers
(205% increase) |
| Truck Stop Owners and Operators |
NATSO |
524 Truck Stop Operators (34% increase) |
| Port Authorities |
United States Maritime Administration and American Association of Port Authorities |
18 port authorities (New Survey in 2019) |
slide 8
Parking Inventory Results
- Approximately 313,000 truck parking spaces nationally
- 40,000 at public rest areas
- 273,000 at private truck stops
- 2014-2019 increase in truck parking spaces:
- 6 percent increase in public parking spaces
- 11 percent increase in private parking spaces
slide 9
Parking Inventory Results
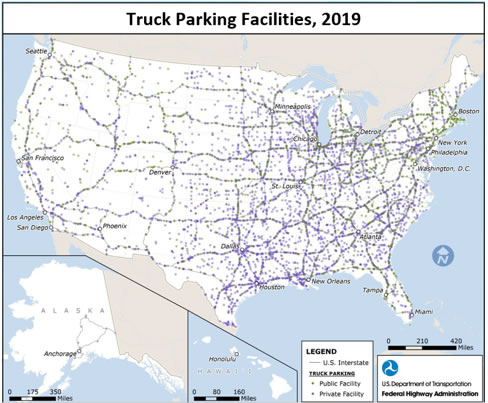
- Current survey includes areas of shortage similar to 2014:
- I-95 Mid-Atlantic and north
- Chicago area
- California
- New shortages emerged in additional locations since 2014:
- Throughout entire I-95 corridor
- Pacific corridors
- States surrounding Chicago region
- Other major freight corridors
slide 10
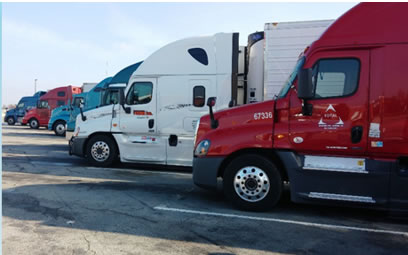
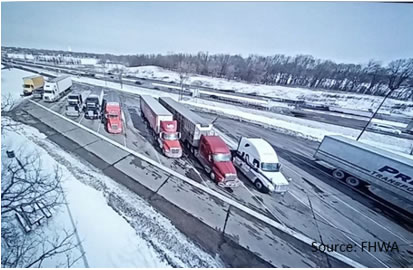
State DOT - Observations
- Not many new public facilities or spaces are being developed.
- Challenges exist in planning, funding, and accommodating truck parking.
- Business models and impacts need research and discussion.
- Local government involvement and education is needed.
Source: FHWA
slide 11
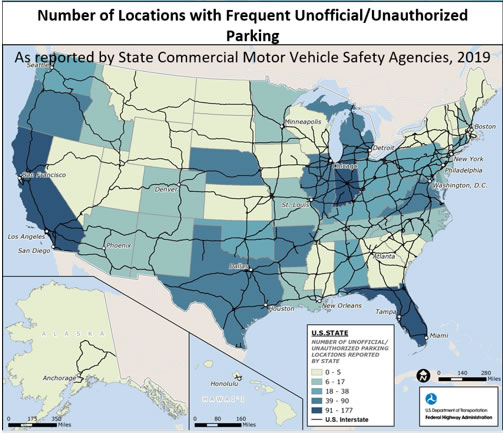
Commercial Motor Vehicle Safety Agencies
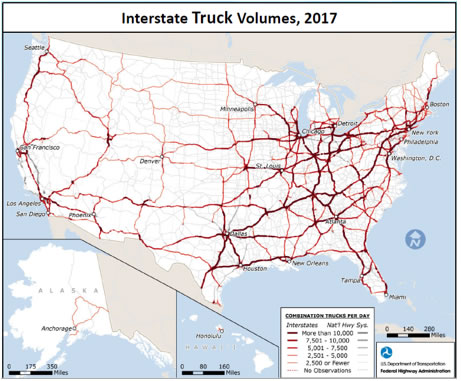
States with the highest reports tend to have major freight generating areas, major ports, and intermodal facilities.
slide 12
Commercial Motor Vehicle Safety Agencies
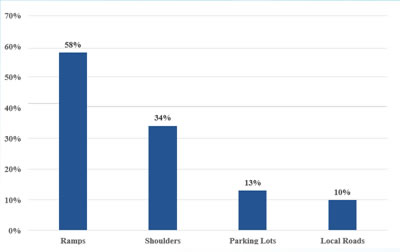
- Unofficial/Unauthorized parking occurs mostly on ramps and highway shoulders.
- Unofficial/unauthorized parking throughout the day, but most frequently between 7PM and 9AM
Types of Locations with Frequent Unofficial/Unauthorized Parking, 2019
slide 13
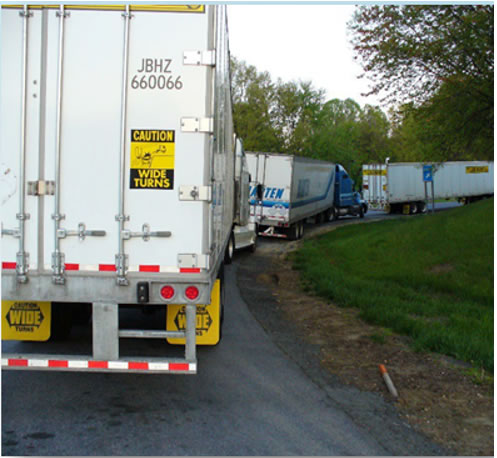
Commercial Motor Vehicle Safety Agencies - Observations
- Unauthorized parking occurs mainly at night and early morning before daylight.
- Unauthorized parking behavior relates to limited parking spaces and inclement weather, as well as snow storms during winter, especially in the Rocky Mountain states.
- Unauthorized parking occurs when vehicles park to stage to await deliveries.
- Information needs to be disseminated to drivers for awareness of available parking.
Source: MDOT
slide 14
Truck Drivers
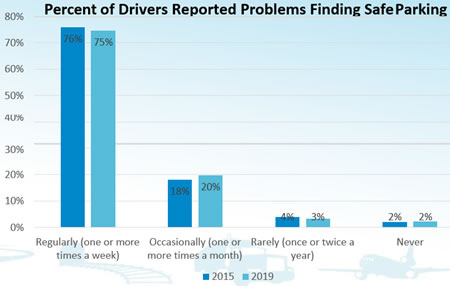
- 98 percent of drivers reported problems finding safe parking.
- Drivers reported challenges in every state and region, particularly along major freight corridors in States along I-95, the Chicago region, and I-5 in California.
- Most frequently reported periods for truck parking shortages:
- PM to 5AM
- Monday through Thursday
- October through February
slide 15
Truck Drivers
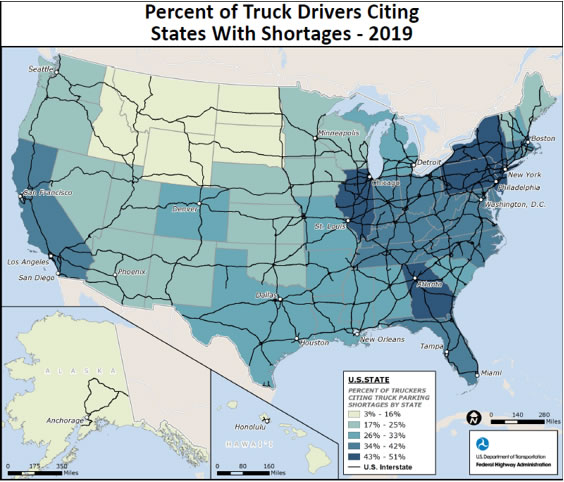
- States cited most frequently:
- New York
- New Jersey
- Pennsylvania
- Illinois
- Georgia
- Other highly cited areas include:
- I-95 corridor
- I-5 corridor
- Chicago region
slide 16
Truck Drivers - Observations
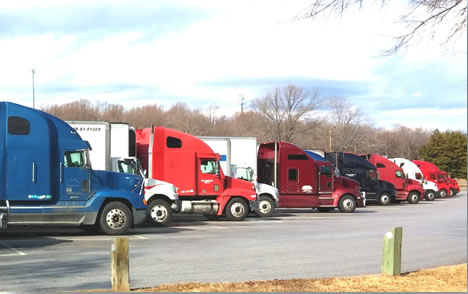
- Truck parking is most problematic along key freight corridors and in metropolitan areas.
- Drivers need a variety of parking types.
- Design is important in truck parking.
- Safety/security is valued.
- Public rest area closures present challenges.
- Receivers should offer parking on site.
- Truck spaces need to be reserved for trucks.
- Regulations impact parking.
- A public sector/citizen connection to trucks is needed.
- Drivers using apps and smart technology for routing and parking.
Source: FHWA
slide 17
Truck Stop Owners and Operators
- Average number of spaces per facility is 143; 100-300 spaces are common.
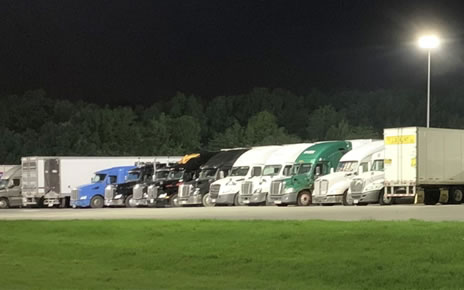
- Facilities operating over 100 percent capacity overnight, weekdays, and May to October.
- 79 percent do not plan to add more truck parking.
- 73 percent do not monitor parking.
- For those that do, most monitor it manually.
- 78 percent do not offer reservations.
- 75 percent do not charge for parking.
- 18 percent charge only for a small number of reserved spots.
- Three percent waive the fee for drivers who purchase amenities or food.
Source: FHWA
slide 18
Port Authorities
- 17 port authorities responded to the survey.
- Nine stated there is no on-site parking and one did not respond.
- For the seven that replied about truck parking spaces on site.
- The amount of parking varies from 15 to 200 spaces.
- Four allow 24/7 parking, the other three offer parking during the day or early hours before the opening of the port.
- Some port authorities provided additional detail.
- Seven reported that more spaces are needed at or near their facility, but only two plan to add spaces.
- One monitors parking using Intelligent Transportation System (ITS).
- None offer reservations.
slide 19
Presentation Organization
- About Jason's Law
- Findings of the Survey of Truck Parking Stakeholders
- Truck Parking Metrics & Findings
- Review of State Truck Parking Plans
- Conclusion
slide 20
Truck Parking Metrics
- The 2015 Jason's Law Report defined the three tiers of truck parking metrics:
- Tier I: Commonly used in truck parking studies and include data that is easily obtainable.
- Tier II: Require surveys, data purchases, and other data collection.
- Tier III: Aspirational measures that would broaden the understanding of truck parking and have little to no available data to measure them on a national scale.
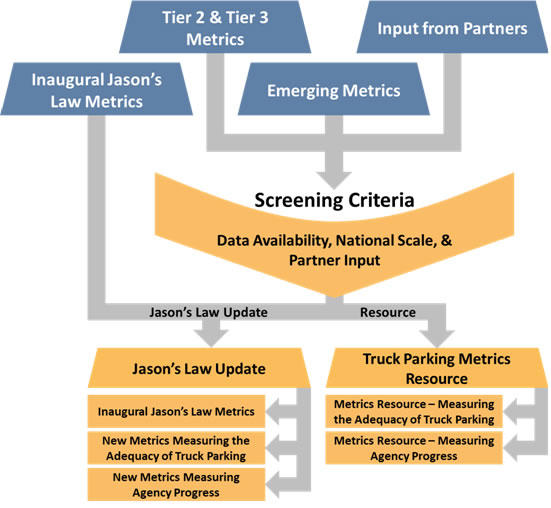
Inaugural Jason's Law Metrics to Jason's Law Update; Tier 2 and Tier3 Metrics, Emerging Metrics, Input from Partners flow to Screeing Criteria (Data Availability, National Scale and Partner Input) which flows to both Jason's Law Update and Truck Parking Metrics Resources. Under Jason's Law Update are three items: Inaugural Jason's Law Metrics, New Metrics Measuring the Adequacy of Truck Parking, New Metrics Measuring Agency Progress. Under Truck Parking Meterics (Resource) - Metrics Resource - Measuring the Adequacy of Truck Parking, Metrics Resource - Measuring Agency Progress
slide 21
Jason's Law Truck Parking Metrics
2015 Jason's Law Report truck parking metrics:
- Public, private, and total parking facilities and spaces
- Ratio of private to public truck parking spaces
- Number of spaces in relation to Gross Domestic Product by state
- Public, private, and total truck parking spaces per 100,000 truck vehicle miles traveled (TVMT)
- Public, private, and total truck parking spaces per 100 Miles of the National Highway System (NHS)
New truck parking metrics for 2019:
- Parking near nationally significant origins and destinations
- Parking spaces within 5 miles of the National Highway Freight Network (NHFN)
- Public, private, and total truck parking spaces per 100 miles of the NHFN
- Public, private, and total truck parking spaces within 1 mile of an Interstate
- Number of state truck parking studies since the 2015 Jason's Law Report
slide 22
Public Facilities and Spaces Comparison, 2014 to 2019
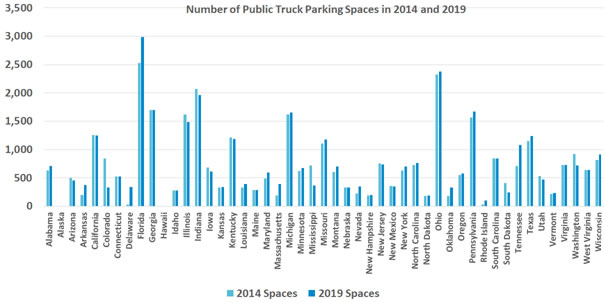
Public Facilities and Spaces Comparison, 2014 to 2019 - Chart of number of Public Truck Parking Spaces in 2014 and 2019. Generally there are more spaces available in 2019 for each state than in 2015. The states with the most public truck parking spaces are Florida, Ohio, Indiana, Georgia, Illinois, and Pennsylvania.
slide 23
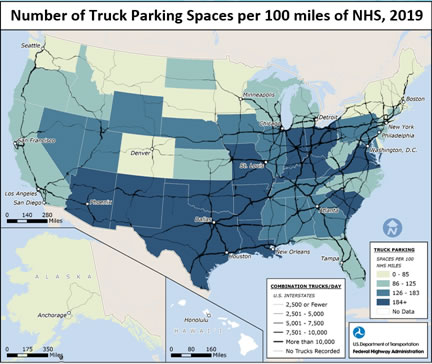
Spaces per 100 miles of National Highway System (NHS)
- Nationally 142 spaces per 100 miles of NHS in 2019
- Top 5 States with the most spaces relative to miles of NHS:
- Indiana
- Louisiana
- Ohio
- Kentucky
- Oklahoma
slide 24
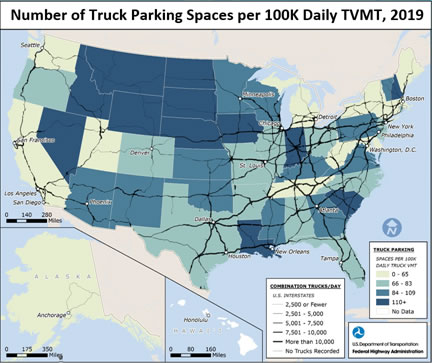
Spaces per 100K Daily Truck Vehicle Miles Traveled (TVMT)
- Nationally 83 truck parking spaces per 100K Daily TVMT
- 15 percent increase in TVMT between 2012 and 2017
- Top 5 States with the most spaces relative to TVMT:
- Wyoming
- New Hampshire
- North Dakota
- Nevada
- Montana
slide 25
Truck Parking by Urban and Rural Areas
 |
Percent of NHS Truck VMT |
Percent of Total Parking Spaces |
| Urban Areas |
47% |
34% |
| Rural Areas |
53% |
66% |
- The 32 urbanized areas with the greatest freight origins/destinations, (38 percent of truck freight tonnage) only have 8.5 percent of truck parking spaces.
- Reinforces need for parking near freight destinations and integration of truck parking with regional/local planning.
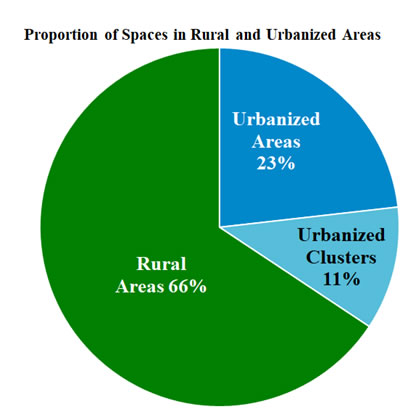
Urbanized areas > 50,000 population
Urbanized clusters 2,500 – 50,000 population
slide 26
Presentation Organization
- About Jason's Law
- Findings of the Survey of Truck Parking Stakeholders
- Truck Parking Metrics & Findings
- Review of State Truck Parking Plans
- Conclusion
slide 27
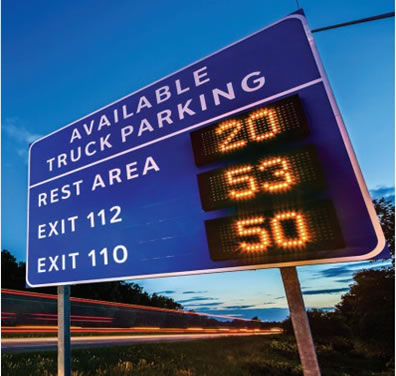
State Truck Parking Information and Management Systems (TPIMS)
- States engaged in information sharing for truck parking.
- Approaches include signs, maps, truck parking websites, and ITS technologies.
- State projects were funded under former SAFETEA-LU Section 1305 program to improve truck parking, including the development of TPIMS solutions.
- TIGER and INFRA provided grants for regional TPIMS.
- The Federal Highway Administration (FHWA), Federal Motor Carrier Safety Administration (FMCSA) and U.S. Maritime Administration (MARAD) working in partnership on a number of truck parking initiatives.
- Connected and automated vehicle (CAV) technology offers opportunities for truck operations and data exchange.
Source: MDOT
slide 28
Review of State Truck Parking Plans
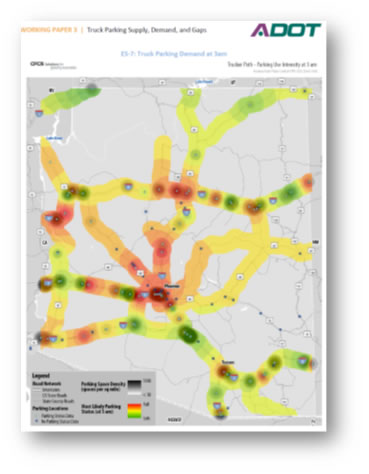
- Improved data collection on truck parking, analysis, and modeling and forecasting of parking utilization.
- Truck parking deficiencies examined along freight corridors and in the vicinity of freight generators.
- Analysis expanding to include ports and freight generators, multi-state and mega-regional needs.
- Truck parking being considered in broader context of economic development opportunities and constraints.
- Stakeholder engagement processes greatly improved.
- Differences in parking capacity and information needs among various segments of the trucking industry examined in more detail.
Source: ADOT
slide 29
Review of State Truck Parking Plans (continued)
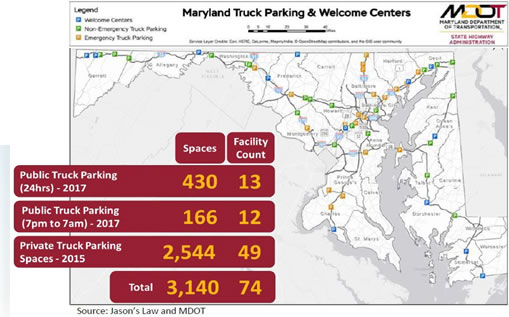
- Improper parking on highway shoulders and interchange ramps a key safety concern.
- Funding and creative financing/business mechanisms needed to expand capacity and implement technology.
- Several states are looking into public-private partnerships (P3s).
- Strategies for expansion and redesign of facilities to improve access and circulation, offer additional amenities, and provide a range of parking types (short or long term).
Source: MDOT
slide 30
Presentation Organization
- About Jason's Law
- Findings of the Survey of Truck Parking Stakeholders
- Trucking Parking Metrics & Findings
- Review of State Truck Parking Plans
- Conclusion
Inaugural Jason's Law Metrics to Jason's Law Update; Tier 2 and Tier3 Metrics, Emerging Metrics, Input from Partners flow to Screeing Criteria (Data Availability, National Scale and Partner Input) which flows to both Jason's Law Update and Truck Parking Metrics Resources. Under Jason's Law Update are three items: Inaugural Jason's Law Metrics, New Metrics Measuring the Adequacy of Truck Parking, New Metrics Measuring Agency Progress. Under Truck Parking Meterics (Resource) - Metrics Resource - Measuring the Adequacy of Truck Parking, Metrics Resource - Measuring Agency Progress
slide 31
Conclusions
- Truck parking shortages are still a major problem in every state and region.
- Major freight corridors and large metro areas have the most acute shortages.
- Shortages exist at all times of day, week and year, but mostly overnight and weekdays.
- More awareness exists among all stakeholders.
- TPIMS emerging as means to inform drivers about parking availability; drivers prefer Smartphone notifications.
- Challenges exist in funding and maintaining truck parking for public and private sector.
- Truck stop operators need business models that incorporate parking profitably or P3s.
- Local government involvement and citizen awareness needed for effective discussions and realistic plans for truck parking.
slide 32
For more information on truck parking, visit:
https://ops.fhwa.dot.gov/Freight/infrastructure/truck_parking/index.htm


