Status of the Nation's Highways, Bridges, and Transit Conditions and Performance: 23rd Edition: Part III: Highway Freight Transportation - Report to Congress
Part III: Highway Freight Transportation Conditions and Performance
Chapter 12: Conditions and Performance of the National Highway Freight Network
Introduction
Key Takeaways
- The FAST Act established the National Highway Freight Network (NHFN) and required a conditions and performance report.
- Pavement IRI was acceptable on 96 percent of the NHFN roadways, based on 2014 data.
- Nearly one-third of the bridges on the NHFN are 51 years or older, based on 2014 data.
- The number of crashes and fatalities on the NHFN increased from 2014 to 2015, by 5.7 percent and 6.1 percent respectively, based on 2015 data.
- Travel time has become less predictable over the last 5 years, with the Travel Time Reliability Planning Time Index increasing in 14 of the top 25 intercity truck corridors, based on 2011–2014 data.
- Average travel speed has decreased in 13 of the top 25 freight-significant corridors, based on 2011–2015 data.
The Fixing America's Surface Transportation (FAST) Act designated a freight network and established a national policy of maintaining and improving the conditions and performance of the new National Highway Freight Network (NHFN). The law also required the development of a regular report on the conditions and performance of the NHFN. This chapter serves as the first of these reports.
Using the definitions associated with the longstanding Congressional reporting requirement that produces the Conditions and Performance Report on the Status of the Nation's Highways, Bridges, and Transit as a model, the terms "conditions" and "performance" may be defined as follows:
- "Conditions" refers to the physical state of the infrastructure, and therefore shows a snapshot in time of infrastructure quality.
- "Performance" reflects how the system is performing relative to a program goal, the direct products and services delivered by a program, and/or the results of those products and services.
It is generally acknowledged that "conditions" and "performance" measures are related to each other, as the condition of an infrastructure asset typically affects its performance. The structural integrity of a bridge or the ride quality of a roadway are examples of conditions metrics. Examples of performance metrics include congestion or travel time on a roadway, changes in that roadway's congestion statistics over time, safety metrics, and how the conditions on the roadway affect the overall movement of goods through a region. The goal areas of the FAST Act have been used in this chapter as a guide to reporting on conditions and performance of the NHFN. Exhibit 12-1 shows how the goal areas for the NHFN in the FAST Act relate to conditions and performance measures included in this report.
It is generally acknowledged that "conditions" and "performance" measures are related to each other, as the condition of an infrastructure asset typically affects its performance. The structural integrity of a bridge or the ride quality of a roadway are examples of conditions metrics. Examples of performance metrics include congestion or travel time on a roadway, changes in that roadway's congestion statistics over time, safety metrics, and how the conditions on the roadway affect the overall movement of goods through a region. The goal areas of the FAST Act have been used in this chapter as a guide to reporting on conditions and performance of the NHFN. Exhibit 12-1 shows how the goal areas for the NHFN in the FAST Act relate to conditions and performance measures included in this report.
| Goal Area | Measure |
|---|---|
| State of Good Repair |
|
Safety, Security, and Resilience |
|
Congestion, Economic Efficiency, Productivity, and Competitiveness |
|
The goals addressed in this report reflect areas where measures were defined and datasets were available at the time of the writing of this report. In keeping with the focus of this report, the goals used were specific to measures obtainable for the NHFN roadways. It is possible that, in future iterations of this report, additional metrics for NHFN goal areas will be developed and new datasets may become available to improve the range of measures available to understand the conditions and performance of this highway freight network.
Conditions
Pavement Quality on the NHFN
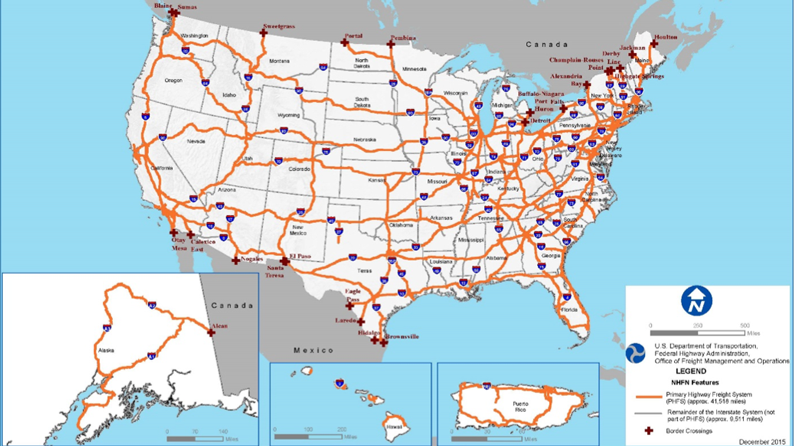
Designated in 2015 based on 2012 data, the original NHFN consisted of 51,029 centerline miles, including 46,947 centerline miles of Interstate and 4,082 centerline miles of non-Interstate roads, using the Highway Performance Monitoring System (HPMS) dataset. The routes comprising the total miles include the underlying Primary Highway Freight System (PHFS) of 41,518 centerline miles, of which 37,436 miles were Interstate and 4,082 miles were non-Interstate roads, combined with the remaining 9,511 miles of Interstate roads not included in the PHFS. The overall centerline mileage will fluctuate with additions and deletions (rare) to the Interstate Highway System, as well as when States elect to designate Critical Rural Freight Corridors (CRFCs) and Critical Urban Freight Corridors (CUFCs). Exhibit 11-8 shows the original NHFN as established by Congress.
Pavement conditions are reported to FHWA by States through the HPMS for Federal-aid highways. The reporting agency uses the International Roughness Index (IRI) to measure the smoothness of pavement and ride quality. The IRI measures smoothness using an algorithm based on the longitudinal profile of a section of the road. Lower IRI values indicate better pavement conditions (i.e., smoother), whereas higher values indicate worse conditions. The IRI represents pavement ride quality in terms of the cumulative deviation from a smooth surface in inches per mile, as shown in the categories in Exhibit 12-2.
Exhibit 12-2: Pavement Ride Quality (IRI) on the NHFN (Based on Mileage)
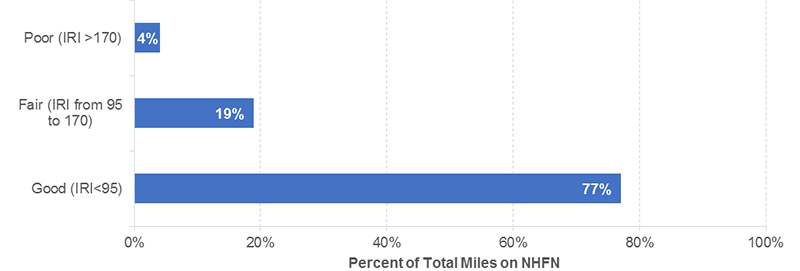
Source: HPMS data from 2014.
Using more recent Interstate mileage data from the HPMS in 2014, the NHFN now comprises 52,020 centerline miles of roadway. Seventy-seven percent of pavement miles on the NHFN were rated as having good ride quality per 2015 HPMS data, 19 percent had fair ride quality, and 4 percent had poor ride quality. Approximately 96 percent of roadways on the NHFN had an acceptable IRI, as measured by the combined number of good and fair roadways. The data showed that 15 percent of the non-Interstate portion of the NHFN had a poor IRI, whereas only approximately 3 percent of the Interstate roadways on the NHFN had a poor IRI.
Bridges on the NHFN
Structural status and bridge age are two commonly used metrics to determine the condition of bridges. The classification of a bridge as structurally deficient does not imply that a bridge is unsafe; rather, it indicates the extent to which a bridge has deteriorated from its original condition. Structurally deficient bridges are characterized by the deteriorated condition of bridge elements and reduced load-bearing capacity. In some cases, weight restrictions are placed on structurally deficient bridges. Such load limitations may affect freight routing and efficiency. The age of a bridge is also relevant to freight routing and efficiency, as most bridges were designed for a 50-year life span and would be expected to be replaced or need major rehabilitation efforts after they have been in service for 50 years. Construction projects can increase freight delays, create workzone areas for increased safety consideration, and in some cases necessitate rerouting for a period of time.
To inventory the bridges on the NHFN, the National Bridge Inventory (NBI) was analyzed using ArcGIS software to determine which bridges are on the NHFN and to identify current bridge ratings. This analysis showed that there are approximately 57,600 bridges on the NHFN, 4.3 percent of which were rated as structurally deficient.
The age of a bridge structure is an important indicator of its serviceability; that is, the condition under which a bridge is still considered useful. Nearly 31.5 percent of bridges on the NHFN are 51 years old or older. More than 53 percent of the bridges are 26 to 50 years old. A breakdown of the age of bridges on the NHFN, grouped into six unequal but meaningful segments, is shown in Exhibit 12-3.
Exhibit 12-3: Age of Bridges on the NHFN
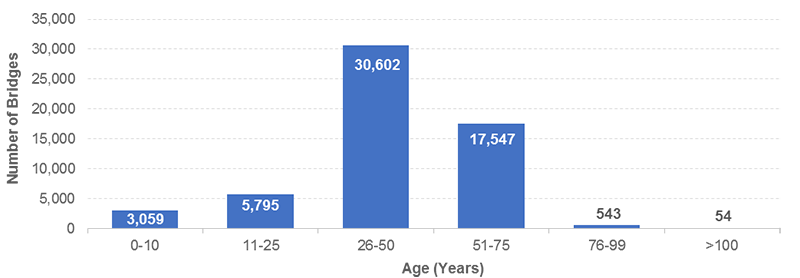
Source: NBI data from 2014.
More than half of the structurally deficient bridges on the NHFN are over 50 years old, as shown by the bar graph of structurally deficient NHFN bridges by age in Exhibit 12-4. This result has funding and operations implications, as these bridges will need significant rehabilitation and replacement now or in the near future.
Exhibit 12-4: Age of Structurally Deficient Bridges on the NHFN
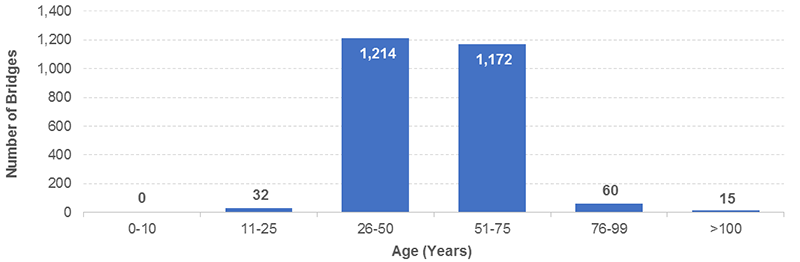
Source: NBI data from 2014.
Exhibit 12-5 summarizes the bridge element conditions on the NHFN as of 2014, including the condition rating for individual culverts and for the deck, superstructure, and substructure of bridges. The results show that greater than 96 percent of each of the individual elements of NHFN bridges and culverts on the NHFN are in good or fair condition.
Exhibit 12-5: Bridge Element Conditions on the NHFN, 2014
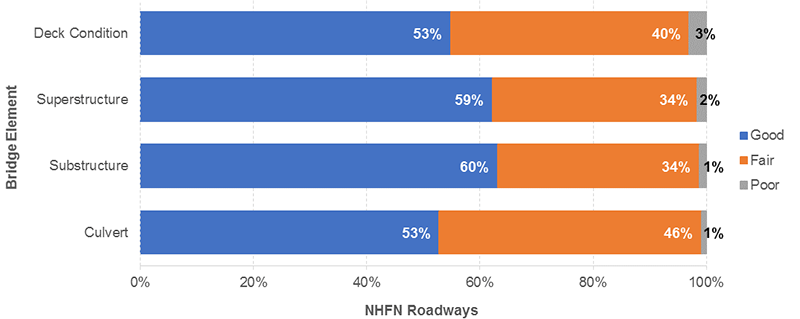
Source: NBI data from 2014.
Performance
Safety Data on the NHFN
Safety performance measures are indicators that enable decision makers and other stakeholders to monitor changes in system conditions and performance against established visions, goals, and objectives. Typical safety performance measures relate to the number and rate of fatalities and or crashes. The crash statistics discussed in this section were extracted from the Fatality Analysis Reporting System (FARS) for rural and urban Interstate highways, which make up the bulk of the NHFN.
The table in Exhibit 12-6 shows the number of fatal motor vehicle crashes and fatalities on the NHFN in 2014 and 2015, along with a breakdown of crash locations between urban and rural areas. There were 3,633 fatal crashes reported on the Interstate System portion of the NHFN in 2014, resulting in 4,094 fatalities. In 2015, the number of crashes and the number of fatalities increased by 5.7 percent and 6.1 percent, respectively.
Crashes involving trucks on the Interstate System portion of the NHFN have increased in recent years, rising from 942 crashes and 1,104 fatalities in 2015 to 1,053 crashes and 1,194 fatalities in 2016.
Exhibit 12-6: Fatal Motor Vehicle Crashes and Fatalities on the Interstate System portion of the NHFN, 2014 and 2015
| Year | Rural/Urban | Total | ||||||
|---|---|---|---|---|---|---|---|---|
| Rural | Urban | Unknown | ||||||
| Crashes | Fatalities | Crashes | Fatalities | Crashes | Fatalities | Crashes | Fatalities | |
| 2014 | 1,521 | 1,762 | 2,112 | 2,332 | 0 | 0 | 3,633 | 4,094 |
| 2015 | 1,647 | 1,918 | 2,190 | 2,424 | 4 | 4 | 3,841 | 4,346 |
Source: Information obtained from crash data contained in Fatality Analysis Reporting System (FARS) files.
Freight Volumes
The map in Exhibit 12-7 shows the 2015 volume of freight moved by trucks on the NHFN, in millions of tons.
Exhibit 12-7: Tonnage on the NHFN, 2015
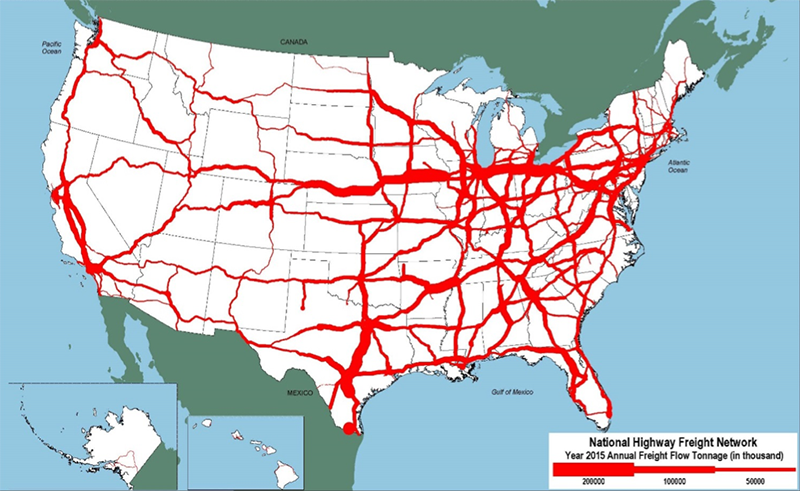
Note: Long haul freight typically serves locations at least 50 miles apart, excluding trucks that are used in movements by multiple modes and mail.
Source: Information obtained from Freight Analysis Framework (FAF) data, version 4.
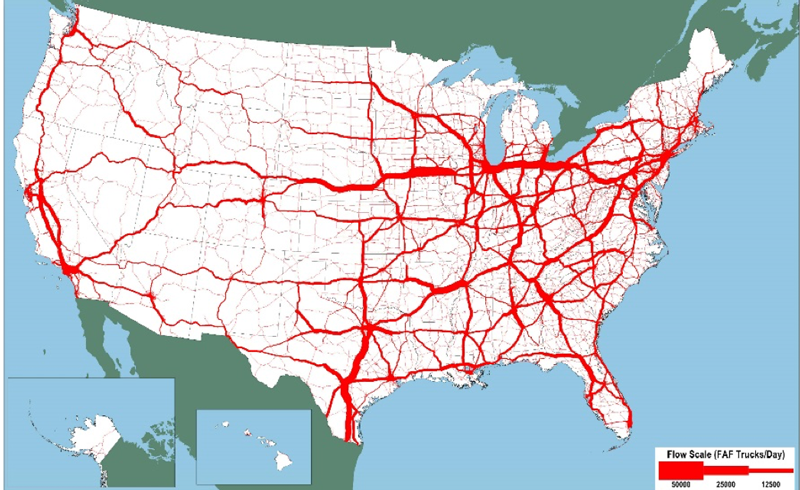
Truck traffic on the NHFN is expected to increase significantly between 2015 and 2045. The current average daily long haul truck traffic on the NHFN is shown for 2015 in Exhibit 12-8 and the forecasted growth in average daily long haul truck traffic on the NHFN for 2045 is shown Exhibit 12-9.
Exhibit 12-8: Average Daily Long Haul Truck Traffic on the NHFN, 2015
Note: Major flows include domestic and international freight moving by truck on highway segments with more than 25 FAF trucks per day and between places typically more than 50 miles apart.
Source: Information obtained from FAF data, version 4.
Exhibit 12-9: Forecasted Average Daily Long Haul Truck Traffic on the NHFN, 2045
Note: Major flows include domestic and international freight moving by truck on highway segments with more than 25 FAF trucks per day and between places typically more than 50 miles apart.
Source: Information obtained from FAF data, version 4.
Congestion
Congestion on highways and bridges occurs when traffic demand approaches or exceeds the available capacity of the system. "Recurring" congestion refers to congestion taking place at roughly the same place and time every day, usually during peak traffic periods due to insufficient infrastructure or physical capacity, such as roadways that are too narrow to accommodate the demand. "Nonrecurring" congestion is caused by temporary disruptions that render part of the roadway unusable. Factors that trigger nonrecurring congestion include traffic incidents, bad weather, construction work, poor traffic signal timing, and special events. About half the total congestion occurrence on roadways is recurring, with the other half nonrecurring.
FHWA monitors performance for the freight system as part of its Freight Performance Measurement (FPM) program to analyze the impacts of congestion and determine the operational capacity and efficiency of key freight routes in the United States. Freight highway congestion is measured using truck probe data from more than 600,000 trucks equipped with the Global Positioning System (GPS). These trucks provide billions of position signals that FHWA analyzes to determine truck freight performance, both for routine monitoring and for ad hoc analysis to understand truck movements and impacts, such as when an incident affects highway network reliability. Over time, the number of vehicle probes will need to increase to improve the comprehensiveness of the data. FHWA estimates that the current number of probes represents approximately 30 percent of the truck population for Classes 6, 7, and 8 (i.e., trucks with gross vehicle weight exceeding 19,500 pounds). In addition to the FPM truck probe data, FHWA uses information from the FAF tool for tonnage and volume flows.
FPM's routine monitoring of truck freight performance is principally used to monitor congestion, using measures of travel time reliability and speed for corridors, border crossings, urban areas, freight intermodal connections, and freight bottlenecks. FHWA produces quarterly performance monitoring reports that provide insight into these areas. More information is available on FHWA's Website at (http://ops.fhwa.dot.gov/freight/freight_analysis/perform_meas/).
FHWA produces a Freight Movement Efficiency Index that combines measures of speeds and travel times for intermodal locations, urban areas, bottlenecks, and border crossings. FHWA monitors travel times for the top 25 freight corridors in the United States. All of these freight corridors are designated on the NHFN. The measures indicate that the current congestion negatively influencing truck carrier operations occurs on a recurring basis during peak periods, particularly in and near major metropolitan areas.
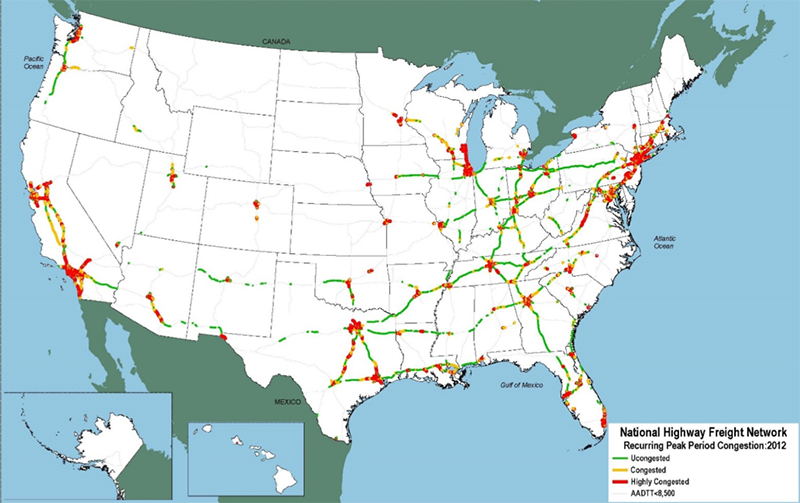
The two maps in Exhibits 12-10 and 12-11 show the locations of peak-period congestion on the NHFN and for the high-volume truck portions of the NHFN. High-volume truck portions of the NHFN carry more than 8,500 trucks per day, including freight-hauling long-distance trucks, freight-hauling local trucks, and other trucks with six or more tires. Highly congested segments are stop-and-go conditions with volume/service flow ratios greater than 0.95. The volume/service flow ratio is calculated as an indicator of peak hour congestion. Congested segments have reduced traffic speeds with volume/service flow ratios between 0.75 and 0.95. Although the NHFN was designated in 2015, the peak-period congestion depicted in the exhibits below were developed using 2012 data.
Exhibit 12-10: Peak-period Congestion on the NHFN, 2012
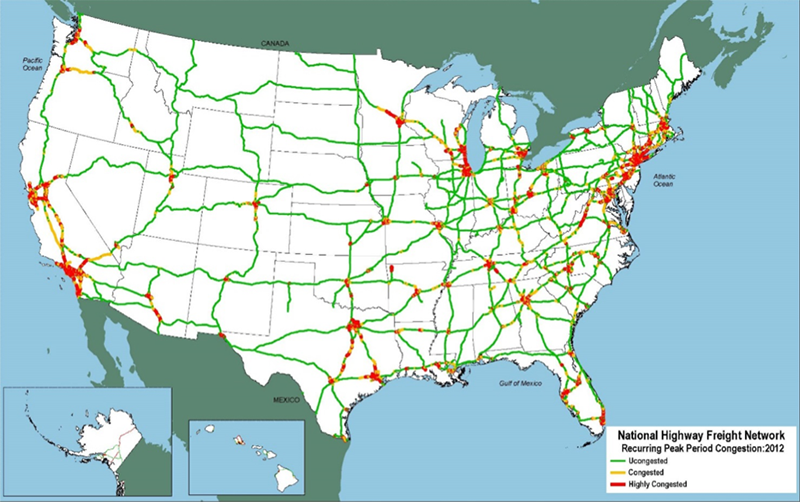
Note: The volume/service flow ratio is estimated using the procedures outlined in the HPMS Field Manual, Appendix N.
Note: Highly congested segments are stop-and-go conditions with volume/service flow ratios greater than 0.95. Congested segments have reduced traffic speeds with volume/service flow ratios between 0.75 and 0.95.
Note: Long haul freight trucks typically serve locations at least 50 miles apart, excluding trucks that are used in movements by multiple modes and mail.
Source: Information obtained from FAF data, version 4.
Exhibit 12-11: Peak-period Congestion on the High-volume Truck Portions of NHFN, 2012
Note: The volume/service flow ratio is estimated using the procedures outlined in the HPMS Field Manual, Appendix N.
Note: Highly congested segments are stop-and-go conditions with volume/service flow ratios greater than 0.95. Congested segments have reduced traffic speeds with volume/service flow ratios between 0.75 and 0.95.
Note: Long haul freight trucks typically serve locations at least 50 miles apart, excluding trucks that are used in movements by multiple modes and mail.
Source: Information obtained from FAF data, version 4.
The table in Exhibit 12-12 shows the speeds experienced on the top 25 congested freight-significant locations within a pre-selected sample of freight facilities (predominantly interchanges), all of which are on the NHFN. The rankings are based on a volume-weighted calculation of congestion that considers the volume of truck traffic, which is captured through truck probe sample data. Note: Variations in the concentration of truck probes reporting by facility compared to actual truck traffic may affect the ranking of these facilities.
| Congestion Ranking[2] | Location Description[3] | State | Average Speed[4] | Peak Average Speed | Nonpeak Average Speed | Nonpeak/Peak Ratio |
|---|---|---|---|---|---|---|
| 1 | Atlanta, GA: I-285 at I-85 (North) | GA | 40 | 28 | 47 | 1.68 |
| 2 | Chicago, IL: I-290 at I-90/I-94 | IL | 27 | 21 | 29 | 1.38 |
| 3 | Fort Lee, NJ: I-95 at SR 4 | NJ | 36 | 29 | 39 | 1.33 |
| 4 | Louisville, KY: I-65 at I-64/I-71 | KY | 44 | 38 | 47 | 1.24 |
| 5 | Houston, TX: I-610 at US 290 | TX | 38 | 29 | 43 | 1.51 |
| 6 | Houston, TX: I-10 at I-45 | TX | 42 | 32 | 47 | 1.48 |
| 7 | Cincinnati, OH: I-71 at I-75 | OH | 47 | 40 | 50 | 1.23 |
| 8 | Houston, TX: I-45 at US 59 | TX | 39 | 28 | 44 | 1.54 |
| 9 | Los Angeles, CA: SR 60 at SR 57 | CA | 45 | 38 | 48 | 1.28 |
| 10 | Houston, TX: I-10 at US 59 | TX | 43 | 32 | 50 | 1.57 |
| 11 | Dallas, TX: I-45 at I-30 | TX | 39 | 28 | 44 | 1.55 |
| 12 | Atlanta, GA: I-75 at I-285 (North) | GA | 46 | 35 | 51 | 1.46 |
| 13 | St. Louis, MO: I-70 at I-64 (West) | MO | 42 | 38 | 44 | 1.15 |
| 14 | Seattle, WA: I-5 at I-90 | WA | 35 | 26 | 40 | 1.54 |
| 15 | Chicago, IL: I-90 at I-94 (North) | IL | 32 | 18 | 40 | 2.25 |
| 16 | Austin, TX: I-35 | TX | 33 | 21 | 40 | 1.90 |
| 17 | Auburn, WA: SR 18 at SR 167 | WA | 46 | 39 | 50 | 1.29 |
| 18 | Los Angeles, CA: I-710 at I-105 | CA | 44 | 34 | 49 | 1.42 |
| 19 | Baton Rouge, LA: I-10 at I-110 | LA | 42 | 35 | 46 | 1.34 |
| 20 | Hartford, CT: I-84 at I-91 | CT | 46 | 37 | 50 | 1.36 |
| 21 | Houston, TX: I-45 at I-610 (North) | TX | 46 | 36 | 51 | 1.43 |
| 22 | Seattle, WA: I-90 at I-405 | WA | 39 | 29 | 45 | 1.58 |
| 23 | Cincinnati, OH: I-75 at I-74 | OH | 45 | 40 | 48 | 1.20 |
| 24 | Indianapolis, IN: I-65 at I-70 (North) | IN | 50 | 45 | 52 | 1.16 |
| 25 | Denver, CO: I-70 at I-25 | CO | 45 | 39 | 49 | 1.26 |
[1] Using data associated with the FHWA-sponsored Freight Performance Measures (FPM) initiative, the American Transportation Research Institute provides a yearly analysis to quantify the impact of traffic congestion on truck-borne freight at 250 specific locations throughout the United States. [ Return to Exhibit 12-12 ]
[2] The ranking analysis factors in the number of trucks using a particular highway facility and the impact that congestion has on average commercial vehicle speed in each of the 250 study areas. These data represent truck travel during weekdays at all hours of the day in 2014. [ Return to Exhibit 12-12 ]
[3] These locations were identified over several years through reviews of past research, available highway speed and volume data sets, and surveys of private- and public-sector stakeholders. [ Return to Exhibit 12-12 ]
[4] Average speeds below a free flow of 55 miles per hour indicate congestion. [ Return to Exhibit 12-12 ]
Source: American Transportation Research Institute (ATRI), Congestion Impact Analysis of Freight Significant Highway Locations.
The National Performance Management Research Data Set (NPMRDS) truck probe data also measure corridor-level travel time reliability. Travel time reliability is derived from measured average speeds of commercial vehicles for the top 25 domestic freight corridors annually. Compared with simple average measures of congestion, measures of travel time reliability—the certainty (or variability) of travel conditions from day to day—provide a different perspective of improved travel beyond a simple average travel time. From an economic perspective, low reliability can cause drivers to budget extra time in planning trips or to suffer the consequences of being delayed. This extra time usually carries higher value beyond the typical travel time. Unpredictable travel times are problematic for truck drivers and freight receivers because they can cause unwanted schedule changes that can add cost and delay to their operations.
Exhibit 12-13 shows the Travel Reliability Planning Time Index for the 25 freight-significant corridors on the NHFN. Values greater than 1.00 illustrate travel time variability. Higher numbers indicate greater variability, and the numbers after the decimal points can be treated as percentages. For example, the 2014 Travel Reliability Planning Time Index for Corridor 25 was 1.85. This means travel times were 85 percent longer on heavy travel days, compared with normal days, for drivers traveling the I-95 corridor from Richmond, VA to New Haven, CT.
| Ranking | Corridor | 2011 | 2012 | 2013 | 2014 | 2015 |
|---|---|---|---|---|---|---|
| 1 | I-5: Medford, OR to Seattle | 1.31 | 1.34 | 1.37 | 1.41 | 1.48 |
| 2 | I-5/CA 99: Sacramento to Los Angeles | 1.28 | 1.33 | 1.34 | 1.33 | 1.35 |
| 3 | I-10: Los Angeles to Tucson | 1.24 | 1.21 | 1.26 | 1.27 | 1.34 |
| 4 | I-10: San Antonio to New Orleans | 1.23 | 1.28 | 1.30 | 1.31 | 1.31 |
| 5 | I-10: Pensacola to I-75 | 1.06 | 1.06 | 1.06 | 1.07 | 1.06 |
| 6 | I-30: Little Rock to Dallas | 1.21 | 1.15 | 1.14 | 1.17 | 1.18 |
| 7 | I-35: Laredo to Oklahoma City | 1.24 | 1.24 | 1.28 | 1.30 | 1.39 |
| 8 | I-40: Oklahoma City to Flagstaff | 1.10 | 1.12 | 1.11 | 1.11 | 1.12 |
| 9 | I-40: Knoxville to Little Rock | 1.17 | 1.18 | 1.20 | 1.24 | 1.16 |
| 10 | I-40: Raleigh to Asheville | 1.11 | 1.12 | 1.14 | 1.15 | 1.15 |
| 11 | I-55/I-39/I-94: St. Louis to Minneapolis | 1.15 | 1.13 | 1.14 | 1.14 | 1.15 |
| 12 | I-57/I-74: I-24 (IL) to I-55 (IL) | 1.09 | 1.12 | 1.15 | 1.14 | 1.10 |
| 13 | I-70: Kansas City to Columbus | 1.21 | 1.18 | 1.20 | 1.20 | 1.21 |
| 14 | I-65/I-24: Chattanooga to Nashville to Chicago | 1.26 | 1.26 | 1.29 | 1.34 | 1.34 |
| 15 | I-75: Tampa to Knoxville | 1.16 | 1.16 | 1.20 | 1.21 | 1.22 |
| 16 | I-75: Lexington to Detroit | 1.26 | 1.24 | 1.29 | 1.30 | 1.34 |
| 17 | I-78/I-76: New York to Pittsburgh | 1.16 | 1.20 | 1.20 | 1.21 | 1.22 |
| 18 | I-80: New York to Cleveland | 1.26 | 1.19 | 1.19 | 1.20 | 1.22 |
| 19 | I-80: Cleveland to Chicago | 1.18 | 1.14 | 1.17 | 1.21 | 1.17 |
| 20 | I-80: Chicago to I-76 (CO/NE border) | 1.13 | 1.12 | 1.12 | 1.12 | 1.12 |
| 21 | I-81: Harrisburg to I-40 (Knoxville) | 1.11 | 1.12 | 1.11 | 1.11 | 1.10 |
| 22 | I-84: Boise to I-86 | 1.14 | 1.08 | 1.09 | 1.14 | 1.14 |
| 23 | I-94: Chicago to Detroit | 1.09 | 1.08 | 1.10 | 1.15 | 1.11 |
| 24 | I-95: Miami to I-26 (SC) | 1.17 | 1.18 | 1.21 | 1.23 | 1.26 |
| 25 | I-95: Richmond to New Haven | 1.62 | 1.59 | 1.69 | 1.85 | 1.76 |
Finally, as shown below in Exhibit 12-14, the NPMRDS truck probe data indicate the average travel speed for the top 25 freight-significant corridors on the NHFN from 2011 to 2015. The average travel speeds shown serve as an indicator of congestion for each corridor.
The efficient and reliable movement of goods is important to the U.S. economy. Truck travel time and speed are two indicators of transportation system performance. Slower speeds and unreliable travel times caused by congestion and inclement weather conditions increase fuel costs and affect efficiency and productivity.
| Ranking | Corridor | 2011 | 2012 | 2013 | 2014 | 2015 |
|---|---|---|---|---|---|---|
| 1 | I-5: Medford, OR to Seattle | 56.64 | 56.33 | 56.12 | 54.94 | 56.15 |
| 2 | I-5/CA 99: Sacramento to Los Angeles | 56.19 | 56.05 | 56.11 | 55.99 | 56.11 |
| 3 | I-10: Los Angeles to Tucson | 59.53 | 59.42 | 59.42 | 58.60 | 59.54 |
| 4 | I-10: San Antonio to New Orleans | 61.79 | 61.45 | 61.77 | 60.82 | 61.78 |
| 5 | I-10: Pensacola to I-75 | 64.69 | 63.90 | 64.03 | 63.99 | 64.27 |
| 6 | I-30: Little Rock to Dallas | 61.78 | 62.64 | 62.82 | 62.13 | 62.70 |
| 7 | I-35: Laredo to Oklahoma City | 61.06 | 61.45 | 61.05 | 59.76 | 60.29 |
| 8 | I-40: Oklahoma City to Flagstaff | 63.99 | 63.86 | 64.15 | 64.31 | 64.18 |
| 9 | I-40: Knoxville to Little Rock | 62.34 | 62.24 | 62.14 | 61.53 | 62.30 |
| 10 | I-40: Raleigh to Asheville | 62.42 | 62.36 | 62.32 | 61.62 | 61.90 |
| 11 | I-55/I-39/I-94: St. Louis to Minneapolis | 62.00 | 62.37 | 62.16 | 62.10 | 62.57 |
| 12 | I-57/I-74: I-24 (IL) to I-55 (IL) | 62.86 | 62.71 | 62.56 | 62.76 | 63.59 |
| 13 | I-70: Kansas City to Columbus | 61.51 | 61.94 | 61.81 | 61.50 | 61.98 |
| 14 | I-65/I-24: Chattanooga to Nashville to Chicago | 60.97 | 61.04 | 60.85 | 59.57 | 59.95 |
| 15 | I-75: Tampa to Knoxville | 62.74 | 62.47 | 62.39 | 61.67 | 62.13 |
| 16 | I-75: Lexington to Detroit | 60.18 | 60.76 | 60.66 | 59.30 | 59.43 |
| 17 | I-78/I-76: New York to Pittsburgh | 59.59 | 59.94 | 59.88 | 59.34 | 59.70 |
| 18 | I-80: New York to Cleveland | 60.78 | 61.12 | 61.13 | 60.68 | 61.14 |
| 19 | I-80: Cleveland to Chicago | 61.86 | 62.26 | 61.99 | 61.57 | 62.09 |
| 20 | I-80: Chicago to I-76 (CO/NE border) | 62.96 | 63.16 | 63.36 | 63.39 | 63.64 |
| 21 | I-81: Harrisburg to I-40 (Knoxville) | 62.38 | 62.42 | 62.60 | 62.60 | 62.53 |
| 22 | I-84: Boise to I-86 | 61.81 | 62.53 | 62.53 | 62.43 | 62.91 |
| 23 | I-94: Chicago to Detroit | 59.89 | 60.54 | 59.95 | 58.74 | 59.24 |
| 24 | I-95: Miami to I-26 (SC) | 63.07 | 62.63 | 62.48 | 61.77 | 62.27 |
| 25 | I-95: Richmond to New Haven | 55.36 | 55.52 | 54.70 | 51.72 | 54.33 |
[5] Weekdays (24/7). [ Return to Exhibit 12-14 ]
Source: NPMRDS truck probe data.
Data Needs
FHWA prepared this first baseline report on the conditions and performance of the NHFN with available data to be responsive to the statutory reporting requirements of the FAST Act. Although conditions and performance data are available for most of the roadways on the NHFN, actions would be needed to report such data comprehensively for all four subsystems of roadways that make up the NHFN. Specifically, improving the database relationship between NHFN geography and HPMS and NBI data will greatly assist in the preparation of future NHFN conditions and performance reports and allow for a better understanding of the system and its needs.
The HPMS is a critical data set, containing information on pavement characteristics, conditions, and truck volumes. More than 85 percent of the NHFN consists of Interstate mileage for which the HPMS collects comprehensive conditions and performance data including pavement condition information and truck volume data. The remaining 15 percent of the NHFN is made up of 4,082 non-Interstate miles that are part of the PHFS portion of the NHFN and the estimated total possible CUFC and CRFC mileage that States and MPOs may elect to designate as part of the NHFN. For this 15 percent of roadways, less comprehensive conditions and performance data are available through the HPMS. These data may include sampled data rather than roadway-specific data or the data may not be readily available for States to report in the HPMS.
Similar limitations exist with respect to the NHFN data from the NBI. Condition data for all bridges on the Nation's roadways are reported to FHWA through the NBI. However, at the time of the drafting of this report, there was no specific identifier in the NBI data set indicating whether a bridge is on the NHFN. Future versions of the NBI will include the NHFN as a specific identifier in its coding guide. This identifier will allow for more accurate reporting on the condition of bridges on all four roadway subsystems that make up the NHFN.
In summary, this 2017 report provides a baseline description of the current conditions and performance of the NHFN. Future reports are expected to offer more detailed analysis of the trends and patterns in freight conditions and performance.
Furthermore, the NHFN is an evolving network based on changes to the Interstate System. The network will also change in size and coverage as States and MPOs elect to designate, de-designate, or re-designate CRFCs and CUFCs, and when DOT makes subsequent re-designations of the NHFN.
Finally, the measures summarized and graphed in this report, and their utility and comprehensiveness, are a function of data quality and availability. Because the FAST Act requires an assessment report of the NHFN every 2 years, subsequent versions of this report will provide the opportunity, subject to the availability of new, improved data, to replace some exhibits and improve others to reflect the evolving quality of the data and the performance measures.
previous