Freight Facts and Figures 2013
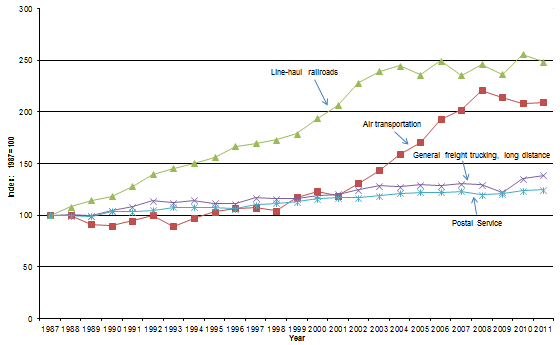
Figure 4-2. Productivity in Selected Transportation Industries: 1987-2011
Between 1987 and 2011, output-per-hour worked more than doubled in line-haul railroading. (Line-haul railroads do not include switching and terminal operations or short-distance/local railroads.) Long-distance, general-freight trucking grew by 39 percent over the same period. However, in recent years trucking has grown more rapidly. (Long-distance, general-freight trucking establishments exclude local trucking and truck operators that require specialized equipment, such as flatbeds, tankers, or refrigerated trailers.)
Figure 4-2
[PDF 16KB]
Data represented in the figure.
(Output per Employee,1 Index: 1987 = 100)
| Output per hour worked | 1987 | 1988 | 1989 | 1990 | 1991 | 1992 | 1993 | 1994 | 1995 | 1996 | 1997 | 1998 | 1999 | 2000 | 2001 | 2002 | 2003 | 2004 | 2005 | 2006 | 2007 | 2008 | 2009 | 2010 | 2011 |
|---|---|---|---|---|---|---|---|---|---|---|---|---|---|---|---|---|---|---|---|---|---|---|---|---|---|
| Air transportation (R) | 100 | 100 | 91 | 90 | 94 | 100 | 89 | 97 | 103 | 107 | 107 | 104 | 117 | 123 | 119 | 131 | 143 | 159 | 171 | 193 | 202 | 221 | 214 | 209 | 209 |
| Line-haul railroads | 100 | 108 | 115 | 119 | 128 | 140 | 145 | 150 | 156 | 167 | 170 | 173 | 179 | 194 | 207 | 228 | 240 | 245 | 236 | 249 | 236 | 246 | 237 | 256 | (R) 249 |
| General freight trucking, long-distance | 100 | 101 | 100 | 104 | 108 | 114 | 112 | 115 | 112 | 111 | 117 | 116 | 116 | 119 | 120 | 125 | 128 | 127 | 129 | 128 | 130 | 130 | 122 | 135 | (R) 139 |
| Postal Service | 100 | 99 | 99 | 104 | 103 | 105 | 108 | 108 | 108 | 106 | 110 | 112 | 113 | 116 | 117 | 117 | 119 | 121 | 122 | 122 | 123 | 120 | (R) 121 | (R) 123 | (R) 125 |
Key: R = revised.
1Based on the number of paid hours. Real gross domestic product (GDP) in the business and nonfarm business sectors is the basis of the output components of the productivity measures. These output components are based on and are consistent with the National Income and Product Accounts, including the GDP measure, prepared by the Bureau of Economic Analysis of the U.S. Department of Commerce.
Notes:
In 2009, the Bureau of Labor Statistics (BLS) revised its data for air transportation output per hour worked to include both full-time and part-time workers. Prior to 2009, BLS assumed all air transportation workers were full-time employees.
Source:
U.S. Department of Labor, Bureau of Labor Statistics, Industry Productivity, available at www.bls.gov/lpc/ as of October 2, 2013.
You may need the Microsoft Excel Viewer to view Excel files on this page.
You may need the Adobe® Reader® to view the PDFs on this page.