Freight Facts and Figures 2013
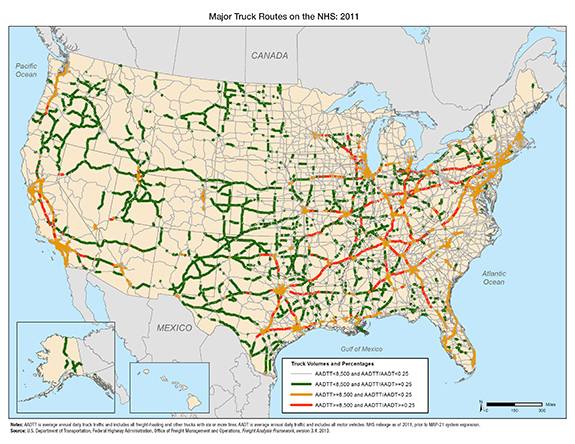
Figure 3-14. Major Truck Routes on the National Highway System: 2011
Selected routes carry a significant concentration of trucks, either as an absolute number or as a percentage of the traffic stream. Nearly 14,530 miles of the NHS carry more than 8,500 trucks per day on sections where at least every fourth vehicle is a truck. With each truck carrying an average of 16 tons of cargo, 8,500 trucks per day haul approximately 50 million tons per year.
Figure 3-14
Notes:
AADTT is average annual daily truck traffic and includes all freight-hauling and other trucks with six or more tires. AADT is average annual daily traffic and includes all motor vehicles. NHS mileage as of 2011, prior to MAP-21 system expansion.
Source:
U.S. Department of Transportation, Federal Highway Administration, Office of Freight Management and Operations, Freight Analysis Framework, version 3.4, 2013.
You may need the Adobe® Reader® to view the PDFs on this page.