Freight Facts and Figures 2013
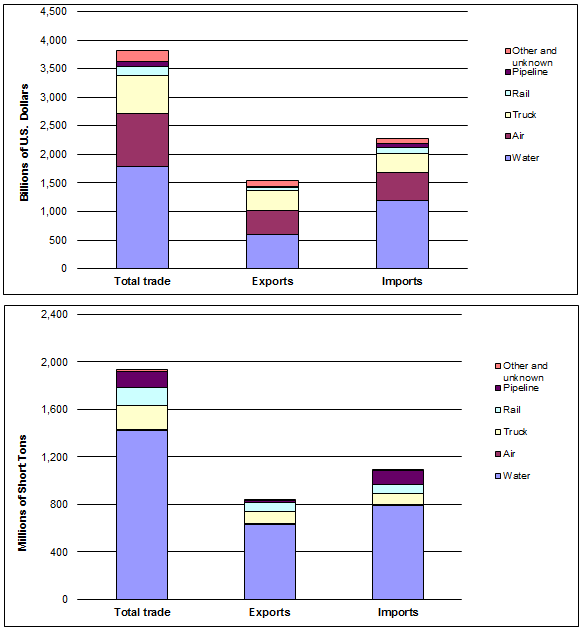
Figures 2-5 and 2-5M. U.S. International Merchandise Trade by Transportation Mode: 2012
Approximately 75 percent of freight tons in U.S. foreign trade moved by water in 2012, but air and truck transportation are also important when the value of goods traded is considered. By value, the water share dropped to about 49 percent, with air and truck accounting for nearly 26 percent and 18 percent respectively. Together, rail and pipeline accounted for about 7 percent of the total.
Figure 2-5
[PDF 13KB]
Data represented in the figure.
| Mode | Billions of U.S. Dollars | ||
|---|---|---|---|
| Total trade | Exports | Imports | |
| Water | 1,782 | 592 | 1,190 |
| Air | 927 | 427 | 500 |
| Truck | 665 | 343 | 321 |
| Rail | 168 | 61 | 107 |
| Pipeline | 77 | 9 | 68 |
| Other and unknown | 203 | 115 | 88 |
| Total, all modes | 3,822 | 1,547 | 2,275 |
| Mode | Millions of Short Tons | ||
|---|---|---|---|
| Total trade | Exports | Imports | |
| Water | 1,425 | 631 | 793 |
| Air | 8 | 4 | 4 |
| Truck | 196 | 105 | 91 |
| Rail | 154 | 72 | 82 |
| Pipeline | 136 | 24 | 112 |
| Other and unknown | 21 | 8 | 13 |
| Total, all modes | 1,939 | 844 | 1,095 |
Note:
Notes: 1 short ton = 2,000 pounds. The U.S. Department of Transportation (USDOT), Research and Innovative Technology Administration, Bureau of Transportation Statistics estimated 2012 weight data for truck, rail, pipeline, and other and unknown modes using value-to-weight ratios derived from imported commodities. Totals for the most recent year differ slightly from the USDOT, Federal Highway Administration, Office of Freight Management and Operations, Freight Analysis Framework (FAF) due to variations in coverage and FAF conversion of values to constant dollars. Numbers may not add to totals due to rounding.
Sources:
Total, water and air data: U.S. Department of Commerce, U.S. Census Bureau, Foreign Trade Division, FT920 – U.S. Merchandise Trade: Selected Highlights (Washington, DC: February 2013).
Truck, rail, pipeline, and other and unknown data: U.S. Department of Transportation, Bureau of Transporation Statistics, North American Transborder Freight Data, available at http://transborder.bts.gov/programs/international/transborder/ as of October 17, 2013.
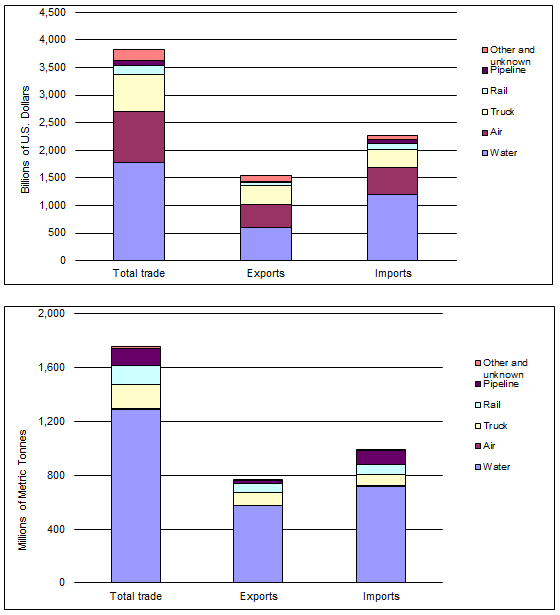
Figure 2-5M
[PDF 3.23MB]
Data represented in the figure.
| Mode | Billions of U.S. Dollars | ||
|---|---|---|---|
| Total trade | Exports | Imports | |
| Water | 1,782 | 592 | 1,190 |
| Air | 927 | 427 | 500 |
| Truck | 665 | 343 | 321 |
| Rail | 168 | 61 | 107 |
| Pipeline | 77 | 9 | 68 |
| Other and unknown | 203 | 115 | 88 |
| Total, all modes | 3,822 | 1,547 | 2,275 |
| Mode | Millions of Metric Tonnes | ||
|---|---|---|---|
| Total trade | Exports | Imports | |
| Water | 1,293 | 573 | 720 |
| Air | 7 | 3 | 4 |
| Truck | 178 | 96 | 82 |
| Rail | 140 | 65 | 74 |
| Pipeline | 123 | 22 | 101 |
| Other and unknown | 19 | 7 | 12 |
| Total, all modes | 1,759 | 766 | 994 |
Note:
Notes: 1 metric tonne = 1.1023 short tons. The U.S. Department of Transportation (USDOT), Research and Innovative Technology Administration, Bureau of Transportation Statistics estimated 2010 weight data for truck, rail, pipeline, and other and unknown modes using value-to-weight ratios derived from imported commodities. Totals for the most recent year differ slightly from the USDOT, Federal Highway Administration, Office of Freight Management and Operations, Freight Analysis Framework (FAF) due to variations in coverage and FAF conversion of values to constant dollars. Numbers may not add to totals due to rounding.
Sources:
Total, water and air data: U.S. Department of Commerce, U.S. Census Bureau, Foreign Trade Division, FT920 - U.S. Merchandise Trade: Selected Highlights (Washington, DC: February 2013).
Truck, rail, and pipeline, and other and unknown data: U.S. Department of Transportation, Bureau of Transporation Statistics, North American Transborder Freight Data, available at http://transborder.bts.gov/programs/international/transborder/ as of October 17, 2013.
You may need the Microsoft Excel Viewer to view Excel files on this page.
You may need the Adobe® Reader® to view the PDFs on this page.