Freight Facts and Figures 2012
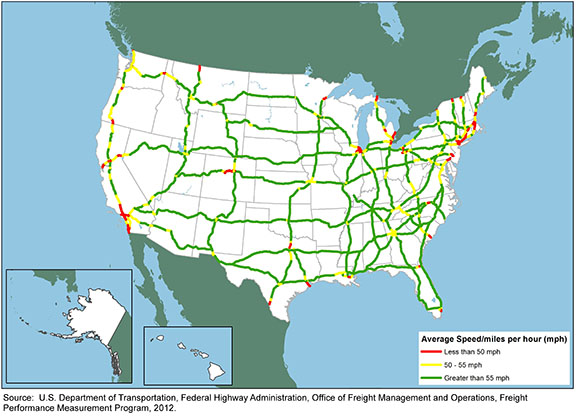
Figure 3-20. Intensity of Truck Freight Congestion on Selected Interstate Highways: 2011
To better understand the intensity of truck congestion and reliably issues, FHWA combined truck volumes from the Freight Analysis Framework with average truck speeds measured in the Freight Performance Measurement Program. This type of information is useful to private- and public-sector freight stakeholders that wish to better understand the severity of congestion and mobility constraints experienced along the highway transportation system. Many major urban areas have Interstates with significant truck volumes that are experiencing average speeds of less than 55 mph.
Source:
U.S. Department of Transportation, Federal Highway Administration, Office of Freight Management and Operations, Performance Measurement Program, 2012.
You may need the Microsoft Excel Viewer to view Excel files on this page.
You may need the Adobe® Reader® to view the PDFs on this page.