Freight Facts and Figures 2011
Figure 3-4. Top 25 Water Ports by Containerized Cargo: 2010
Modes of transportation frequently work together to move high-vale, time-sensitive cargo. The classic forms of rail intermodal transportation are trailer-on-flatcar and container-on-flatcar, and these are spread throughout the United States. The largest concentrations are on routes between Pacific Coast ports and Chicago, southern California and Texas, and Chicago and New York.
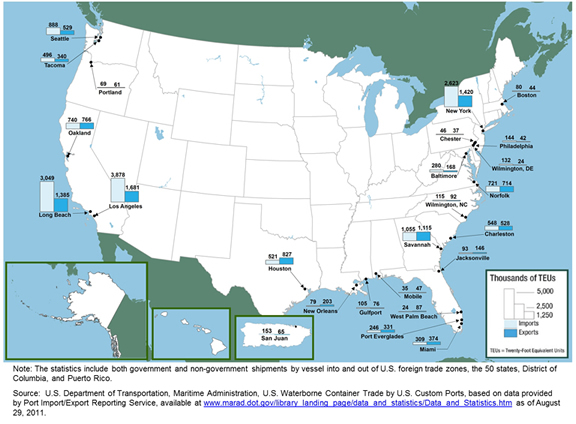
Data represented in the figure.
Thousands of TEUs
| Ports | Rank | Export | Import |
|---|---|---|---|
| Los Angeles, CA | 1 | 1,681 | 3,878 |
| Long Beach, CA | 2 | 1,385 | 3,049 |
| New York, NY | 3 | 1,420 | 2,623 |
| Savannah, GA | 4 | 1,115 | 1,055 |
| Oakland, CA | 5 | 766 | 740 |
| Norfolk, VA | 6 | 714 | 721 |
| Seattle, WA | 7 | 529 | 888 |
| Houston, TX | 8 | 827 | 521 |
| Charleston, SC | 9 | 528 | 548 |
| Tacoma, WA | 10 | 340 | 496 |
| Miami, FL | 11 | 374 | 309 |
| Port Everglades, FL | 12 | 331 | 246 |
| Baltimore, MD | 13 | 168 | 280 |
| New Orleans, LA | 14 | 203 | 79 |
| Jacksonville, FL | 15 | 146 | 93 |
| San Juan, PR | 16 | 65 | 153 |
| Wilmington, NC | 17 | 92 | 115 |
| Philadelphia, PA | 18 | 42 | 144 |
| Gulfport, MS | 19 | 76 | 105 |
| Wilmington, DE | 20 | 24 | 132 |
| Portland, OR | 21 | 61 | 69 |
| Boston, MA | 22 | 44 | 80 |
| West Palm Beach, FL | 23 | 87 | 24 |
| Chester, PA | 24 | 37 | 46 |
| Mobile, AL | 25 | 47 | 35 |
Key: TEUs = twenty-foot equivalent units.
Note:
The statistics include both government and non-government shipments by vessel into and out of U.S. foreign trade zones, the 50 states, District of Columbia, and Puerto Rico.
Source:
U.S. Department of Transportation, Maritime Administration, U.S. Waterborne Container Trade by U.S. Custom Ports, 1997-2009, based on data provided by Port Import/Export Reporting Service, available at www.marad.dot.gov/library_landing_page/data_and_statistics/Data_and_Statistics.htm as of July 6, 2010.
To view Excel files, you can use the Microsoft Excel Viewer.
You will need the Adobe Reader to view the PDFs on this page.