Freight Facts and Figures 2011
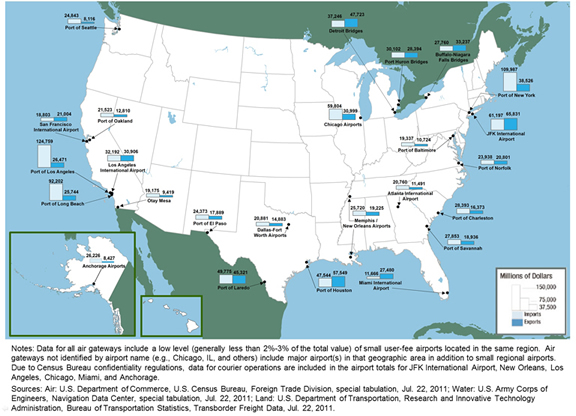
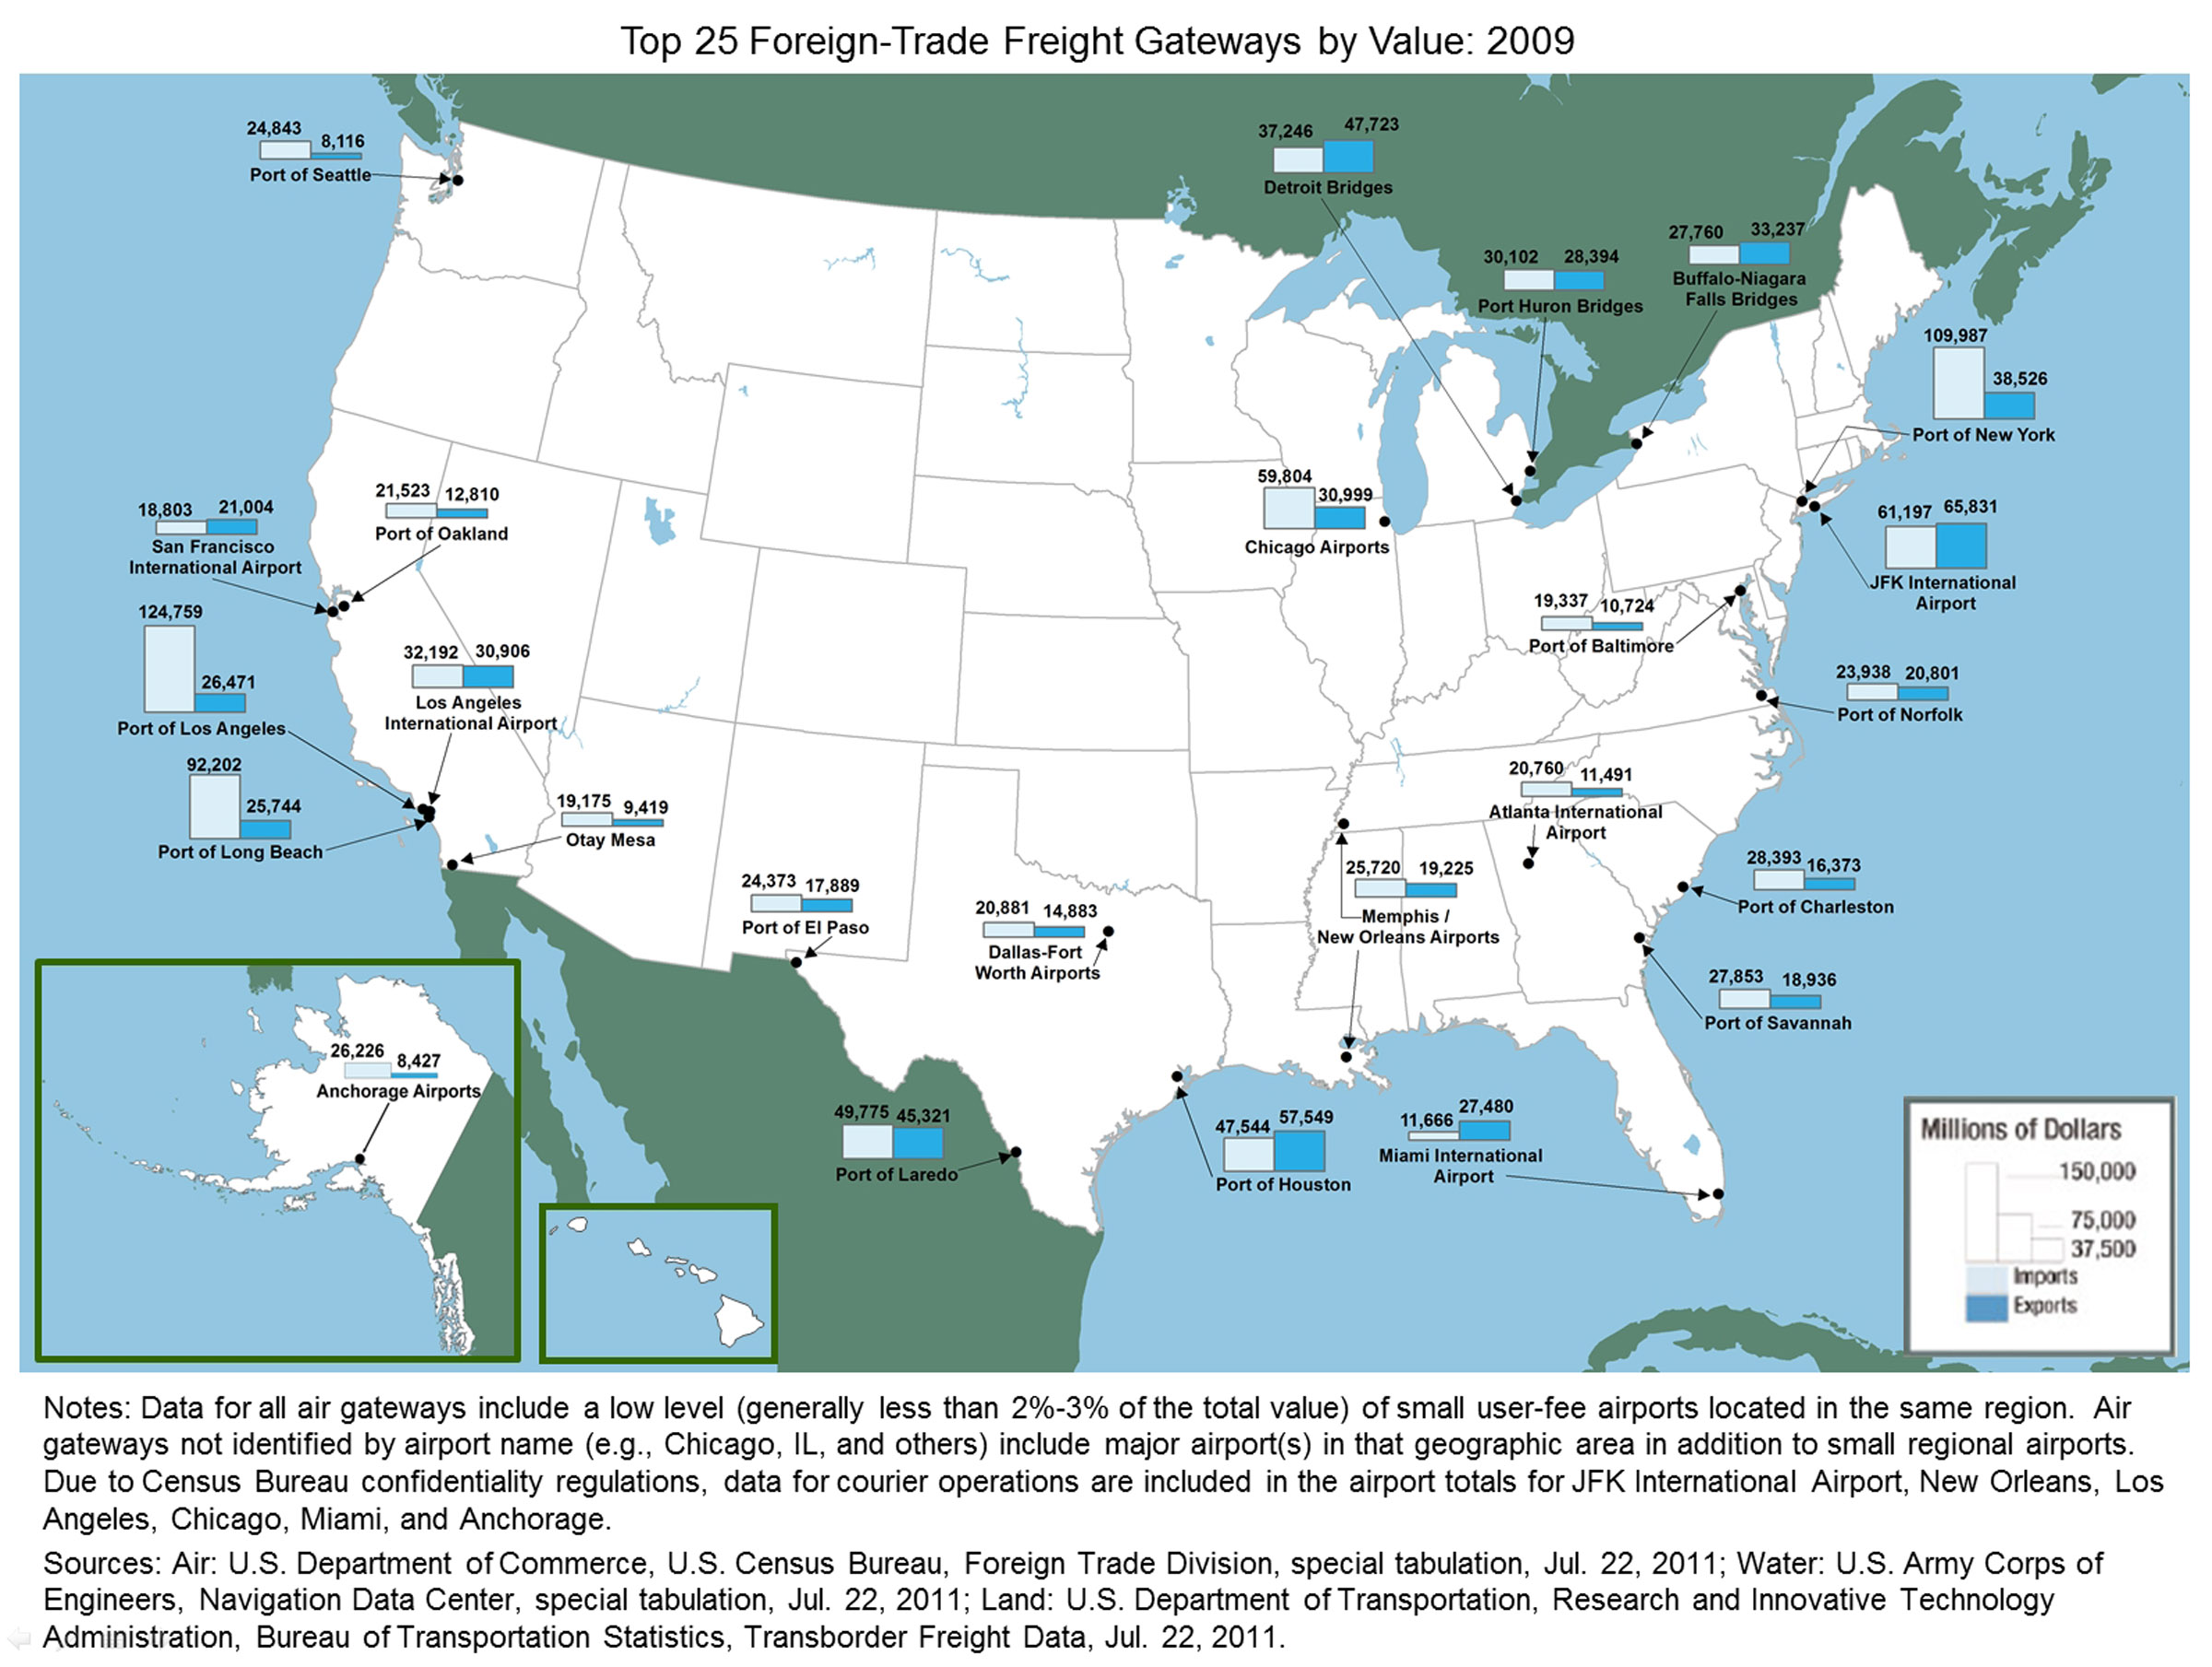
Figure 3-2. Top 25 Foreign-Trade Gateways by Value: 2009
Transportation facilities that move international trade into and out of the United States demonstrate the importance of all modes and intermodal combinations to global connectivity. The top 25 foreign-trade gateways measured by value of shipments are comprised of 10 water ports, 6 land-border crossings, and 9 air gateways.
Data represented in the figure.
Billions of dollars
| Gateway | Type | Rank | Exports | Imports | Total |
|---|---|---|---|---|---|
| Los Angeles, CA | Water | 1 |
26.5 | 124.8 | 151.2 |
| New York, NY | Water | 2 |
38.5 | 110.0 | 148.5 |
| John F. Kennedy International, NY | Air | 3 |
65.8 | 61.2 | 127.0 |
| Long Beach, CA | Water | 4 |
25.8 | 92.2 | 118.0 |
| Houston, TX | Water | 5 |
57.5 | 47.5 | 105.1 |
| Laredo, TX | Land | 6 |
45.3 | 49.8 | 95.1 |
| Chicago, IL | Air | 7 |
31.0 | 59.8 | 90.8 |
| Detroit, MI | Land | 8 |
47.7 | 37.2 | 85.0 |
| Los Angeles International, CA | Air | 9 |
30.9 | 32.2 | 63.1 |
| Buffalo-Niagara Falls, NY | Land | 10 |
33.2 | 27.8 | 61.0 |
| Port Huron, MI | Land | 11 |
28.4 | 30.1 | 58.5 |
| Savannah, GA | Water | 12 |
18.9 | 27.9 | 46.8 |
| New Orleans, LA | Air | 13 |
19.2 | 25.7 | 44.9 |
| Charleston, SC | Water | 14 |
16.4 | 28.4 | 44.8 |
| Norfolk, VA | Water | 15 |
20.8 | 23.9 | 44.7 |
| El Paso, TX | Land | 16 |
17.9 | 24.4 | 42.3 |
| San Francisco International, CA | Air | 17 |
21.0 | 18.8 | 39.8 |
| Miami International Airport Cargo Facilities, FL | Air | 18 |
27.5 | 11.7 | 39.1 |
| Dallas-Fort Worth, TX | Air | 19 |
14.9 | 20.9 | 35.8 |
| Anchorage, AK | Air | 20 |
8.4 | 26.2 | 34.7 |
| Oakland, CA | Water | 21 |
12.8 | 21.5 | 34.3 |
| Seattle, WA | Water | 22 |
8.1 | 24.8 | 33.0 |
| Atlanta, GA | Air | 23 |
11.5 | 20.8 | 32.3 |
| Baltimore, MD | Water | 24 |
10.7 | 19.3 | 30.1 |
| Otay Mesa, CA | Land | 25 |
9.4 | 19.2 | 28.6 |
Notes:
All data: Trade levels reflect the mode of transportation as a shipment enters or exits at a border port. Flows through individual ports are based on reported data collected from U.S. trade documents. Trade does not include low-value shipments. (In general, these are imports valued at less than $1,250 and exports that are valued at less than $2,500). Air: Data for all air gateways include a low level (generally less than 2%-3% of the total value) of small user-fee airports located in the same region. Air gateways not identified by airport name (e.g., Chicago, IL, and others) include major airport(s) in that geographic area in addition to small regional airports. In addition, due to U.S. Census Bureau confidentiality regulations, data for courier operations are included in the airport totals for JFK International Airport, New Orleans, Los Angeles, Chicago, Miami, and Anchorage.
Source:
Air: U.S. Department of Commerce, U.S. Census Bureau, Foreign Trade Division, special tabulation, Jul. 22, 2011; Water: U.S. Army Corps of Engineers, Navigation Data Center, special tabulation, July 22, 2011; Land: U.S. Department of Transportation, Research and Innovative Technology Administration, Bureau of Transportation Statistics, North American Transborder Freight Data, July 22, 2011.
To view Excel files, you can use the Microsoft Excel Viewer.
You will need the Adobe Reader to view the PDFs on this page.