Freight Facts and Figures 2008
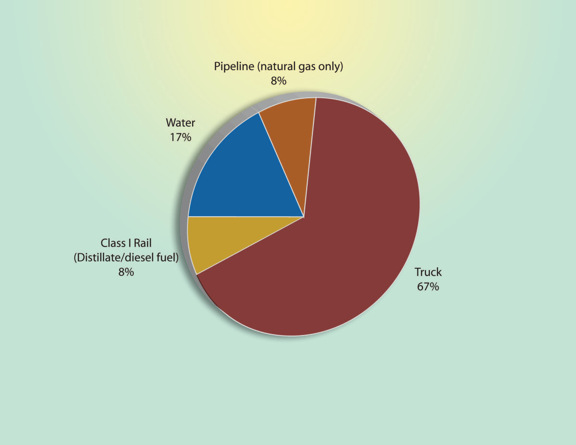
Figure 5-1. Energy Consumption by Freight Transportation Mode: 2006
In 2006, trucking accounted for two-thirds of freight transportation energy consumption. Water was a distant second with roughly one-sixth of freight energy consumption.
[PDF 191KB]
Data represented in the figure.
| 1980 | 1990 | 2000 | 2001 | 2002 | 2003 | 2004 | 2005 | 2006 | |
|---|---|---|---|---|---|---|---|---|---|
| Truck (thousand gallons) | 2,768 | 3,397 | 4,886 | 4,879 | 5,104 | 4,535 | 4,455 | (R) 5,028 | 5,124 |
| Class I Rail (Distillate/diesel fuel) (million gallons) | 541 | 432 | 513 | 515 | 517 | 531 | 563 | 568 | 581 |
| Water (thousand gallons) | 1,677 | 1,396 | 1,414 | 1,218 | 1,149 | 1,026 | 1,182 | 1,211 | 1,280 |
| Pipeline (natural gas only) (million cubic feet) | 654 | 680 | 662 | 644 | 688 | 610 | 584 | (R) 602 | 603 |
Key: R = revised.
Note:
Data do not include energy consumed by oil pipelines (crude petroleum and petroleum products) nor coal slurry/water slurry pipelines.
Sources:
Truck: U.S. Department of Transportation, Federal Highway Administration, Highway Statistics, (Washington, DC: annual issues), table VM-1.
Rail: Association of American Railroads, Railroad Facts (Washington, DC: 2007), p. 40.
Water: U.S. Department of Energy, Energy Information Administration, Fuel Oil and Kerosene Sales (Washington, DC: annual issues), tables 2 and 4; U.S. Department of Transportation, Federal Highway Administration, Highway Statistics (Washington, DC: annual issues), table MF-24.
Pipeline: U.S. Department of Energy, Natural Gas Annual 2006, DOE/EIA-0131(04) (Washington, DC: January 2008), table 15.
To view Excel files, you can use the Microsoft Excel Viewer.
![]() You will need the Adobe
Acrobat Reader to view the PDFs on this page.
You will need the Adobe
Acrobat Reader to view the PDFs on this page.