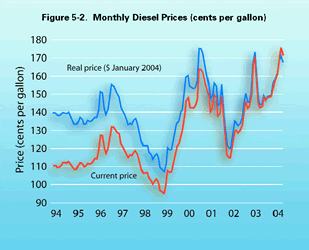
Figure 5-2: Monthly Diesel Prices (cents per gallon)
Diesel prices were about 16 percent higher in March 2004 than 10 years earlier (in inflation-adjusted terms). Over that period prices bottomed out in March 1999 at just under $1.00 a gallon (in current dollars). Except for the period July 2001 through September 2002, prices have generally been above the $1.40 mark since February 2000 (also in current dollars).

Data represented in the figure
Table in Excel format
| Date | Current | Real ($ January 2004) |
|---|---|---|
| Mar-1994 | 110.7 | 139.8 |
| Apr-1994 | 110.7 | 139.7 |
| May-1994 | 110.0 | 138.6 |
| Jun-1994 | 110.3 | 138.5 |
| Jul-1994 | 111.0 | 139.0 |
| Aug-1994 | 112.3 | 140.1 |
| Sep-1994 | 112.5 | 140.0 |
| Oct-1994 | 112.2 | 139.5 |
| Nov-1994 | 113.1 | 140.3 |
| Dec-1994 | 111.3 | 137.8 |
| Jan-1995 | 109.8 | 135.6 |
| Feb-1995 | 108.8 | 133.9 |
| Mar-1995 | 108.8 | 133.6 |
| Apr-1995 | 110.4 | 135.1 |
| May-1995 | 112.6 | 137.5 |
| Jun-1995 | 112.0 | 136.5 |
| Jul-1995 | 110.0 | 133.9 |
| Aug-1995 | 110.5 | 134.3 |
| Sep-1995 | 111.9 | 135.8 |
| Oct-1995 | 111.5 | 135.0 |
| Nov-1995 | 112.0 | 135.4 |
| Dec-1995 | 113.0 | 136.4 |
| Jan-1996 | 114.5 | 137.5 |
| Feb-1996 | 114.5 | 137.2 |
| Mar-1996 | 118.3 | 141.3 |
| Apr-1996 | 127.5 | 151.8 |
| May-1996 | 127.3 | 151.3 |
| Jun-1996 | 120.1 | 142.4 |
| Jul-1996 | 117.6 | 139.1 |
| Aug-1996 | 120.1 | 141.9 |
| Sep-1996 | 126.5 | 149.0 |
| Oct-1996 | 132.3 | 155.4 |
| Nov-1996 | 132.3 | 154.8 |
| Dec-1996 | 130.9 | 152.9 |
| Jan-1997 | 129.1 | 150.5 |
| Feb-1997 | 128.0 | 148.9 |
| Mar-1997 | 122.9 | 142.9 |
| Apr-1997 | 121.2 | 140.9 |
| May-1997 | 119.6 | 138.9 |
| Jun-1997 | 117.3 | 136.0 |
| Jul-1997 | 115.1 | 133.3 |
| Aug-1997 | 116.5 | 134.6 |
| Sep-1997 | 116.0 | 133.7 |
| Oct-1997 | 118.3 | 136.0 |
| Nov-1997 | 119.2 | 136.9 |
| Dec-1997 | 116.6 | 133.9 |
| Jan-1998 | 112.0 | 128.4 |
| Feb-1998 | 108.4 | 124.4 |
| Mar-1998 | 106.3 | 121.9 |
| Apr-1998 | 106.7 | 122.2 |
| May-1998 | 106.9 | 122.2 |
| Jun-1998 | 104.1 | 118.8 |
| Jul-1998 | 102.9 | 117.1 |
| Aug-1998 | 100.7 | 114.6 |
| Sep-1998 | 102.4 | 116.4 |
| Oct-1998 | 103.9 | 117.7 |
| Nov-1998 | 102.2 | 115.7 |
| Dec-1998 | 97.3 | 110.0 |
| Jan-1999 | 96.7 | 109.0 |
| Feb-1999 | 95.9 | 108.2 |
| Mar-1999 | 99.7 | 112.4 |
| Apr-1999 | 107.9 | 120.9 |
| May-1999 | 107.3 | 120.1 |
| Jun-1999 | 107.4 | 120.2 |
| Jul-1999 | 112.2 | 125.0 |
| Aug-1999 | 117.2 | 130.3 |
| Sep-1999 | 121.5 | 134.5 |
| Oct-1999 | 122.8 | 135.7 |
| Nov-1999 | 126.3 | 139.4 |
| Dec-1999 | 129.2 | 142.2 |
| Jan-2000 | 135.6 | 148.8 |
| Feb-2000 | 146.1 | 159.7 |
| Mar-2000 | 147.9 | 160.7 |
| Apr-2000 | 142.2 | 154.6 |
| May-2000 | 142.0 | 154.1 |
| Jun-2000 | 142.1 | 153.3 |
| Jul-2000 | 143.4 | 154.3 |
| Aug-2000 | 146.6 | 157.7 |
| Sep-2000 | 163.7 | 175.2 |
| Oct-2000 | 163.7 | 174.9 |
| Nov-2000 | 162.1 | 172.9 |
| Dec-2000 | 156.5 | 166.5 |
| Jan-2001 | 152.4 | 161.2 |
| Feb-2001 | 149.2 | 157.6 |
| Mar-2001 | 139.9 | 147.7 |
| Apr-2001 | 142.2 | 149.7 |
| May-2001 | 149.6 | 156.7 |
| Jun-2001 | 148.2 | 154.8 |
| Jul-2001 | 137.5 | 144.0 |
| Aug-2001 | 139.0 | 145.4 |
| Sep-2001 | 149.5 | 156.0 |
| Oct-2001 | 134.8 | 141.1 |
| Nov-2001 | 125.9 | 131.8 |
| Dec-2001 | 116.7 | 122.3 |
| Jan-2002 | 115.3 | 120.6 |
| Feb-2002 | 115.2 | 120.3 |
| Mar-2002 | 123.0 | 128.1 |
| Apr-2002 | 130.9 | 135.5 |
| May-2002 | 130.5 | 135.1 |
| Jun-2002 | 128.6 | 132.9 |
| Jul-2002 | 129.9 | 134.1 |
| Aug-2002 | 132.8 | 136.6 |
| Sep-2002 | 141.1 | 144.9 |
| Oct-2002 | 146.2 | 149.9 |
| Nov-2002 | 142.0 | 145.4 |
| Dec-2002 | 142.9 | 146.2 |
| Jan-2003 | 148.8 | 151.7 |
| Feb-2003 | 165.4 | 167.8 |
| Mar-2003 | 170.8 | 172.5 |
| Apr-2003 | 153.3 | 155.3 |
| May-2003 | 145.1 | 147.1 |
| Jun-2003 | 142.4 | 144.2 |
| Jul-2003 | 143.5 | 145.1 |
| Aug-2003 | 148.7 | 149.7 |
| Sep-2003 | 146.7 | 147.2 |
| Oct-2003 | 148.1 | 148.8 |
| Nov-2003 | 148.2 | 149.2 |
| Dec-2003 | 149.0 | 149.7 |
| Jan-2004 | 155.1 | 155.1 |
| Feb-2004 | 158.2 | 157.8 |
| Mar-2004 | 162.9 | 161.7 |
| Apr-2004 | 169.2 | 167.6 |
| May-2004 | 174.6 | 171.9 |
| Jun-2004 | 171.1 | 167.9 |
Source: U.S. Department of Energy, Energy Information Agency, U.S. Petroluem Prices, available at www.eia.doe.gov as of July 15, 2004.