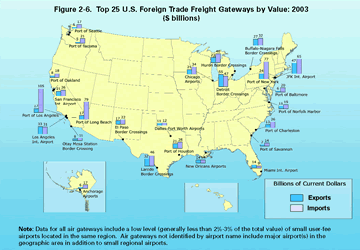
Figure 2-6: Top 25 U.S. Foreign Trade Freight Gateways by Value: 2003 ($billions)
The top 25 foreign trade gateways measured by value of shipments are comprised of 8 airports, 11 water ports, and 6 border crossings. At these 25 gateways, imports comprised 64 percent of the total. Ports with very large shares of imports relative to exports are mostly water ports (such as the ports of Los Angeles, CA, Long Beach, CA, and Tacoma, WA). Anchorage International Airport also has very high proportion of imports relative to exports

Data represented in the figure
Table in Excel format
| Gateway | Type | Rank | Exports | Imports | Total |
|---|---|---|---|---|---|
| Port of Los Angeles, CA | Water | 1 | 16.9 | 105.2 | 122.1 |
| JFK International Airport, NY | Air | 2 | 46.6 | 65.3 | 111.9 |
| Port of Detroit, MI | Land | 3 | 54.5 | 47.3 | 101.9 |
| Port of New York, NY and NJ | Water | 4 | 24.3 | 76.9 | 101.2 |
| Port of Long Beach, CA | Water | 5 | 17.2 | 78.7 | 95.9 |
| Port of Laredo, TX | Land | 6 | 32.4 | 46.4 | 78.8 |
| Los Angeles International Airport, CA | Air | 7 | 32.6 | 31.2 | 63.8 |
| Port of Huron, MI | Land | 8 | 22.7 | 39.6 | 62.3 |
| Port of Buffalo-Niagara Falls, NY | Land | 9 | 27.4 | 32.0 | 59.4 |
| Chicago, IL | Air | 10 | 20.6 | 33.7 | 54.3 |
| Port of Houston, TX | Water | 11 | 21.4 | 28.5 | 49.9 |
| San Francisco International Airport, CA | Air | 12 | 20.6 | 26.1 | 46.6 |
| Port of Charleston, SC | Water | 13 | 13.4 | 26.0 | 39.4 |
| Port of El Paso, TX | Land | 14 | 16.7 | 22.5 | 39.2 |
| Port of Norfolk Harbor, VA | Water | 15 | 11.0 | 18.5 | 29.5 |
| New Orleans, LA | Air | 16 | 13.7 | 13.7 | 27.4 |
| Port of Tacoma, WA | Water | 17 | 5.2 | 21.1 | 26.3 |
| Port of Baltimore, MD | Water | 18 | 5.7 | 20.3 | 26.0 |
| Port of Oakland, CA | Water | 19 | 7.8 | 17.4 | 25.1 |
| Dallas-Fort Worth, TX | Air | 20 | 11.4 | 12.2 | 23.6 |
| Port of Seattle, WA | Water | 21 | 5.7 | 17.4 | 23.1 |
| Miami International Airport, FL | Air | 22 | 14.0 | 8.8 | 22.7 |
| Anchorage, AK | Air | 23 | 5.6 | 16.5 | 22.1 |
| Port of Savannah, GA | Water | 24 | 7.4 | 13.9 | 21.3 |
| Port of Otay Mesa Station, CA | Land | 25 | 8.3 | 11.4 | 19.7 |
Source: U.S. Department of Transportation, Bureau of Transportation Statistics, National Transportation Statistics 2004 (Washington, DC: forthcoming)