Using Modeling and Simulation Tools for Work Zone Analysis
Printable Version [PDF 266 KB]
To view PDF files, you need the Adobe Reader.
Contact Information: WorkZoneFeedback@dot.gov
FHWA-HOP-09-038
May 2009
![]()
Work zone planning and management have become more challenging because of increasing travel demand and an aging roadway network infrastructure facing more frequent maintenance and major rehabilitation projects, while still needing to transport people and goods safely. In order to meet safety and mobility needs during highway maintenance and construction, and to meet the expectations of the traveling public, it is important for State agency staff to understand the likely work zone impacts of projects and take appropriate actions to manage these impacts. Analyzing work zone impacts can help agency personnel improve decision making as well as their overall understanding of the many considerations affecting work zone decisions: mobility, financial, environmental, safety, and user costs. Modeling and simulation tools can support efforts to conduct work zone analysis, and the Federal Highway Administration (FHWA) has created some new guides to help agency staff use these tools effectively.
Work Zone Impacts
Factors that influence the level of impacts caused by a work zone include traffic conditions and characteristics, project characteristics, geographic/physical features, and aspects of the surrounding area (e.g., alternate routes, nearby businesses).
What Is Work Zone Analysis?
Work zone analysis is the process of understanding the safety and mobility impacts of a road construction/maintenance/rehabilitation project. Having a better understanding of likely work zone impacts can help agency staff know how decisions made during planning, design, and construction are likely to affect road users, businesses, other transportation modes, and transportation system performance. More specifically, assessing work zone impacts can help agency personnel to:
- Understand the work zone safety and mobility implications of alternative project options and design strategies.
- Identify those projects that are likely to have greater work zone impacts so that resources can be allocated more effectively to projects.
- Identify strategies to manage the expected work zone impacts of a project and develop an effective transportation management plan (TMP).
- Estimate costs and allocate appropriate resources for the implementation of the work zone transportation management strategies.
- Understand, coordinate, and manage multiple projects and construction schedules to minimize overall impacts.
- Monitor and manage work zone impacts during construction, maintenance, and utility work, and adjust the transportation management strategies if needed.
- Provide information for conducting performance assessment.
- Use work zone performance assessment information to improve and update work zone policies, procedures, and practices.
Work zone analysis may include consideration of items such as the following:
- Mobility and safety impacts of the project at both the corridor and network levels, including parallel corridors, alternate routes, the transportation network, and other modes of transportation.
- The combined impacts of concurrent projects that are located near each other or on the alternate route for another project.
- Impacts on nearby intersections and interchanges, railroad crossings, and public transit and other junctions in the network.
- Impacts on evacuation routes.
- Impacts on affected public property (fire stations, parks, recreational facilities, etc.).
- Impacts on affected businesses and residences.
Use of Analysis Tools
Increased travel demand and increased need for road work has sharpened interest in the application of analytical tools to assist agency staff in better understanding projected mobility impacts resulting from work zones. The key to effective work zone analysis lies in the successful integration of analysis approach, data, and tools to provide a meaningful assessment of work zone impacts relevant to one or more key project decisions. The sophistication of the analysis needs to be matched to the complexity of the road project and the potential for impacts. Work zone impacts analysis may involve a high-level, qualitative review for some projects, and a detailed, quantitative analysis using modeling and/or simulation tools for other projects.
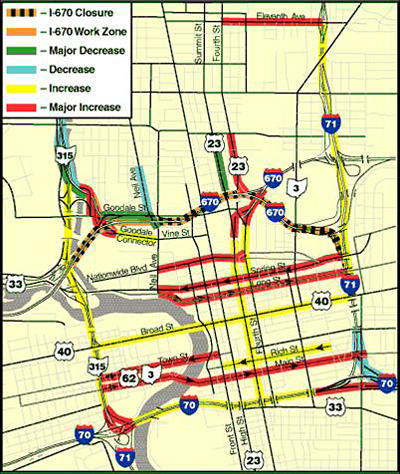
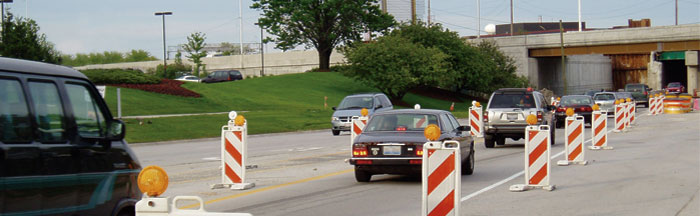
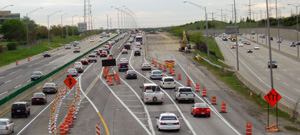
Where Will Traffic Go? Example Analysis – Ohio I-670 Project
Work zone modeling and simulation analysis should never be used to make key decisions, but instead developed as a trusted resource for understanding the potential impacts and then using this information to inform key decisions.
There are several types of tools available to support work zone impacts analysis. Analytical tools vary in level of complexity, and each tool offers different capabilities. Some tools, such as QuickZone and Construction Analysis for Pavement Rehabilitation Strategies (CA4PRS), were designed specifically for work zone-related analysis. Other traffic analysis tools that were not designed specifically for work zones may also be useful for analyzing work zone situations. Effective work zone analysis and tool selection depends on schedule and resource constraints, data availability and quality, work zone characteristics, and the decisions that need to be supported.
Work Zone Impacts Assessment—An Approach to Assess and Manage Work Zone Safety and Mobility Impacts of Road Projects (http://www.ops.fhwa.dot.gov/wz/resources/final_rule/wzi_guide/index.htm) contains more information about work zone analysis, and provides an overview of analysis tools in Appendix B.
FHWA Traffic Analysis Toolbox: Work Zone Modeling and Simulation
Information about traffic analysis tools is also available through the FHWA Traffic Analysis Tools (TAT) Program. This program was initiated by FHWA to develop new, improved tools in support of traffic operations analysis and to facilitate the deployment and use of existing tools. The TAT provides guidance, recommendations, and examples on the selection and use of traffic analysis tools.
To aid transportation agencies with using work zone analysis tools, FHWA has added two new volumes to the TAT that deal specifically with work zone modeling and simulation:
Volume VIII: Work Zone Modeling and Simulation—A Guide for Decision-Makers. This document provides a high level perspective of the strategies, benefits and pitfalls of using work zone analysis tools. It is intended to provide guidance to decision-makers within agencies and jurisdictions who are considering the role of analytical tools in work zone planning and management. It is often unclear what kind of analytical approach may be of most value, particularly in light of complex data requirements and staff training. The decision to create an analytical capability to support decision-making can be a significant investment and deserves careful consideration. This guide is intended to help with this process.
Volume IX: Work Zone Modeling and Simulation—A Guide for Analysts. This guide targets practitioners and includes more detailed real world examples and application information to help guide the selection and application of a modeling approach. This volume is not a user guide on how to use specific modeling tools. The volume includes numerous case studies that provide examples of project applications. This includes specific examples of roadway construction projects that have used a transportation modeling tool to conduct an analysis as part of the overall decision-making process, and of strategic modeling approaches and how agencies set up a methodology to better identify when work zone modeling is needed and to what extent.
These guides are available online at http://www.ops.fhwa.dot.gov/wz/traffic_analysis/.
To help practitioners apply the concepts in the guides, FHWA developed a workshop:
Regional Work Zone Analysis Modeling Workshop. This 1-day workshop is based on the materials in Volumes VIII and IX of the TAT. A combination of lectures and hands-on exercises that incorporate examples/case studies/real world applications are used to help participants understand the constraints and opportunities in work zone analysis modeling, and guide them in how to select an appropriate approach and category of tool(s) to use for work zone analysis. For more information about this workshop, contact Chung Eng at Chung.Eng@dot.gov.
How Can Work Zone Analysis Tools Be Used?
The following case studies illustrate how work zone analysis tools can be used on a variety of projects to improve project planning, design, and construction efforts. More examples and information are available in Volumes VIII and IX of the Traffic Analysis Toolbox, as well as on the Work Zone and Traffic Analysis page (http://www.ops.fhwa.dot.gov/wz/traffic_analysis/) of the FHWA Work Zone Web Site.
Identification of Potential Delay[1]
Tennessee Department of Transportation (TDOT) staff identified a section of Interstate 40 (I-40) east of downtown Knoxville as a candidate for major rehabilitation, and in 2004, considered various strategies to perform the needed roadwork, keeping in mind construction costs, project duration, and potential impact to road users. In particular, TDOT staff considered the use of a full closure to complete complex work on freeway interchanges without the maintenance of through traffic on I-40. The advantages of this option over more traditional approaches include reduced project duration, improved worker safety, and potential cost savings over more traditional approaches.
Before deciding to implement the full closure approach, TDOT personnel analyzed several issues, including where to divert traffic. Interstate 640 Bypass (I-640) was the most reasonable alternative, but the agency staff studying the approach were unsure if it could handle the additional traffic. TDOT commissioned a traffic study to estimate and analyze traffic volumes on I-640 to determine the impacts from a full closure. The study used vehicle-matching technologies to identify through and local traffic volumes by collecting field data in the first half of 2004. The results of this study were used by analysts to better predict travel demands on I-640 during the construction period.

QuickZone is a traffic impact analysis tool that can be used to estimate work zone delays. For example, QuickZone allows road owners and contractors to compare the effects of doing highway work at night instead of during the day, or of diverting the traffic to different roads at various stages of construction. These effects can be estimated for periods as short as one hour or for the entire life of the construction project.
The study team used QuickZone to identify the likelihood of significant congestion under the proposed full closure option by doing a quick prediction based on current traffic volumes. When this analysis showed that congestion was likely to be significant, more refined traffic demand data and more detailed network geometry were applied in QuickZone. The outputs from QuickZone identified the likely delay impacts and locations where congestion would occur, which assisted local and State agency staff in managing traffic and preventing lengthy delays on I-640 and at the I-40/I-640 interchanges. TDOT personnel also used the study information to identify improvement projects on I-640 so it could upgrade the roadway to better handle detoured traffic before the start of the full closure.
Key Observations
- QuickZone can be utilized to predict likely delay impacts from a proposed full closure on a major interstate.
- Model predictions highlighted the potential for extensive delays and helped TDOT mobilize resources for demand management and public outreach prior to construction.
- A tiered modeling approach is a cost effective strategy for using QuickZone. First, less detailed data are used to scope potential delays. Then, if deemed necessary, enhanced travel demand and more detailed network models are employed.
Selecting the Most Economical Construction Scenario[2]
The Interstate 15 (I-15) Devore corridor in California has consistently high weekday commuter peaks and even higher volume (120,000 ADT) on weekends, when leisure travelers in the Los Angeles area often travel to and from Las Vegas and to resort locations along the Colorado River.
The California Department of Transportation (Caltrans) needed to rebuild a 2.8 mile stretch of damaged concrete truck lanes on I-15. The lanes were rebuilt in only two 210-hour (about 9 days) continuous closures of one roadbed at a time using counter-flow traffic and 24-hour operations. The same project would have taken 10 months using a series of nighttime lane closures.
CA4PRS (Construction Analysis for Pavement Rehabilitation Strategies) is a software tool that supports the integrated analysis of project alternatives for different pavement design, construction logistics, and traffic operations options. It was designed to help state highway agencies and paving contractors develop construction schedules that minimize traffic delay, extend the service life of pavement, and reduce agency costs.
Engineers on the project used a model called CA4PRS in conjunction with traffic simulation models to arrive at an optimal and economical rehabilitation closure scenario, construction schedule, and traffic management plan. The post-construction data validated the analysis and simulation estimates of construction productivity and traffic delay.
In the pre-construction analysis, the engineers sought the most economical reconstruction closure scenario that took into account the competing concerns of construction schedule, traffic impacts, and agency cost. Four construction closure scenarios—72-hour weekday, 55-hour weekend, one-roadbed continuous (24 hours per day, seven days per week), and 10-hour nighttime—were compared. The pre-construction analysis concluded that the two extended continuous closures were the most economical scenario. Compared to traditional 10-hour nighttime closures, the extended closure scenario had about 80 percent less total closure time, about 30 percent less road user cost due to traffic delay, and about 25 percent less agency cost for construction and traffic control.
The I-15 northbound roadbed was closed for reconstruction first, switching traffic to the southbound side through median crossovers at the ends of the work zone. The two directions of traffic shared the southbound lanes as "counterflow traffic" separated by a quick-change moveable barrier (QMB). The QMB was moved twice a day to provide additional travel lanes for peak directional traffic, thereby reducing delay. The same process was repeated for the reconstruction of the southbound lanes.
Implementing continuous closures rather than repeated nighttime closures in this project resulted in significant savings: $6 million in agency costs and $2 million in road user costs. In addition, as a result of using traveler information provided through an Automated Work Zone Information System (AWIS) and doing extensive public outreach, a 20 percent reduction in traffic demand through the construction work zone was achieved, thereby reducing the maximum peak-hour delay by 50 percent (45 minutes instead of the expected 90 minutes).
Using a Combination of Tools to Better Understand Work Zone Impacts[3]
The replacement of the Woodrow Wilson Bridge (WWB), along Interstate 95 (I-95) in the Metropolitan Washington, DC area, was an extremely large and complex construction project with the potential for major traffic impacts. The WWB carries upwards of 100,000 vehicles per day. The WWB project spanned a 7.5 mile-long corridor extending from the MD 210 interchange in Maryland to Telegraph Road in Virginia, crossing over the Potomac River. The project replaced the existing 6-lane bridge with a dual-span bridge that doubles the number of traffic lanes.
To keep traffic moving throughout the multi-year project, the construction work for the WWB project had to be completed in individual phases instead of one large, long-term work zone. To better understand the potential work zone impacts of the project, WWB project staff used a number of different modeling approaches ranging from the simplest Highway Capacity Manual (HCM) methodologies to microscopic simulation:
- Highway Capacity Software (HCS) was used to model the expected added travel time that would be generated from the work zone setup for each phase of the project. The outcome of this analysis can be used to determine Level of Service (LOS) of the facility.
- Critical Lane Volume Analysis (CLV) is a planning tool that was used on the Maryland side to analyze level of service at individual intersections. CLV is used to identify levels of congestion at signalized intersections and is useful because the results are easy to understand and to report to the general public. In the WWB project, expected hourly and 15 minute traffic volumes were generated using CLV.
- On the Virginia side, Synchro was used as a traffic signal optimization tool to help planners understand the work zone impacts on nearby intersections. Synchro’s outcomes include LOS, signal phasing improvements for alternate routes and detours during construction, and travel delay estimations.
- Virginia Department of Transportation (VDOT) staff also used QuickZone to provide an accurate assessment of traffic impacts and to relay those impacts to the public. QuickZone was chosen in part because it was very important to obtain accurate queue lengths and delay times due to construction and relate those numbers to the WWB traffic call center.
- For the more complex modeling, micro-scale simulation tools were used, including VISSIM and CORSIM. Both of these software packages allow users to simulate the movement of individual vehicles using car-following and lane changing theories. For VISSIM, planners set up a base network to run test simulations under different scenarios during construction, including the use of variable speed limits by VDOT to manage traffic approaching and at the work zone. Planners using CORSIM were able to determine maximum and average queue lengths and LOS, and to provide estimations of delays in work zones. Planners used CORSIM to assess the traffic impacts of alternate plans and to help select the most efficient plan.
Additional Resources
Types of Traffic Analysis Tools Web page
http://ops.fhwa.dot.gov/trafficanalysistools/type_tools.htm—Provides an overview of the different types of traffic analysis tools and guidance on developing and applying a modeling approach.
Work Zone Impacts Assessment: An Approach to Assess and Manage Work Zone Safety and Mobility Impacts of Road Projects Guide
http://www.ops.fhwa.dot.gov/wz/resources/final_rule/wzi_guide/index.htm—Provides guidance and examples on developing procedures to assess work zone impacts of road projects. Appendix B focuses on impacts analysis tools.
Work Zone Traffic Analysis Web page
http://www.ops.fhwa.dot.gov/wz/traffic_analysis/—Provides examples of agency work zone and traffic analysis as well as resources and tools.
Work Zone Traffic Management Web page
http://www.ops.fhwa.dot.gov/wz/traffic_mgmt/—Provides resources for implementing and monitoring traffic management strategies to manage work zone impacts.
July 9, 2008 National Transportation Operations Coalition (NTOC) Webinar on Work Zone Traffic Analysis Strategies:
http://www.ops.fhwa.dot.gov/wz/traffic_analysis/index.htm#tools—Covered work zone traffic analysis strategies, a process for integrating traffic analysis into work zone decision-making, and considerations for choosing a modeling approach and analysis tool(s). Case studies illustrated how some agencies and jurisdictions have used modeling to improve decision-making and improve work zone planning and operations.
References
California Department of Transportation, "'Rapid Rehab' Accelerated Urban Highway Reconstruction: I-15 Devore Project Experience," available from http://www.dot.ca.gov/hq/research/roadway/llprs/i-15_brochure.pdf, Accessed December, 2008.
Federal Highway Administration, Traffic Analysis Toolbox, Volume VIII: Work Zone Modeling and Simulation—A Guide for Decision-Makers, 2008.
Federal Highway Administration, Traffic Analysis Toolbox, Volume IX: Work Zone Modeling and Simulation—A Guide for Analysts, 2008.
"The Woodrow Wilson Bridge Project," available from http://www.wilsonbridge.com/index.htm, Accessed December, 2008.
- https://www.fhwa.dot.gov/publications/research/operations/05142/index.cfm
- http://www.dot.ca.gov/hq/research/roadway/llprs/i-15_brochure.pdf, Traffic Analysis Toolbox Volume IX
- Traffic Analysis Toolbox, Volume IX