Traffic Analysis Tools Volume IX: Work Zone Modeling and Simulation
A Guide for Analysts
Yosemite National Park: Yosemite Village Roadway Reconstruction
Yosemite National Park
Yosemite Village Roadway Reconstruction[13]
| Work Zone Characteristics | |
|---|---|
| Transportation Analysis: | |
| Approach | Sketch-Planning |
| Modeling Tools | QuickZone |
| Work Zones: | |
| Type | Type IV |
| Network Configuration | Pipe |
| Geographic Scale: | |
| Work Zone Size | Small |
| Analysis Area | Local |
Overview
Yosemite National Park in California is one of the most popular national park destinations in the nation, averaging more than 40,000 visitors through its entrance gates each day throughout the year. One of the primary entrance destinations for park visitors is Yosemite Village, the primary hub of activity within the park and home to the Valley Visitors Center, a wide variety of lodging and dining options, trail heads, and other visitor services.
The shape of Yosemite Valley Figure 40 makes access to Yosemite Village scenic for the park visitor but quite limiting for a traffic manager. Given the steep terrain around the valley, the only roadways into and out of Yosemite Village are Northside and Southside Drives running along the Merced River which flows through the center of the valley. Both facilities are two-lane, one-way facilities with stop-controlled intersections along their length at two bridge crossings.
These two key valley roadways are scheduled for a significant repaving and rehabilitation project scheduled to start in 2006 but subsequently delayed through funding and legal issues to this day (August 2008). The Federal Lands Highway Division (FLH) of the FHWA is responsible for the planning, design and construction phases of the project, working in conjunction with the National Park Service to minimize impact on park visitors and the environment while cost-effectively conducting the needed roadwork.
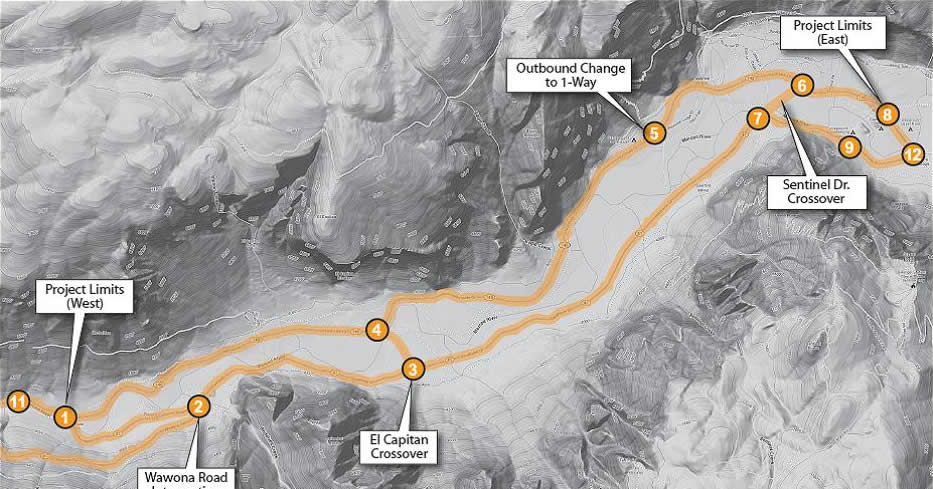
Figure 40 Yosemite Case Study Area
Concern regarding significant delays in the construction phase led FLH staff and NPS personnel to consider a range of phasing and staging alternatives. This concern is nontrivial given current (no roadwork) traffic conditions, where weekend congestion and delays are already a recurring event during peak travel months.
One alternative considered was an alternating full closure plan where work on Southside Drive could be conducted quickly while all inbound/outbound traffic would be directed onto Northside Drive (temporarily configured to support 2-way traffic). In a second phase, Northside Drive would be closed and all traffic diverted onto Southside Drive. The advantage of this alternative was that the project could be completed faster (one season) and more efficiently at a lower cost. The disadvantage of such an approach was that capacity reductions from the roadwork had to be in place around the clock, and could not be timed to avoid weekly and daily peaks in travel demand.
A second alternative was to pursue project planning under a more traditional approach where one lane of each facility would be repaved while the other remained open to traffic. This approach would allow for work to be suspended during peak demand hours but would be less efficient to conduct, lengthening the project duration to two seasons and incurring additional costs.
The original role of modeling the work zone impacts in the Yosemite project was to identify the likely travel delays expected under the two alternatives, allowing FLH and NPS staff to make an informed choice between the two, trading off road user delay against project cost. As the case study progressed, however, the traffic model became integral in the incremental refinement of a phasing and staging plan combining advantageous aspects of both alternatives.
Network Design and Modeling Approach
Network design for each alternative was different given the significant changes in geometry and traffic flow associated with the full closure components of the single-season alternative. The first alternative was coded using two networks (Figure 41). In the first phase, links representing Southside Drive are removed from the network and new links representing inbound operations on Northside Drive are added. The reverse is true for phase 2, where links representing Northside Drive are removed from the network and new links added to Southside Drive for outbound operations. These networks were run as separate files in traffic modeling software and results were combined external to the model. The second alternative was coded using a single network for all project phases.
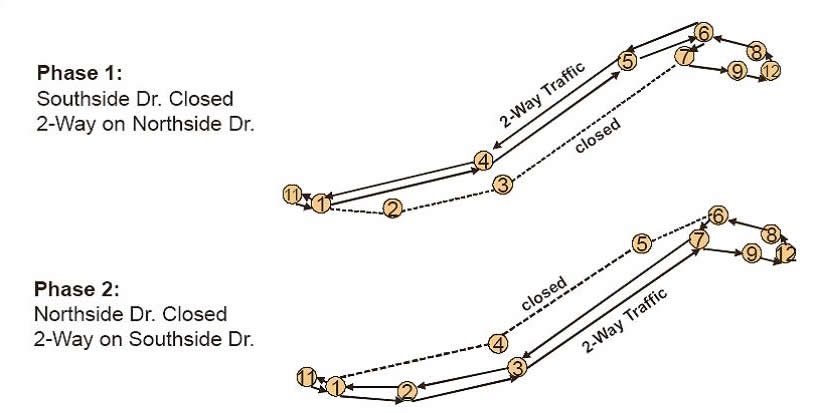
Figure 41 Yosemite Traffic Modeling Networks
A key element for the work zone analysis was obtaining accurate travel demand. Travel demand data were assembled from a number of sources and then refined through two short-term data collection activities. A first-cut distribution of hourly and daily travel demand factors were obtained from a 1998 traffic study. Monthly variations in travel demand were obtained from park entrance station data. Finally, two-short term collection activities (one two-week collection activity in June 2004 and one one-week collection activity in August 2004) were conducted to refine hourly and daily distributions and to establish a rate of travel demand growth from 1998-2004. Given that recurrent weekend congestion had worsened over the period, data were collected to identify when and by how much visitors had shifted departure or arrival times to avoid congested periods since 1998 (Figure 42). The supplementary data collection effort in 2004 was conducted using NuMetrics Hi-Star portable traffic counters, a commonly utilized technology within FLH.
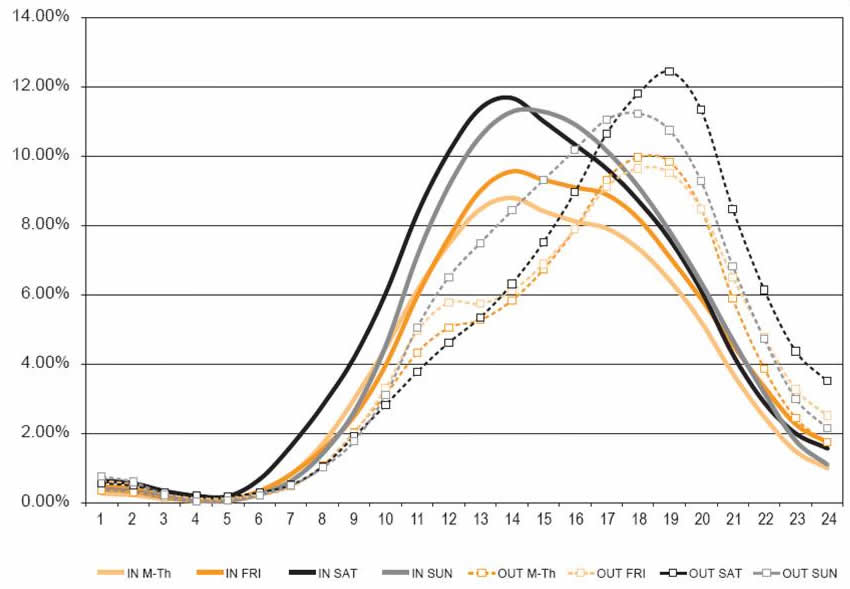
Figure 42 2004 Hourly Demand Pattern By Day of Week (from HI-STAR)
Traffic control operations modeled included lane closures, flagger operations, and full closures. Capacity of flagger operations were estimated external to the model and then input for affected links.
Application
The single-season alternative, although cost-saving and shorter in total duration, was predicted to generate long and unacceptable delays for park visitors, particularly on weekend afternoons during summer months. The two-season alternative, when no-work hours had been refined by additional work zone analysis, produced no more than 10 minutes of additional visitor delay. The differential in road user delay between the single-season and two-season alternative was too large to justify the reduced cost of the single-season alternative.
In discussing the results, however, it became clear that the full-closure elements of the single-season alternative could be viable if the delay during the peak months of July, August and September could be avoided. In response, FLH staff developed a hybrid third alternative plan that combined full closure activity during relatively low-demand months (March-June, October-November), and traditional one-lane paving operations in the peak summer months.
This third alternative plan had the advantage of recouping most of the cost savings of the single-season approach with significantly lower travel delays. Delay was not eliminated, however. In June, outbound delays were predicted to approach 30 minutes for outbound traffic on Sunday afternoons. Likewise, in October, inbound delays on weekends could approach 60 minutes.
[13] This case study was adapted from the report FLH-QuickZone Case Studies: The Application of FLH-QuickZone in Six Federal Lands Projects available from Federal Lands Highway Division.
Table of Contents | Previous | Next