Work Zone Road User Costs - Concepts and Applications
Chapter 5. Case Studies
5.1 Concrete Pavement Rehabilitation on Interstate-66, Fairfax County, Virginia
A concrete pavement rehabilitation project on Interstate 66 in Fairfax County was selected to illustrate the application of WZ RUC in the selection of a schedule-focused contracting method for a given project. This case study illustrates the computation of various monetary components of WZ RUC; the selection of an appropriate project delivery/contracting strategy; and the computation of lane rental charges. The actual information obtained for this project was modified with a number of assumptions for illustration purposes.
5.1.1 Project Description
Location
I-66 in Fairfax County is an urban interstate highway that primarily serves as a commuter route in the Washington metropolitan area. It is the main non-toll connector between Fairfax County and Washington, DC. Virginia Department of Transportation (VDOT) was owner of this project.
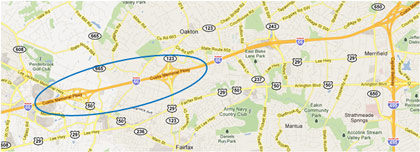
The project limits included the westbound traffic lanes on the mainline I-66 located between US 50 (Milepost 58) and SR 123 Chain Bridge Road (Milepost 60) interchanges and the ramp from I-66 leading to US 50W towards Chantilly. The general location of the project is shown in Figure 17.
Figure 17. Project location on I-66 in Fairfax County, Virginia. (Map Source: Google)
Traffic Data and Operations
The westbound direction of I-66 mainline has four lanes: high occupancy vehicle (HOV) lane (inside), passing lane (middle), travel lane (outside), and auxiliary shoulder. The auxiliary shoulders are used only during peak hours from 5:30 am to 11:00 am in the eastbound direction and from 2:00 pm to 8:00 pm in the westbound direction, while only three lanes are open during non-peak hours (see Figure 18). The estimated ADT in westbound direction was 90,000 vehicles (with 5 percent trucks) in 2009.
Figure 18. Number of lanes open during peak and non-peak hours on I-66 mainline.
The ramp leading from I-66 mainline to the US 50 W ramp has two lanes and a shoulder. The 3-mile-long ramp carried an estimated traffic volume of 28,000 vehicles per day. The speed limit on both mainline and the ramp under normal conditions is 55 mph.
The hourly traffic distributions for weekday and weekend traffic are shown in Table 56, Table 57, and Figure 19. The figure suggests that weekday traffic peaks at about 7:30 am and again between 3:00 and 7:00 pm. The traffic peaks between 11:00 am and 6:00 pm on weekends.
Figure 19. Hourly traffic distribution on I-66 westbound lanes.
Pre-construction Crash Data
The 3-year averages of pre-construction crash data for both mainline and ramp segments are shown in Table 58. No fatalities were reported. Three of the five events involved injuries. The severity of these injuries was not reported. The total value of property damage resulting from the accidents was $39,620.
Existing Project Condition
The PCC pavement in this roadway segment was built in the 1960s. The pavement was in a highly deteriorated condition and exhibited extensive cracking and deteriorated joints. Although the pavement in this segment had undergone maintenance repairs over the last several years, the condition was deteriorated enough to warrant an overall replacement.
Construction Technique
Pre-cast concrete technology was adopted as the preferred construction technique for this project. The feasibility of using two other alternatives, cast-in-place rigid pavement reconstruction options with a regular concrete mix and cast-in-place with a high early strength mix, were considered.
Contracting Strategy
For this project, VDOT adopted the “fixed price best value” contracting method. The bidders were allowed to compete on the extent of pavement replacement for a fixed bid price of $5 million. A repair plan outlining the required repairs as well as optional repair areas was provided. The bid advertisement specified the use of pre-cast pavement technology for repair, while the responsibility for the design of pre-cast systems was left to the contractor. The bid that proposed the greater square yards of pavement repair in optional areas, including all necessary work such as the required repairs, traffic control, pavement making, and mobilization, was awarded the contract.
Maintenance of Traffic Strategy
For the I-66 mainline, the construction was scheduled during nighttimes: two lanes were closed at 9:00 pm, a third lane was closed at 10:00 pm, and all lanes were opened to traffic by 5:00 am. At least one lane was kept open for traffic at all times. The slab installation was carried in two construction stages. In Stage 1, the two inner lanes (HOV and passing lanes) and the inside shoulder were closed for slab removal and installation. In Stage 2, the outside travel lane and the auxiliary shoulder were closed for slab removal and installation (see Figure 20). The posted speed limit in the work zone was 45 mph. For the I-66 ramp leading to US 50W, VDOT selected nighttime full closure for traffic maintenance. The traffic entering the US 50W ramp was diverted through designated detour routes. Figure 21 shows VDOT posted detours for motorists as marked on the plans and the agency website.
Travel Time Studies
The per-vehicle delays and queue lengths were measured during construction through the travel time studies. The floating car methodology was used in collecting travel time statistics. The maximum queue length, delay time, and associated timing are summarized in Table 59.
Figure 20. Construction staging on I-66 mainline.
Figure 21. VDOT designated detour for I-66 ramp closure. (Source: VDOT)
| Day | Time | Maximum Queue, miles | Maximum delay, minutes |
|---|---|---|---|
| 1 | 11:00 pm | 1.5 | 14.3 |
| 2 | 11:00 pm | 2.0 | 22.9 |
| 3 | 11:00 pm | 2.1 | 25.9 |
Construction Duration
The as-built construction duration for the I-66 mainline involved 44 nighttime closures with 3 lanes closed and 27 nighttime closures with 2 lanes closed. The ramp was fully closed at night for 30 days.
Work Hour/Lane Closure Restrictions
VDOT issued special provisions placing restrictions on lane closures and work hours. The key features of the limitations are as follows:
- The lane closure schedule shall follow the restrictions specified in Tables 60 and 61 for mainline and ramp.
- No lane closures between Friday at 5:00 am and Sunday at 9:00 pm.
- Complete I-66 mainline closures performed at night will be permitted from 12:00 am to 5:00 am only, for a maximum of 15 minutes.
- The ramp from I-66 westbound to US 50 westbound was allowed to be closed to through traffic for a maximum of 24 closures without substantiation of need by the contractor and written authorization by the Area Construction Engineer.
- The charges for failure to restore all lanes to traffic by the previously designated times would be assessed user fee charges at the rates reflected in Table 62 for every 15 minutes interval starting from the approved time.
5.1.2 Case Study Objectives
The objectives of this case study are:
- To demonstrate the calculation of WZ RUC.
- To demonstrate the derivation of unit cost data for use in WZ RUC calculation.
- To demonstrate the application of WZ RUC and work zone impacts in selecting an appropriate construction strategy.
- To demonstrate the application of WZ RUC and work zone impacts in selecting appropriate project delivery and schedule-focused contracting strategies.
- To demonstrate the application of WZ RUC in determining lane closure timings and lane closure user fees (otherwise called lane rental charges).
5.1.3 RUC Computation
The computation of WZ RUC involved a two step process: (1) the estimation of work zone impacts for a given MOT strategy and (2) the computation of unit cost data. The estimated impacts were then multiplied by the unit cost data to compute daily WZ RUCs.
RealCost was used to compute delay and vehicle operating costs for mainline lane closures. For ramps, the additional time and distance resulting from traffic detours were calculated using simple mathematical formulae. The as-built lane closure strategies and timings were used for both mainline and ramp closures. The following components were considered:
- Mainline I-66
- Work zone travel delay costs
- Work zone VOC
- Crash costs
- Ramps
- Detour travel delay costs
- Detour VOC
- Crash costs
VDOT used Highway User Benefit-Cost Analysis Program (HUB-CAP) to quantify WZ RUC and benefits for this project and evaluate the cost-effectiveness of alternatives including detours, night work, and various project delivery methods.
5.1.3.1 Computation of Unit Costs
This case study demonstrates the derivation of unit cost data using regional data in the computation of travel delay costs in lieu of unit cost data provided in HUB-CAP lookup tables. The wage statistics in the Washington metropolitan area, designated by the Office of Management and Budget (OMB) as the Washington-Baltimore-Northern Virginia, DC-MD-VA-WV Combined Statistical Area (CSA), were used. For VOC and crash-related injury costs, the national averages presented in Chapter 2 were used due to the absence of region-specific data.
The unit cost data requirements for the computation of WZ RUC components mentioned above are shown in Table 63.
Value of Travel Time for Passenger Cars
The monetary value of time for passenger cars is the weighted average of two components: travel time value of passenger cars on personal travel and travel time value of passenger cars on business travel. Per 2009 NHTS statistics, the passenger cars on personal and business travel were estimated to be 93.7 and 6.3 percent, respectively.
The computations of travel time values for passenger cars on both personal and business travel are presented as follows:
Hourly $ Value of Personal Travel Time
Median annual household income in 2010 inflation-adjusted dollars for the Washington-Arlington-Alexandria, DC-VA-MD-WV Metro Area was $84,523. (Source: American Fact Finder, U.S. Census Bureau, 2010 American Community Survey (Item Code B19013).) The steps presented in section 2.2.2.1 were followed.
Median annual household income of the area = $84,523
Hourly time value of a person on personal travel (assuming local travel) = 50% of $84,523÷2080 hrs
Hourly time value of a person on personal travel = $20.32/person-hr
Average vehicle occupancy for personal travel = 1.24 persons per vehicle (Assumed based on the value reported in “A Look Back at Rezoning Cases to Compare Projected and Actual Transportation Impacts” Fairfax County Technical Assistance Project, 2008.)
Hourly travel time value of a passenger car on personal travel = 1.24 * 20.32 = $25.19/vehicle-hr
Hourly $ Value of Business Travel Time
The sum of hourly wages and benefits for the Washington Metropolitan area were estimated using the CSA-specific ECEC statistics available on the BLS website. The steps presented in section 2.2.2.2 were followed.
Hourly employment cost for the quarter March 2010= $33.79 (Source)
Hourly time value of a person on business travel = $33.79/person-hr
Average vehicle occupancy = 1.24 persons per vehicle
Hourly travel time value of a passenger car on business travel = $33.79 * 1.24 = $41.90/vehicle-hr
Weighted Average of Travel Time Value
The weighted average of travel delay time values for passenger cars on both personal and business travel were computed using the ratios presented in 2009 NHTS statistics.
Travel delay value of a passenger car on personal travel = $25.19/vehicle-hr
Travel delay value of a passenger car on business travel = $41.90/vehicle-hr
Weighted average of hourly time value of passenger cars = 93.7% of $25.19 + 6.3% of $41.90 = $26.25/ hr
Travel delay value of a passenger car = $26.25/hr
Value of Truck Travel Time
Following the steps presented in section 2.2.2.3, the hourly compensation of truck drivers was used in computing the value of truck travel time.
Average compensation of single-unit truck drivers = $28.50/person-hr
Average vehicle occupancy of single-unit trucks = 1.025
Hourly time value of single-unit trucks = 1.025 * $28.50 = $29.21/hr
Average compensation of combination truck drivers = $27.95/person-hr
Average vehicle occupancy of combination trucks = 1.12
Hourly time value of combination trucks = 1.12 * $27.95 = $31.30/hr
Due to lack of data, the proportion of single-unit and combination trucks on I-66 was assumed to be typical of urban interstate highways.
Percent single unit trucks = 12.9% of total trucks (Based on the Long-term Pavement Performance (LTPP_ Truck Traffic Classification (TTC) national averages for urban interstate highways.)
Percent combination trucks = 87.1% of total trucks
Hourly $ value of truck travel time = 12.9% of $29.21 + 87.1% of $31.30 = $31.03/hr
Hourly $ Value of Vehicle Depreciation Cost
The values presented in the Step 1 of Example 2.5 (section 2.2.2.4) were used.
Hourly depreciation cost for passenger cars = $1.23/hr
Hourly depreciation cost for single-unit trucks = $3.09/hr
Hourly depreciation cost for combination trucks = $9.29/hr
Hourly $ Value of Freight Inventory Cost
The values presented in Step 7 of section 2.2.2.5 were used.
Hourly vehicle inventory cost for single-unit trucks = $0.18/hr
Hourly vehicle inventory cost for combination trucks = $0.31/hr
Total Delay Costs
Hourly costs for passenger cars = time value + depreciation cost = $26.25 + 1.23 =$27.48/hr
Hourly costs for single-unit trucks = time value + depreciation + freight inventory = $29.21 + 3.09 + 0.18 = $32.48/hr
Hourly costs for combination trucks = time value + depreciation + freight inventory = $31.30 + 9.29 + 0.31 = $40.90/hr
Hourly costs for all trucks = 12.9% of $32.48 + 87.1% of $40.90 = $39.81/hr
Composite Vehicle Operating Costs
Composite VOC (per mile cost) was used for diverted vehicles on detour routes only. For passenger cars, the AAA estimates presented in Table 16 were used. A median sedan car was assumed to represent all passenger cars on I-66. For trucks, the ATRI estimates presented in Table 17 were used.
VOC for passenger cars = $0.403/mile
VOC for trucks = $0.818/mile
Individual Vehicle Operating Costs
Individual VOC components for idling, speed change, and queue stopping were obtained from the RealCost cost tables presented in Table 12.
Crash Costs
Based on the accident information presented in Table 58, the crash costs are presented as follows:
Since the VDOT accident data contain the dollar value of property damage, no unit costs were computed. The sum of property damage values presented in Table 58 was used.
Total monetary value of property damage = $39,620
Number of injuries = 4 (all incidents involving two vehicles with crash geometry resembling rear end collisions).
Using the data provided in Appendix A, Table 2 of the FHWA report “Crash Cost Estimates by Maximum Police-Reported Injury Severity within Selected Crash Geometries,” 49 the mean human capital and comprehensive costs (in 2001 dollars) were obtained. For the given set of factors—crash geometry code No. 15, injured but severity unknown, speed limit > 50 mph—the mean human capital and comprehensive costs in 2001 dollars are $34,399 and $68,218, respectively. The crash costs were then adjusted to 2010 dollars using the approach illustrated in the Step 7 of Example 2.10 in section 2.4.3.
Adjustment factor for human capital costs = 1.2313
Adjustment factor for comprehensive costs = 1.3095
Adjusted comprehensive cost = ($34,399*1.2313) + ($68,218 -$34,399)*1.3095 =$86,641.47/injury
Cost per injury = $86,641.47
There were no fatalities reported, and therefore, the crash cost for a fatal event was not computed.
5.1.3.2 RUC for Mainline I-66 through Traffic (Delay and VOC only)
RealCost was used to estimate work zone traffic impacts and compute the delay and VOC components of WZ RUC for the mainline I-66 through traffic. The following inputs were used:
- One-way AADT = 90,000
- Percent single-unit trucks = 0.6%
- Percent combination trucks = 4.4%
- Diverted traffic = 0% (assumed)
- Normal speed limit= 55 mph
- Work zone speed limit = 45 mph
- Normal lane capacity = 2250 passenger cars/hr/lane
- Work zone lane capacity = 2100 passenger cars/hr/lane (obtained from VDOT’s HUB-CAP estimate)
Two different lane closure conditions were used:
- Two of four lanes closed from 9:00 pm to 5:00 am
- Three of four lanes closed from 10:00 pm to 5:00 am
Tables 64 and 65 present the estimated queue length, delay time, and associated delay and VOC components of WZ RUC for two- and three-lane closures, respectively. The estimated daily costs of the delay and VOC components for these conditions are $2,247 and $72,291, respectively.
The estimations presented in these tables indicate that the traffic impacts were severe when three lanes were closed, particularly between 11:00 pm and 12:00 am. The estimated maximum queue length and delay time with the three-lane closure was 2.2 miles and approximately 34 minutes during this time period. These values were similar to the travel time statistics presented in Table 59, thus validating the RealCost estimations.
Two of four lanes closed:
Number of work days = 27
Daily WZ RUC (delay and VOC only) = $2,247
Total WZ RUC (delay and VOC only) = 27 * $2,247 = $60,669
Three of four lanes closed:
Number of work days = 44
Daily WZ RUC (delay and VOC only) = $72,291
Total WZ RUC (delay and VOC only) = 44 * $72,291 = $3,180,804
Total WZ RUC (delay and VOC only) = $60,669 + $3,180,804 = $3,241,473
5.1.3.3 RUC for I-66 Ramp Closure and Detours (Delay and VOC only)
The I-66 ramp leading to US 50 was fully closed for traffic between 9:00 pm and 5:00 am for 30 days. The following inputs were used:
Number of work days = 30
Lane closure timing = 9:00 pm to 5:00 am
Number of vehicles diverted during closure = 5,460Normal travel distance = 3.1 miles (with no work zone in place and no detours)
Normal speed = 55 mphDetour travel distance = 5.3 miles (as a result of ramp closure)
Detour speed = 40 mphAdditional travel time per vehicle = (5.3/40) – (3.1/55) = 0.076 hour = 4.57 minutes
Total travel delay time for all diverted vehicles = 5,460 * 0.076 = 415.7 hours
Delay costs per day = 95%*415.7*$27.48 + 5%*415.7*$39.81 = $10,852.26+827.45 = $11,679.72Additional distance traveled per vehicle = 5.3 – 3.1= 2.2 miles
VOC for passenger cars = $0.403/mile
VOC for trucks = $0.818/mile
VOC per day = 95%*5460*$0.403 + 5%*5460*$0.818 =$2,313.68Total delay and VOC for all working days = ($11,679.72 + $2,313.68) * 30 days = $13,993.4 * 30 days = $419,802
On this project (as would be standard procedure in most real-world scenarios), the pavement repairs on the ramp were undertaken concurrently with repairs on the mainline. The ramps were fully closed for traffic when the lane closures on the mainline were in effect. Therefore, while analyzing the traffic impacts of mainline lane closures, the demand-capacity analysis should duly account for the diverted vehicles in computing the mainline hourly traffic volume. However, as no information on the exact dates of ramp closures was available, the number of diverted vehicles was not deducted from the mainline hourly traffic volume. Therefore, it was assumed for the sake of simplicity that the mainline closures and ramp closures were not in effect concurrently, and they were considered separately.
51.3.4 Crash Costs
Crash costs were determined based on the crash rates reported in Table 58 for the ramp and the mainline. The key steps involved in computing the crash costs are as follows:
- Compute the pre-construction crash rate
- Compute the work zone crash rate using work zone crash modification factor
- Estimate the measure of work zone exposure
- Compute unit cost for crashes
- Compute work zone crash costs for the project
The detailed discussion of these steps is presented in section 2.4.
Pre-construction Crash Rate
The pre-construction crash statistics reported in Table 58 were converted to crash rates using the following equation:
![]()
Length of roadway section (L) = 4 mile
Exposure period (T) = 3 years
Average AADT per year = 90,000 vehicles/dayNumber of fatalities = 0
Pre-construction crash rate for fatalities = 0Number of injuries = 4
Pre-construction crash rate for injuries = (4*10^6)/(3*4*90,000*365) = 0.01015/MVMTSince the property damage values were available for each incident, those values were directly used in computing the pre-construction crash rates.
Value of Property Damage (APDO) = $39,620
Pre-construction crash rate for PDO (Pre-CRPDO)= (39,620*10^6)/(3*4*90,000*365) = $100.50/MVMT
Work Zone Crash Rate
No agency-specific work zone crash rates or CMFs were available for this project. To account for crash-related risk escalation in work zones, a CMF value of 1.61 was assumed for night-time temporary lane closures in this project based on the work done by Ullman et al. 42 See section 2.4.1 for more discussion on selecting a work zone crash rate.
Crash modification factor for work zone = 1.61
Work zone crash rate for fatalities = 0
Work zone crash rate for injuries (WZ-CRINJ)= 0.01015 * 1.61 = 0.01634/MVMT
Work zone crash rate for PDO (WZ-CRPDO)= $100.50 * 1.61 = $161.81/MVMT
Work Zone Exposure
The VMT during the work zone period is computed for both ramp and mainline traffic. Note that the exposure periods and work zone length were different for both ramp and mainline traffic. The mainline traffic is exposed to I-66 work zone related crash risks for the entire construction duration of 71 days, while the ramp traffic is exposed to the I-66 work zone related crash risks only for the time period when the ramps are opened for traffic during construction (i.e., 71-30 = 41 days). When the full ramp closure was in effect, the ramp traffic was exposed to the crash risks of detour routes. Since no crash data are available for detour routes, it was not considered in this case study.
Mainline Traffic:
Exposure period (T*365) = 71 days
AADT (mainline) = 90,000
Work zone length (mainline) = 1 mile
Ramp Traffic:
Exposure period = 41 days
ADT(ramp) = 28, 000 vehicles/day
Work zone length (ramp) = 4 miles
Million vehicle miles traveled = (71*90,000*1/10^6)+ (41*28,000*4/10^6) = 10.982 MVMT
Unit Cost of Crashes
Refer to section 5.1.3.1 for computation of unit costs of crashes.
Cost per injury = $86,641.47
Note that the monetary values of property damage were directly used in computing the pre-construction crash rate for PDO, and hence, unit costs were not required.
Crash Costs
The crash costs were computed by multiplying work zone crash rate with the measure of exposure (MVMT) and the corresponding mean comprehensive costs.
Work zone crash rate for fatalities = 0
WZ costs for fatalities = 0Work zone crash rate for injuries=0.01634/MVMT
WZ exposure = 10.982 MVMT
Cost per injury = $86,641.47
WZ costs for injuries = 0.01634*10.982*$86,641.47 = $15,547.46Work zone crash rate for PDO = $161.83/MVMT
WZ exposure = 10.982 MVMT
WZ costs for PDO= $161.81*10.982= $1,777.00
Total crash costs = $15,547.46 + $1,777.00 = $17,324.46
Daily crash costs = $17,324.46/71 = $244.00
5.1.3.5 Total WZ RUC
Total WZ RUC for the entire project is the sum of delay costs and VOC for mainline and ramp traffic and crash costs.
Total WZ RUC = total delay costs and VOC for mainline + total delay costs and VOC for ramp + crash costs
= $3,241,473 + 419,802 + 17,324.46 = $3,678,599.46
Daily WZ RUC for two lanes closed (mainline) = $2,247 + 244.00 = $2,491.00
Daily WZ RUC for three lanes closed (mainline) = $72,291 + 244.00 = $72,535.00
Daily WZ RUC for detour traffic = $13,993.40 + 244.00 = $14,237.40
5.1.4 Selection of Construction Technique
VDOT’s selection of pre-cast pavement technology as the preferred technique over other feasible alternatives appeared to have taken the following factors into account:
- Anticipated work zone impacts on mobility and safety:
- This segment of I-66 primarily serves as a commuter route carrying high volumes of traffic in both directions on both weekdays and weekends. Any daytime or continuous lane closures would have resulted in severe disruption of work zone traffic.
- In such situations, the use of pre-cast pavement technology typically allows all construction activities to be accomplished during nighttime hours, including traffic control set-up and removal, with no significant disruption to traffic. This was evident as the production rates achieved during construction ranged between 8 to 12 panels for the single lane width installation in a 6-hour work window.
- The use of cast-in-place concrete with high early strength concrete mix may result in similar productivity rates and lane closure requirements; however, the placement of conventional concrete mix requires several days of continuous lane closure to allow concrete curing, resulting in severe disruptions to work zone traffic.
- Cost-effectiveness:
- The use of conventional concrete mix is cheaper and typically provides a 30-year service life with minimal intervention needed for pavement maintenance but would require longer construction time (or higher road user costs).
- On the other hand, the use of high early strength concrete typically carries a cost premium and can be cost-prohibitive for large-scale construction. Despite the advantage of shorter construction time, the cast-in-place pavement with high early strength mix may exhibit material durability problems leading to shorter service life and may warrant frequent intervention for pavement maintenance and rehabilitation (M&R). Over the pavement’s life cycle, frequent M&R interventions typically offset the WZ RUC savings gained from shorter construction time.
- Thus, the use of pre-cast pavement technology seemed to provide a balance with lower life cycle costs (including road user costs), long-term pavement performance, and shorter construction time requirements.
5.1.5 Selection of Contracting Strategy
As mentioned earlier, VDOT adopted the “fixed price best value” contracting method for this project. The fixed price best value approach is being widely used under the SEP-14 program. The basic element of this method (i.e., bid that provides maximum value for a fixed price) is commonly used as a bid award basis in design-build contracting.
The bidders were allowed to compete on the extent, in terms of square yard size, of pavement repair for a fixed bid price of $5 million. This alternative contracting approach was used for this project to maximize the square yardage of pavement repair. VDOT adopted a lane rental strategy for this project, given the fact that the I-66 mainline is an urban interstate carrying a high volume of commuter traffic each day.
Step 1. Identifying the need for project acceleration.
This case study critically analyzes the need for a schedule-focused contracting strategy for this project and provides suggestions for selecting a particular contracting strategy to achieve schedule-related objectives. The approach presented in section 4.3 was used herein to evaluate the need for such strategies for this project. The questions presented in Table 66 were answered based on the available information. The evaluation results indicate that the answers to several of these questions were YES, thus indicating the need for a scheduled-focused contracting strategy for this project.
Step 2. Selecting a project delivery method.
Upon establishing the need for schedule acceleration, an appropriate project delivery method was selected using the guidelines presented in Table 51 (see section 4.3.2). An evaluation was performed to identify the suggested project delivery method, and the discussion is presented as follows:
- Project size, scope and complexity: Small-Medium — The project size was $5 million. The scope primarily involved pavement repairs and some roadway realignment of ramps for pre-cast pavement slab installation.
- Is project routine or innovative?: Innovative — The use of pre-cast pavement technology was an innovative venture for VDOT.
- Certainty over design scope: Yes — VDOT was certain over the design scope. The agency specified the use of pre-cast pavement technology in the bid advertisement. It also outlined the repair areas that were required under the contract and the optional areas.
- In-house design: Yes — VDOT specified the design for pre-cast slabs on the plans. VDOT also hired a design consultant for this project.
- Early cost certainty: Yes — The project cost was fixed at $5 million. The bid advertisement also specified the required repair areas.
- Certainty over constructability: Yes — VDOT specified the use of pre-cast pavement technology in the bid advertisement. It also hired a design consultant for this project.
The suggested strategy, in accordance with the recommendations presented in Table 51, was to adopt design-bid-build and, in addition, to hire consultants to seek design/constructability advice.
Step 3. Selecting a schedule-focused contracting method.
Following the project delivery method, another evaluation was performed to identify an appropriate schedule-focused contracting method based on the selection factors presented in Table 52. The discussion is presented as follows:
- Is the project required to complete before the expected normal duration?: YES – Since this roadway carries heavy commuter traffic, VDOT was interested in early completion.
- Is the project time-sensitive?: YES – This project was not time-sensitive.
- Project duration: Long— the expected project duration was 2-3 months.
- Intermediate or Multiple Phases: NO.
- Detours are long, impractical, or unavailable: YES for mainline, NO for ramp.
- Urban commuter traffic: YES
- Owner’s confidence on estimated duration: Low - This project involved the adoption of a new, innovative technology. VDOT has no or little prior experience with the installation of the pre-cast pavement technology, and hence the owner’s confidence was considered low.
Based on the discussion above, the suggested strategy, in accordance with the recommendations presented in Table 52 is A+B with I/D, lane rental, and accelerated construction. VDOT adopted only lane rental and accelerated construction techniques for this project; the A+B bidding was not used.
5.1.6 Computing Lane Rental Fee
This section illustrates the computation of lane rental fee for a given closure period using WZ RUC as the basis. RealCost was used in estimating the traffic impacts and mobility-related WZ RUC components for various lane closure scenarios. Tables 67 and 68 present the summary of the estimated WZ RUC and mobility impacts for both two-lane and three-lane closures at various lane closure timings. The daily WZ RUC values presented in these tables includes both mobility costs and crash costs. The net difference values indicate the difference in the daily WZ RUC estimates between the actual and the allowable closure period. In this project, the VDOT defined the allowable closure as the period between 9 pm and 5 am for two-lane closures, and between 10 pm and 5 am for three-lane closures.
As indicated in the Tables 67 and 68, closing a lane earlier than the scheduled time or failing to restore lanes per schedule results in increased WZ RUC. For the two-lane closure, the effect apparently is not significant if the lane closure is in effect as early as 8:00 pm or as late as 8:00 am the next day. Any closure outside this period is expected to cause longer delays and queue lengths with time, and accordingly, the estimated WZ RUC increases exponentially until the lanes are restored to traffic. For the three-lane closure, there is no buffer time for earlier closure, and the lane opening can only be delayed by an hour. As expected, the adverse impact of early closure or late restoration is more significant when three lanes are closed to traffic.
Table 69 presents a comparison of the VDOT and RealCost-based lane rental fees. The lane rental fee for a given closure period is calculated as the difference in the WZ RUC estimates between the actual and the allowable closure periods, and adjusted using a discount factor. Negative differences indicate that the adverse impacts for a given lane closure period are not worse than those allowed in the contract (i.e. impacts of the allowable closure period), and hence, no fees apply. The WZ RUC estimates presented in Tables 67 and 68 were used. A discount factor of 1.0 was used in developing RealCost-based lane rental fees.
Note that a one-to-one comparison between the VDOT and RealCost-based fees cannot be made for the comparison presented herein because of the differences in assumptions used in VDOT calculations such as the unit costs and the use of discount factors.
| Three of Four Lanes Closed | ||
|---|---|---|
| Closure Period | VDOT | RealCost |
| 10:00 PM to 5:00 AM | $0 | $0 |
| 10:00 PM to 6:00 AM | $9,000 | $220 |
| 10:00 PM to 7:00 AM | $28,000 | $17,537 |
| 10:00 PM to 8:00 AM | $48,000 | $97,405 |
| 10:00 PM to 9:00 AM | $68,000 | $278,522 |
Table 70 presents a comparison of lane rental fees at different discount factors for three lane closures only.
5.2 Improvements to the 24th Street –I-29/80 Interchange in Council Bluffs, Iowa
This case study illustrates the application of WZ RUC in the benefit-cost analysis for a project to determine whether using an accelerated construction technique would be economically justifiable. A bridge replacement project at the interchange of 24th street and Interstate 29/80 in Council Bluffs, Iowa was selected for this case study.
The bridge replacement on the 24th Street and I-29/80 interchange was completed and opened to traffic in 2008. The post-construction information of this project was obtained for this case study; however, for the sake of illustration, it is assumed that the key pieces of during-construction information, such as the agency costs and work zone delay time, were available before construction for decision making. Note that the decision to use the accelerated construction technique is made in the pre-construction phase of a project.
5.2.1 Project Description
Background and Location
The Iowa DOT, Nebraska Department of Roads, and FHWA, in coordination with the city of Council Bluffs and the Metropolitan Area Planning Agency, proposed improvements to the Council Bluffs Interstate System around Council Bluffs, Iowa. The proposed improvements were intended to upgrade mobility through the interstate corridors and modernize them to accommodate future traffic needs.
As a part of the CBIS improvement plan, the Iowa DOT undertook a construction project to replace the existing four–span concrete bridge serving 24th Street over I-80 with a wider and longer two–span steel girder bridge. Figure 22 shows the general project location. The existing four–span pretensioned, prestressed concrete beam bridge was replaced with a two–span steel welded girder bridge. The roadway improvements were completed on 24th Street south of the bridge consisting of a five–lane roadway with a raised median.
Traffic Volume
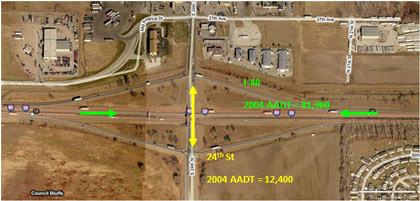
24th street carried an estimated AADT of 12,400 vehicles in 2004 with 14 percent trucks and is expected to carry 27,700 vehicles in 2030. For I–29/80, the 2004 AADT was 81,900 vehicles per day and the estimated 2030 AADT is 124,400 vehicles per day with 11 percent trucks (see Figure 23). The interchange serves major businesses, such as a large outdoor retailer, a convention and event center, and several casinos, hotels, and semi truck service centers.
Figure 22 . General project location of 24th Street Reconstruction Project. (Map Source: Bing)
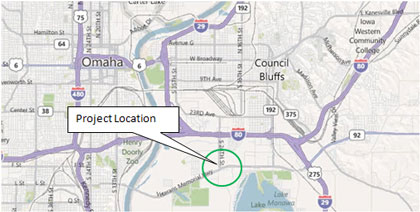
Figure 23. Traffic volume at the 24th Street Interchange.
Travel Time Estimates
During construction, none of the exit ramps of 24th Street was expected to create queue back onto the I-29/80 freeway mainline lanes. Travel speeds were estimated to be 60 mph on I–29/80. Travel times along the 1.5–mile length of 24th Street were estimated to be 5.8 and 6.5 minutes in the northbound and southbound directions, respectively. For eastbound I–29/80 traffic exiting at 24th Street and then turning left, travel times to the northern terminus of 24th Street were estimated to be 4.0 minutes over the 0.9–mile distance. For westbound I–29/80 traffic exiting and then turning left, the travel time for the 1.4–mile journey to the southern terminus of 24th Street were estimated to be 4.5 minutes. Table 71 presents per–vehicle travel time and delay estimates. For simplicity, a delay time value of 2.6 minutes per vehicle was deemed reasonable for use in delay cost calculations for all movement types within the interchange.
Pre - Construction Crash Data
According to the Iowa DOT 2001-2005 crash statistics, the project area has experienced an average 0.215 crashes/MVMT. The crash rates for personal injury (injuries and fatalities) and property damage were 0.069 crashes/MVMT and 0.146 crashes/MVMT, respectively.
Construction Technique and Project Duration
The Iowa DOT considered the use of full-depth pre-cast concrete panels for bridge decks. The pre-cast panels would be cast offsite in a controlled environment, steam cured, and made with an innovative self–consolidating concrete to improve consolidation around the complicated arrangement of reinforcing and post–tension ducts. The panels would be prestressed transversely during casting and post–tensioned longitudinally after placement.
Pre-cast concrete technology was considered in place of conventional cast–in–place construction techniques primarily to reduce the project delivery time and open all lanes on the new bridge within one construction season (213 days). Standard phased construction with conventional cast–in–place construction techniques would have resulted in two or three open lanes, but would have taken more than two construction seasons for completion (426 calendar days). The use of pre-cast deck panels was expected to shorten the construction time to only 6 months (175 days).
Full closure of the bridge was expected to take less time but would have been unacceptable to the surrounding businesses that rely heavily on the interchange. The selection of pre-cast deck panels over cast-in-place construction was expected to save over 251 calendar days (i.e., 426-175 days) in construction time.
5.2.2 Case Study Objectives
The primary objective of this case study is to demonstrate the application of WZ RUC in benefit cost analysis to evaluate whether the use of pre-cast deck panels to minimize the work zone impacts would be an economically justifiable option for this project. The analysis entails an objective comparison of the cost premium associated with the use of pre-cast deck panels and the benefits through savings in WZ RUC and agency construction engineering costs. The conventional construction option is designated as the baseline option, while the pre-cast option is designated as the proposed option.
5.2.3 Construction Costs
The Iowa DOT provided the construction cost estimates for both baseline and pre-cast options. The construction costs included the design and engineering costs, bridge replacement costs, cost of roadway improvements, traffic control and miscellaneous costs. Table 72 presents the differences in construction costs between the baseline and the pre-cast options. The following assumptions were used in determining the construction costs:
- The Iowa DOT used 6 and 8 percent of the total project costs for design and engineering for the baseline and pre-cast options, respectively.
- Since the agency was expected to use the same traffic management plan regardless of the use of pre-cast deck panels, the costs for traffic control and roadway improvements were assumed to be the same for both options.
- The agency assumed that the typical construction inspection costs would be about 1 percent of the bridge construction costs. The construction inspection costs for the pre-cast option were estimated to be 10 percent higher than the baseline option.
Table 72 indicates that the use of pre-cast concrete panels would incur an additional cost of $1,377,398 or 12.4 percent for the agency when compared to the cast in-place option.
5.2.4 Work Zone Road User Costs
The WZ RUC considered in this case study included only travel delay and crash costs. The cost differentials between the proposed and baseline option were computed for each component.
Travel Delay Costs
Since the Iowa DOT would use the same traffic management plan for both proposed and baseline option, the delay time statistics reported in Table 71 were used in computing delay costs. The unit cost data were provided by the Iowa DOT. The Iowa DOT contracting office estimates the cost to the public at $8 an hour per private vehicle and $24 an hour per single and multiple–unit commercial truck in 2008.
The 2008 AADT of the 24th Street intersection was interpolated using the 2004 and 2030 AADT values.
AADT in 2004 = 12,400 vehicles/day
AADT in 2030 = 27,700 vehicles/day
AADT in 2008 = 14,000 vehicles/day (interpolated)
Percent trucks = 14 %
The delay cost computations are presented as follows:
Average delay time per vehicle = 2.6 minutes (from Table 71)
Delay time for passenger cars per day = number of passenger cars * delay time/vehicle = 14,000 * 0.86 * 2.6 min/60 = 521.7 vehicle-hours/dayDelay costs per day for passenger cars = 521.7 * $ 8.00 = $4,173.87
Delay time for trucks per day = number of trucks * delay time/vehicle = 14,000 * 0.14 * 2.6 min/60 = 84.9 vehicle-hours/dayDelay costs per day for trucks = 84.9 * $ 24.00 = $2038.40
Delay costs per day for all vehicles = $4,173.87 + 2038.40 = $6,212.27/day
The selection of accelerated construction techniques has saved 251 days of construction time.
Total days saved = 251
Total savings in delay costs = 251 * $6,212.27/day = $1,559,280
Therefore, it is estimated that an amount of $1,559,280 would be saved in delay costs as a direct result of accelerating the construction to only a single season.
5.2.4.2 Crash Costs
The approach presented in section 2.4 was used in computing the crash costs. The key steps included:
- Compute the pre-construction crash rate.
- Compute the work zone crash rate.
- Estimate the measure of work zone exposure for both proposed and baseline options.
- Compute unit cost for crashes.
- Compute work zone crash costs for both options.
Pre-construction Crash Rate
The crash rates for personal injury (injuries and fatalities) and property damage were 0.069 and 0.146 crashes/MVMT, respectively.
Work Zone Crash Rate
No agency-specific work zone crash rates or CMFs were available for this project. To account for crash-related risk escalation in work zones, a CMF value of 1.63 was assumed for temporary lane closures in this project based on the work done by Ullman et al. 42 See section 2.4.1 for more discussion on selecting a work zone crash rate.
Crash modification factor for work zone = 1.63
Crash rate for personal injury =0.069 * 1.63 = 0.112 crashes /MVMT
Crash rate for crash = 0.146 * 1.63 = 0.238 crashes/MVMT
Work Zone Exposure
The VMT during work zone period is computed for both options. The affected area includes both 24th Street and I-29/80. Table 73 shows that the total volume of traffic exposed to crash risk was much lower for the pre-cast option than the baseline option.
Unit Cost of Crashes
The unit costs (in 2001 dollars) of personal injury and non-injury crashes were obtained from FHWA cost estimates.49 The crash geometry of an accident is unknown, and therefore, Level 5 estimates were used. The mean comprehensive costs per crash for a rural highway with a posted traffic speed greater than or equal to 50 mph and an arterial highway with a posted traffic speed less than 45 mph were used for I-29/80 and 24th Street, respectively. Table 74 summarizes the mean comprehensive costs of personal injury and non-injury crashes in 2009 dollars for both I-29/80 (speed>50 mph) and 24th Street (speed <45 mph).
Work Zone Crash Costs
The crash costs were computed by multiplying work zone crash rate with the measure of exposure (MVMT) and the corresponding mean comprehensive costs. Tables 75 and 76 present the crash cost computations for the baseline and pre-cast options, respectively. The selection of pre-cast option would result in $517,829 savings of crash costs.
5.2.4.3 Savings in WZ RUC
The total savings in WZ RUC is the sum of savings in delay and crash costs. The selection of pre-cast option would result in WZ RUC savings of $2,077,108.
Total savings in WZ RUC = savings in delay costs + savings in crash costs = $1,559,280 + 517,828 = $2,077,108
5.2.5 Benefit-Cost Analysis
The expected savings in WZ RUC that will be realized through the use of pre-cast panels were compared with its additional construction costs.
Increase in construction costs (D cost) = $1,377,398 (from section 5.2.3)
Savings in WZRUC (D benefit) = $2,077,108 (from section 0)
Cost difference (D benefit -D cost) = $2,077,108 - 1,377,398 = $699,710
Incremental benefit-cost ratio is the ratio between the savings in WZ RUC (D benefit) and the increase in construction costs (D cost). An incremental benefit-cost ratio greater than 1.0 would indicate that the benefit of using pre-cast deck panels in this project would outweigh its costs.
Incremental benefit-cost ratio = D benefit /D cost = $2,077,108/ 1,377,398 = 1.51 > 1.0
Percent benefit of total cost is the ratio of difference between the WZ RUC savings and the net cost increase (D benefit -D cost) relative to the total cost of the baseline option. Any positive difference between the WZ RUC savings and the construction cost premium would indicate that the benefit of using pre-cast deck panels in this project would outweigh its costs.
Percent benefit of total cost = (Δ benefit - Δ cost) / cost (baseline option = $699,710/11,128,864 = 6.3 percent
These computations clearly show that the benefit of using pre-cast concrete deck panels in this project outweighs its cost premium. Using pre-cast concrete deck panels would save an estimated $699,710 in this project. In other words, selecting the pre-cast panel option for this project would have a 6.3 percent cost benefit over traditional cast in-place methods.
5.3 Reconstruction of Eastern Avenue Bridge over Kenilworth Avenue in Washington, DC
The reconstruction of Eastern Avenue Bridge over Kenilworth Avenue was selected for this case study to demonstrate the application of the Kepner-Tregoe decision analysis method in MOT alternative analysis. The actual information obtained for this project was modified with a number of assumptions for illustration purposes.
5.3.1 Project Description
Project Location and Background
This project is located along Eastern Avenue in the northeastern corner of Washington, DC, at the border with Prince George’s County, MD. The bridge crosses over Kenilworth Avenue, which is the continuation of the Baltimore Washington Parkway/I-295 through Washington, DC.
Kenilworth Avenue is a six-lane principal urban expressway that serves commuters between Washington, DC, and Prince George’s County, Maryland. It also serves as a homeland security evacuation route for DC wards 7 and 8. US 50 (John Hanson Highway/New York Avenue) just north of the project site feeds a large portion of traffic to this segment of DC 295. Figure 24 shows the general location of the project.
Figure 24. Location of Eastern Avenue project. (Map Source: Bing)
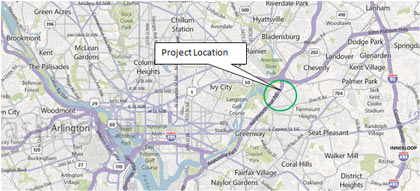
Figure 25 presents an aerial view of the project location and the conditions before reconstruction. The profile of Kenilworth Avenue is depressed to cross under Eastern Avenue at their intersection. Parallel to Kenilworth Avenue and on either side are two one-way service roads more than 24 ft wide that provide access to local homes and businesses.
The Eastern Avenue Bridge before reconstruction was a single-span bridge crossing all six lanes of Kenilworth Avenue. The intersection is signalized on top for turns between Eastern Avenue and Kenilworth Avenue service roads. Ramps between mainline Kenilworth Avenue and its parallel service roads provide access between Kenilworth Avenue and Eastern Avenue. Kenilworth Aquatic Gardens, administered by the National Park Service, are located northwest of the intersection. The bridge serves as a pedestrian crossing, truck turnaround, and link between portions of northeast DC.
Figure 25. Preconstruction aerial photograph of Eastern Avenue bridge.
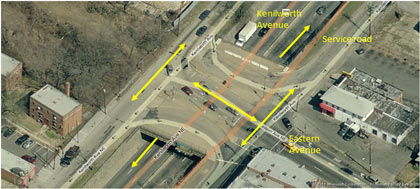
The existing bridge allows for a minimum vertical clearance of 14 ft along Kenilworth Avenue. Due to its low vertical clearance, it has been struck several times. As a result, the bridge structure was damaged and deteriorating. The Washington DC DOT reconstructed the bridge to increase the minimum vertical clearance to 16 ft, the maximum extent practicable, and to increase safety at the crossing for both pedestrians and vehicular traffic.
Pre-construction Crash Data
Statistics collected between 2001 and 2003 indicate a crash rate of 156 crashes/MVMT on the segment of Kenilworth Avenue south of Eastern Avenue. For the intersection of Eastern Avenue and the service roads, the crash data indicate there were a total of 70 accidents in the 3-year study period between 2003 and 2005. The majority of accidents at the intersection involved rear-end type hits, sideswipes, left turn accidents, broadsides, and fixed object accidents. Almost 50 percent of the accidents occurred between the hours of 6:30 pm and 7:30 am, indicating the possibility of lighting and visibility issues.
Traffic Volume
Kenilworth Avenue carries an ADT of approximately 150,000 vehicles with 4.9 percent trucks on the northbound lanes and 6.3 percent trucks on the southbound lanes. Figure 26 presents the typical hourly demand in both the northbound and southbound directions. The posted speed limits in the project area are 45 mph on mainline Kenilworth Avenue, 30 mph on the service roads, and 25 mph on Eastern Avenue.
Eastern Avenue is a minor arterial with 37,000 ADT and 7 percent commercial vehicles that runs in a northwest-to-southeast direction beginning at Kenilworth Avenue and continues southeast along the boundary between Washington, DC, and Prince George’s County, MD.
Figure 26. Hourly traffic volumes on Kenilworth Avenue.
Construction Strategies
Based on the feasibility analysis of several design and construction alternatives, the following strategies were selected:
- Reconstruct the bridge pier using prefabricated pier units on a cast-in-place foundation.
- Replace the existing single-span superstructure with a two-span bridge using prefabricated units.
Note: This case study focuses only on the MOT alternative analysis for the bridge pier construction.
Nearby Projects
Several nearby highway construction projects were undertaken during the same period:
- Reconstruction of MD 201 bridge over Amtrak railroad lines.
- Reconstruction of Kenilworth Avenue bridges over Nannie Helen Burroughs Avenue.
- Installation of utility lines along Nannie Helen Burroughs Avenue.
- Signalization improvements the intersection of Minnesota Avenue and Nannie Helen Burroughs Avenue.
Project Coordination
The DOT undertook project coordination efforts to manage the work zone impacts resulting from adjacent projects. Traffic control plans were refined to improve the traffic along Nannie Helen Burroughs Avenue, which serves as one of the detour routes for the Eastern Avenue project. In addition, the agency coordinated with Maryland SHA, Virginia DOT, and the National Park Service to manage any traffic spillback on adjacent routes and implement public information strategies such as overhead message signs.
MOT Strategies
A formal traffic impact assessment and MOT alternative analysis was conducted by project consultant Greenhorne & O’Mara, Inc. (Greenhorne & O’Mara, Inc. Eastern Avenue Over Kenilworth Avenue, N.E. Work Zone Transportation Management Plan, Washington, D.C. Prepared for District Department of Transportation Infrastructure Project Management Administration/Team 4. May 2009.) Two MOT alternative schemes were considered for the mainline Kenilworth Avenue through traffic:
- MOT Option 1 – close one of three lanes in each direction on mainline Kenilworth Avenue.
- MOT Option 2 – close one of three lanes in each direction on mainline Kenilworth Avenue and supplement with two-lane service roads in each direction.
Detour routes were devised to facilitate all left turns at the Eastern Avenue/Kenilworth Avenue Intersection.
Note: This case study considers only the MOT strategies devised for the mainline Kenilworth Avenue through traffic. In addition to the two alternatives mentioned above, the following MOT strategies were considered for illustration purposes:
- MOT Option 3 - close two of three lanes in each direction on mainline Kenilworth Avenue and supplement with two-lane service roads in each direction.
- MOT Option 4 - full closure of this segment of Kenilworth Ave and divert traffic through detour.
- MOT Option 5 - close one of three lanes in each direction only during nighttime.
5.3.2 Objectives
The primary objective of this case study is to demonstrate the application of Kepner-Tregoe Decision Analysis framework in MOT alternative analysis.
5.3.3 Need for MOT Alternative Analysis
In accordance with the FHWA’s Work Zone Rule, MOT alternative analysis is required for any project that is designated as significant. The DOT’s Work Zone Safety and Mobility Policy defines a significant project as the one that, alone or in combination with other concurrent projects nearby, is anticipated to cause sustained work zone impacts that are greater than what is considered tolerable based on DOT policy and/or engineering judgment. The DOT considers the work zone impacts acceptable if the queue length is less than 1.0 mile. MOT alternative analysis is required for any project that is identified as a significant project.
The DOT identified this project as significant based on the following factors:
- Kenilworth Avenue is an urban interstate highway in a metropolitan area that carries heavy traffic volumes each day.
- Traffic disruption caused by work zone activities would directly affect a large number of travelers and result in unacceptable travel delay times and queues.
- This project was expected to occupy the Kenilworth Avenue and Eastern Avenue roadways for more than 2 months with intermittent or continuous lane closure.
Based on the above assessment, there is a need for conducting a comprehensive MOT alternative analysis for this project.
5.3.4 Kepner-Tregoe Decision Analysis
As detailed in section 3.2.7, the steps involved in the K-T decision analysis method are as follows:
- Prepare decision statement.
- Define MUST and WANT objectives.
- Assign weights to WANT objectives.
- Identify candidate MOT alternatives.
- Summarize the findings of work zone impact assessment.
- Evaluate alternatives against MUST objectives.
- Evaluate alternatives against WANT objectives.
- Calculate the weighted scores of alternatives.
- Evaluate adverse consequences.
- Select the preferred MOT strategy.
Step 1. Prepare a decision statement
The purpose of the decision analysis is to identify the most appropriate strategy for maintaining traffic on mainline Kenilworth Avenue during the reconstruction of bridge piers of the Eastern Avenue bridge.
Step 2. Define MUST and WANT objectives
The MUST objectives are mandatory attributes to be considered in the decision process. Any alternative that cannot comply with a MUST objective is eliminated from further consideration, while those comply with all the MUST objectives qualify as feasible alternatives. The MUST objectives identified for this project are as follows:
- Does an MOT option satisfy constructability requirements? — Limited work zone space on mainline Kenilworth Avenue was identified as a key constraint of this project. Therefore, it is imperative to check whether the MOT alternative to be implemented in this project satisfies the constructability requirements.
- Are there any alternate detour routes to accommodate full diversion of Kenilworth Avenue traffic? — The goal is to check whether there are any alternative detour routes that can accommodate full diversion of Kenilworth Avenue traffic to facilitate full closure for longer periods of time, such as a 55-hour weekend closure.
The WANT objectives are desired attributes based on which a preferred alternative is selected from those alternatives satisfying all of the MUST objectives. The WANT objectives identified for this project are as follows:
- Travel delay time — Total delay in vehicle-hours was selected as the measure of effectiveness for this analysis.
- Spillback on MD 201 southbound, US 50 westbound, and other routes— Queuing conditions on Kenilworth Avenue southbound lanes would cause spillback congestion on MD 201 and US 50. Traffic backup on northbound lanes would cause similar impacts on East Capitol Street, Benning Road, and Nannie Helen Burroughs Avenue interchanges. Queuing on Kenilworth Avenue mainlines is used as a surrogate measure for traffic spillback.
- Crash-related risks — The work zone influence area of this project extends into a larger area and is more complex depending on the queuing conditions and detour arrangements. The crash costs were not computed in this case study for the purpose of simplicity, while a subjective assessment of crash-related risks will be taken into consideration.
- Inconvenience to local residents — Large residential areas are located southwest and northeast of the site, especially along Eastern Avenue. The service roads parallel to Kenilworth Avenue serve as transit points (bus stop locations) for local residents using the Washington Metropolitan Area Transit Authority (WMATA) services. There may be a need to relocate WMATA bus stops and impose temporary parking restrictions on these service roads. The inconvenience caused by the work zone MOT implementation on local residents should be considered.
- Emergency response and school transportation — There are several schools in the vicinity of the project area. Therefore, the effect of any traffic diversion, congestion and restriction imposed in the work zone vicinity on emergency response and school transportation should be taken into account.
- Pedestrian access — The Eastern Avenue bridge and nearby service roads are used by many pedestrians, including school children and transit users. There are limited pedestrian bridges to cross Kenilworth Avenue. Therefore, the impact of the selected MOT option on pedestrians, such as the pedestrian restrictions or the distance to the proximate pedestrian bridge, should be considered.
- Construction duration — The number of days for project completion associated with each MOT option should be considered.
- Traffic control and improvement costs — The expenditure for traffic control devices, related roadway improvements (to maintain traffic), and public information strategies should be taken into account.
Step 3. Assign weights to WANT objectives
Each WANT objective is weighted on a scale of 1 to 10 based on their relative importance in the decision process, with 1 indicating “least preferable” and 10 indicating “most preferable” or “equally preferable” (see Table 77).
Step 4. Identify candidate MOT alternatives
The MOT alternatives identified for the decision analysis are listed as follows:
- MOT Option 1 – close one of three lanes in each direction on mainline Kenilworth Avenue.
- MOT Option 2 – close one of three lanes in each direction on mainline Kenilworth Avenue and supplement with two-lane service roads in each direction.
- MOT Option 3 – close two of three lanes in each direction on mainline Kenilworth Avenue and supplement with two-lane service roads in each direction.
- MOT Option 4 – full closure of this segment of Kenilworth Ave and divert traffic through detour.
- MOT Option 5 – close one of three lanes in each direction during nighttime only.
Step 5. Summarize the findings of work zone impact assessment
This step summarizes the findings of quantitative and qualitative assessment conducted to evaluate the impact of MOT alternative on work zone mobility, safety, constructability, and local community.
Constructability
A constructability review was conducted to evaluate the feasibility of the available MOT options. Options 1, 2, 3, and 4 appeared to be feasible from a constructability standpoint. These options allowed a continuous closure of one or more lanes until the bridge piers were installed.
Option 5, which allows only nighttime closure, appeared to be unfeasible, given the work zone space constraint on Kenilworth Avenue. A new foundation had to be cast-in-place before the installation of prefabricated components for the bridge pier, and hence, opening to traffic in the morning after a night closure was not feasible. Furthermore, since large residential areas are located in the work zone vicinity, the impact of construction noise had to be factored in. Though much of the construction work was accomplished at night, some types of activities were not permitted for night work. Therefore, Option 5 was removed from consideration.
Detour Alternatives
Given the volume of traffic, a feasibility analysis was conducted to identify any detour alternatives that would accommodate full diversion of Kenilworth Avenue traffic. The adjacent routes, including US 50 and Capital Beltway (i.e., I-95/I-495), carry similar volumes of traffic each day. As mentioned earlier, Kenilworth Avenue remains the only viable alternative available for commuters between downtown Washington, DC, and northern and eastern locations in Maryland. No alternative route appeared to have adequate capacity to accommodate the traffic that Kenilworth Avenue serves to facilitate a full closure of this segment for an extended period of time. Therefore, Option 4 was removed from consideration.
Service Roads
MOT Options 2 and 3 require using service roads to supplement the roadway capacity on Kenilworth Avenue. To open service roads for Kenilworth Avenue mainline traffic, the WMATA bus stops would have to be relocated. Temporary parking restrictions would have to be needed along the service lanes.
Pedestrian Access
Pedestrians typically use the Eastern Avenue bridge to cross Kenilworth Avenue. With the implementation of Options 2 and 3, pedestrians would have to detour approximately 0.5 mile round-trip to the nearest pedestrian bridge over Kenilworth Avenue. Pedestrian access improvements, such as temporary pedestrian bridge, were considered, but the high costs of these improvements would outweigh the likely minimal benefits to the low number of pedestrians using the intersection.
Emergency Response and School Transportation
With the selection of MOT Options 2 and 3, the DOT was required to provide advice on detours to emergency responder and school transportation officials. The adverse mobility impacts associated with an MOT alternative would have a proportional impact on emergency response time and incident management. The contractor was required to prepare incident/emergency response plan per the contract special provisions.
Construction Duration
The estimated construction duration with MOT Options 1, 2, and 3 was 2 months.
Traffic Control and Improvement Costs
No discernable difference in traffic control and related improvement cost was found among MOT Options 1, 2, and 3.
Mobility Impacts
Maryland SHA’s Lane Closure Analysis Program (LCAP) was used to estimate delays along mainline Kenilworth Ave for Options 1, 2, and 3. Traffic demand volumes for a 48-hour period (Wednesday-Thursday) were entered into LCAP to determine the expected impacts of the lane closures. Traffic counts were taken along mainline Kenilworth Avenue for the same 48-hour period using automated machine count in October 2006. The work zone capacity values were obtained from Appendix B of the District of Columbia Work Zone Safety and Mobility Policy (dated 2007). The work zone capacity values assumed in the analysis were 1,490 and 1,170 vphpl for a single and two lane closures, respectively. The assumed work zone capacity was 1,000 vphpl for service roads.
Figures 27, 28, and 29 present the delay estimates varying along the time of day on northbound and southbound lanes of Kenilworth Avenue for MOT Options 1, 2, and 3, respectively. Table 78 presents the average and maximum delay time estimates for the three options. The statistics of delay time estimates indicate that the mobility impacts were much more severe with Options 1 and 3 than with Option 2. Figures 30, 31 and 32 present the delay estimates varying along the time of day on northbound and southbound lanes of Kenilworth Avenue for Options 1, 2, and 3, respectively. Table 78 presents the average and maximum queue estimates for these options. The average and maximum delay estimates with Option 2 appeared to be more tolerable than those with the other options.
Based on the LCAP estimates, Option 2 appeared to be the most advantageous from a mobility standpoint and was likely to result in much lower delay costs and VOC than other options.
Figure 27. Eastern Avenue project: travel delay estimates for Option 1.
Figure 28. Eastern Avenue project: travel delay estimates for Option 2.
Figure 29. Eastern Avenue project: travel delay estimates for Option 3.
Figure 30. Eastern Avenue project: queue length estimates for Option 1.
Figure 31. Eastern Avenue project: queue length estimates for Option 2.
Figure 32. Eastern Avenue project: queue length estimates for Option 3.
Crash-related Risks
Based on the LCAP estimates of work zone mobility, the degree of delay and queue length estimated for Options 1 and 2 is likely to increase crash-related risks. Longer delays result in increased driver frustration and aggressiveness, and longer duration of congestion will likely increase the incidence of queues and rear-end accidents, particularly on mainline Kenilworth Avenue. On the other hand, Option 2 would produce a relatively unusual traffic pattern of dividing the lanes with all lanes proceeding through. Drivers who comprehend the posted signs relating to service roads might end up with erratic maneuvers, thus increasing the probability of crashes.
Step 6. Evaluate alternatives against MUST objective
All available alternatives were evaluated against two of the MUST objectives identified in Step 2. The discussion focusing on the availability of detour routes and constructability review (see Step 5) was used in the evaluation against MUST objectives. The results obtained from the evaluation are presented in Table 79.
Option 4 was eliminated from further consideration as it failed to meet the constructability requirements. As discussed in Step 5, restricting lane closure to nighttime only would not satisfy the constructability requirements, and hence failed to meet the first MUST objective. Similarly, Option 5 was considered unfeasible as there were no alternative detours to accommodate full closure of Kenilworth Avenue, and therefore, was eliminated from further consideration.
Options 1, 2, and 3 successfully satisfied the MUST criteria and would be evaluated further against WANT objectives.
Step 7. Evaluate alternatives against WANT objective
Options 1, 2, and 3 were evaluated against each of the WANT criteria. The discussion presented in Step 5 was used as a basis in determining how well the alternatives meet these objectives. Based on the strengths and weakness that became evident during evaluation, each alternative was assigned with a score on a 1 to 10 with 10 being most advantageous and 1 being least advantageous. The results obtained from the evaluation are presented in Table 80.
The following discussion presents the rationale behind scoring these alternatives:
- Travel delay time – As evident in Table 78, Option 2 is likely to result in shorter travel delay time when compared to other options. Option 3 is likely to produce lesser impact than Option 1, although still at an unacceptable level.
- Spillback on nearby roadways – Similar to travel delay time, Option 2 is likely to result in shorter queue lengths than the other options, and hence least likely to cause spillback on nearby roadways.
- Crash-related risks - Options 1 and 3 were assigned low scores for their high likelihood of safety risks resulting from longer work zone exposure period and severe mobility disruptions. Option 2 was assigned a score less than 10 because of the risks associated with detour patterns and split traffic at the fork of mainline and service roads.
- Inconvenience to local residents – Opening the service roads to the mainline freeway traffic would result in greater inconvenience for local residents. The bus stops would have to be relocated, and no road-side parking would be allowed. Hence, the MOT options using service roads for traffic maintenance received low scores.
- Emergency response and school transportation - Options 1 and 3 were assigned low scores based on the mobility disruptions they are expected to create. The closure of service roads to local traffic and the detour patterns in-place pose some risks for emergency responders with the implementation of Option 2.
- Pedestrian access – Opening the service roads to the mainline freeway traffic would restrictions to pedestrian access, and hence lower scores for Options 2 and 3.
- Construction duration – Since Options 1, 2, and 3 appeared to have no impact on construction duration, they were not evaluated against this objective (or receives equal scores).
- Traffic control and improvement costs – Since Options 1, 2, and 3 appeared incur similar level of traffic control/roadway improvement costs, the options were not evaluated against this objective.
Step 8. Calculate the weighted scores of alternatives
The weighted scores for MOT Options 1, 2, and 3 were computed by multiplying their scores by the weights identified in Step 3. The sum of these scores represents an evaluation of each alternative against the previously established criteria and weights. Table 81 presents the weighted score for each alternative. The last row in this table presented the total weighted score.
The alternative with the highest total weighted score—Option 2—was selected as a tentative choice.
Step 9. Evaluate adverse consequences
After the computation of total weighted score, each MOT alternative was evaluated individually against potential risks identified in the work zone impact assessment. Since the Kenilworth Avenue route serves as a homeland security evacuation route for DC wards 7 and 8, the risk of selecting an alternative against a probable event of an emergency evaluation was considered.
The likelihood of an emergency evacuation was selected on a rating scale from “Low” to “High,” with a rating of “Low” indicating “an unlikely event” and “High” indicating “a most probable event.” A probability rating of “Low-Medium (LM)” was selected, indicating that such an event is less likely. Next, the performance of the MOT options under this scenario was evaluated. The alternatives were rated on a similar scale, with a value of “Low” indicating “inconsequential” and “High” indicating “very severe.”
As Options 1 and 3 were likely to cause longer delay times and queue lengths, a rating of “High-medium (HM)” was assigned to both options, while Option 2 was rating as “Medium (M)” (see Table 82). Option 2 appeared to perform better than other options under an adverse event.
Based on this evaluation, no MOT option was identified as a high-risk choice. All alternatives were considered as “low-risk” alternatives.
Step 10. Select the preferred MOT strategy
The total weighted score were summarized and ranked for each alternative (see Table 83). The results of adverse consequence evaluation are also summarized. Based on the information presented in Table 83, Option 2 fared better against both WANT objectives and adverse events than other alternatives, and hence was selected as the preferred MOT strategy.
You will need the Adobe Reader to view the PDFs on this page.
previous | next