F. Sample Appendices – Moderate-to-Major Impacts (Sample TMP 2)
B. Crash Analysis & Safety Review
E. Maintenance of Traffic Concept/Typical
G. Safety and Mobility Peer Team Review
A. Hourly Count Reports
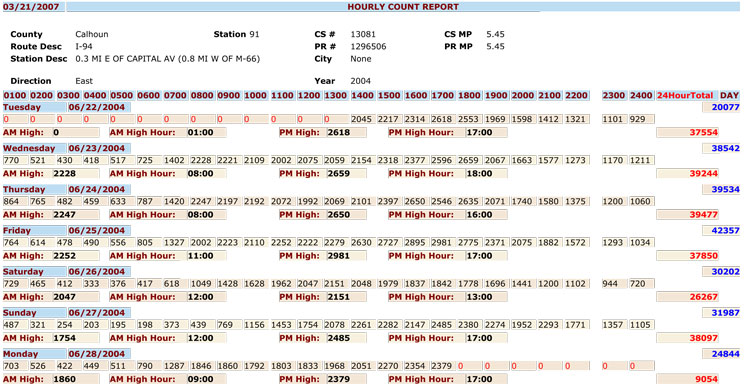
Summary: Appendix A consists of hourly traffic count reports for I-94 at control stations 13081 and 13082. The traffic count report by hour is provided for both locations for the years 2000, 2002, and 2004. The report includes a.m. and p.m. peak hour volume and 24 hour total volumes for each day.
Relevance: Traffic counts provide data so that the engineers can analyze the road network for existing and future construction conditions. This allows engineers to determine potential locations that may be prone to traffic congestion and queuing, and that may warrant periodic monitoring during construction. If analysis shows that congestion and queuing would be unacceptable, the Agency can make adjustments to the construction plans and TMP.
Image description: A typical seven day traffic count report for the I-94 control station 13081, 0.31 miles east of Capital Avenue. The report provides hourly traffic volumes for the period June 22, 2004 through June 28, 2004; Tuesday through next Monday. The report also includes a.m. and p.m. peak hour volume and 24 hour total volumes for each day. The a.m. peak hour volume varies from 1754 to 2252 vehicles; p.m. peak hour volume varies from 2151 to 2981 vehicles; and total 24-hour traffic volume varies from 26,267 to 39,477 vehicles.
B. Crash Analysis & Safety Review
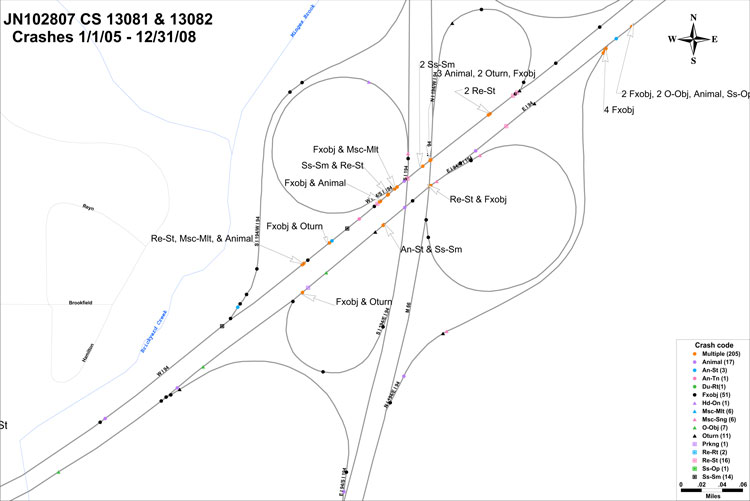
Summary: Appendix B consists of a memo summarizing the crash analysis and safety review for I-94 at control stations 13081 and 13082, followed by a series of crash diagrams for each section. The diagram indicates the type and location of the crashes for the period January 1, 2005 through December 31, 2008, a 3-year period. The type of crashes shown includes:
- Fixed object
- Animal
- Sideswipe
- Rear-end straight
- Angle straight
- Miscellaneous Vehicle
- Over turn
- Other object
Michigan Department of Transportation Office MemorandumDATE: March 4, 2008 TO: Raja Jildeh, Supervising Engineer, Lansing Bridge Design Unit FROM: Angie Kremer, Traffic & Safety Engineer, Marshall TSC SUBJECT: Crash Analysis & Safety Review, CS 13081 JN 75047, I-94 Structures S05-3 & S05-4 of 13081, Riverside Drive Bridges I have conducted a crash analysis and safety review for a three year period (January 1, 2005 – December 31, 2007) of the following locations. I-94 Structures S05-3 & S05-04 of 13081, Riverside Drive Bridges The proposed project consists of a total structure replacement for both structures. The structures are in a horizontal curve and the super elevation will be built to current standards. The following table describes the roadway, ADT and level-of-service:
Crash Analysis & Safety Review I-94 Eastbound Three year period (January 1, 2005 – December 31, 2007) were reviewed for this location using the TMS database. The segment analyzed was 0.2 miles east and west of S05-3 of 13081. Eight (8) crashes occurred at this location in the three year study period. The crashes are as summarized in the table below.
No fatalities or disabling injuries occurred from any of the crashes. One crash was alcohol related, a fixed object crash. Driver hit guardrail and was cited for OWI. Four crashes were due to weather conditions either being icy, snowy or wet. The wet crash the officer noted on the crash report that driver needed to replace tires. Two crashes were either due to passing or quick lane changes that caused swerving. The remaining crash was road debris that fell off a trailer the driver was behind. No correctable crash patterns exist at this location on I-94 eastbound for which safety countermeasures will be necessary beyond the current scope of work. Crash Analysis & Safety Review I-94 Westbound Three year period (January 1, 2005 – December 31, 2007) were reviewed for this location using the TMS database. The segment analyzed was 0.2 miles east and west of S05-4 of 13081. Eight (8) crashes occurred at this location in the three year study period. The crashes are as summarized in the table below.
No fatalities or disabling injuries occurred from any of the crashes. Also no crashes were alcohol related. The animal and sideswipe crashes were the predominate crash pattern for this area. The animal crashes were not deer crashes. One crash involved a turkey and the other a dog. Two crashes (sideswipe same and angle straight crash) were due to the ramp merge area. One of the crashes the driver lost control of a trailer and the other crash the roadway was marked as "icy". One crash was construction related. The vehicle was stopped due to construction and one of the vehicles then started to roll back and stuck the vehicle behind. The remaining three crashes were either due to weather conditions or quick lane changes that caused swerving. No correctable crash patterns exist at this location on I-94 westbound for which safety countermeasures will be necessary beyond the current scope of work. Crash Analysis & Safety Review Riverside Drive Three year period (January 1, 2005 – December 31, 2007) were reviewed for this location using the TMS database. The segment analyzed was 0.076 miles north and south of I-94 on Riverside Drive below. One (1) crashes occurred during this span, and the crash was an animal crashes. Searching the High Load Hit Statewide Bridge list from 2001 to 2006 no events were recorded for the Riverside Drive structures. Two events were logged in for the High Load Hit Southwest Bridge list from 1977 to 2000. The events were not crash related but were listed as "Raise and Shim Bridge." The new structures will meet the minimum bridge under clearance for a local road (14' 6"). None of the crashes are attributable to insufficient structure underclearance. No correctable crash patterns exist at this location on Riverside Drive for which safety countermeasures will be necessary beyond the current scope of work. If you have any questions regarding this document please call me at 269-789-0560 extension 239. Annjanette Kremer, P.E. cc: Alissa Hubbell, Carrie Hamel, Sarah Fedders |
Relevance: A crash analysis of the project area will help to identify potential high crash locations for monitoring and/or other strategy deployments during construction. Ongoing monitoring of these potential locations for any change in crashes is important to assess and manage future construction impacts.
Image description: A typical crash diagram for control sections 13081 and 13082 during January 1, 2005 through December 31, 2008 is shown here. The location shown includes part of I-94 and the interchange for M-66. The crashes are plotted by location and type. The most common type of crash was fixed object.
C. Traffic Analysis Reports
Summary: Appendix C consists of traffic analysis reports which include level of service charts generated based on the Highway Capacity Manual and output from the Michigan DOT CO3 model.
Level of service is used to rate the performance of roadways and intersections based on capacity and traffic volumes. Grades "A to F" are used to describe the performance with "A" being best and "F" being worst. The data shown in the charts includes traffic volume, capacity, volume to capacity ratio, and level of service. The analysis was conducted at the following locations for different conditions that are:
- Eastbound I-94 by Riverside Bridge for Bridge Replacement
- Westbound I-94 by Riverside Bridge for Bridge Replacement
- Eastbound I-94 by Riverside Bridge for Capital Preventive Maintenance Project
- Westbound I-94 by Riverside Bridge for Capital Preventive Maintenance Project
- Eastbound I-94 East of I-194/M66 for Capital Preventive Maintenance Project
- Westbound I-94 East of I-194/M66 for Capital Preventive Maintenance Project
The CO3 Model is a tool used by Michigan DOT to estimate the magnitude and impact of traffic congestion during a construction project expressed in dollars. CO3 enables engineers to include construction congestion and its costs to users as an important variable in all project decisions, and helps in selecting among alternative methods for maintaining traffic during construction. The output from the CO3 model mainly includes user cost, back-up length, and delay. The analysis was conducted at the following locations for different conditions:
- Eastbound I-94 by Riverside Bridge for Bridge Replacement
- Westbound I-94 by Riverside Bridge for Bridge Replacement
- Eastbound I-94 by Riverside Bridge for Capital Preventive Maintenance Project
- Westbound I-94 by Riverside Bridge for Capital Preventive Maintenance Project
- Eastbound I-94 East of I-194/M66 for Capital Preventive Maintenance Project
- Westbound I-94 East of I-194/M66 for Capital Preventive Maintenance Project
Relevance: Traffic analysis helps to quantify the measures of effectiveness that are used for assessing the mobility conditions of a project. The Measures of Effectiveness considered in this project include:
- Vehicle delay (in minutes),
- Volume to Capacity ratio,
- Level of Service,
- Maximum backup length (in miles), and
- Road user cost
Image description (1): A sample level of service analysis sheet done for I-94 east bound by Riverside Bridge is shown. The analysis scenario is to maintain two 11 foot lanes in each direction of the freeway. The chart mainly provides data on traffic volumes, volume to capacity ratio, and level of service for a 24-hour period from Tuesday through the next Monday. The chart is color coded depending on level of service. Level of service A, B, and C are shown in green whereas D and E are shown in yellow and orange respectively. The afternoon peak period from 3:00 p.m. to 6:00 p.m. represents the time of the day with the worst traffic condition, which is level of service E.
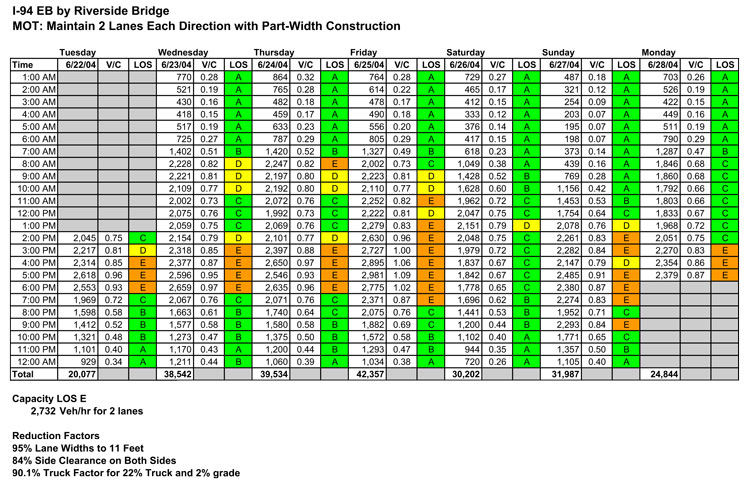
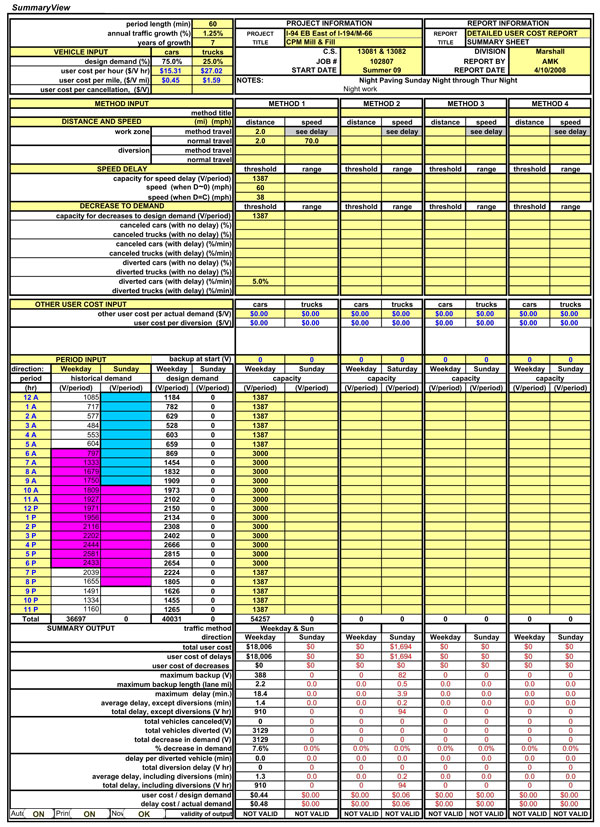
Image description (2): A second sample level of service analysis sheet done for I-94 west bound by Riverside Bridge is shown. The analysis scenario is to maintain one 10 foot lane in each direction during non-restricted hours from Sunday through Thursday nights. The chart provides data on traffic volumes, volume to capacity ratio, and level of service for a 24-hour period from Tuesday through the next Monday. The chart is color coded depending on level of service. Restricted and non-paving hours are also color coded. Level of service A, B, and C are represented in green, level of service D in yellow, and level of service E is represented in orange. For hours when lanes closures are not allowed due to high traffic volumes, the volumes are represented in magenta. Hours when paving is not allowed for other reasons, such as on Saturday and Sunday nights, are represented in blue. There are few hours of level of service E when paving is allowed and they are mostly between 7:00 p.m. and 11:00 p.m.
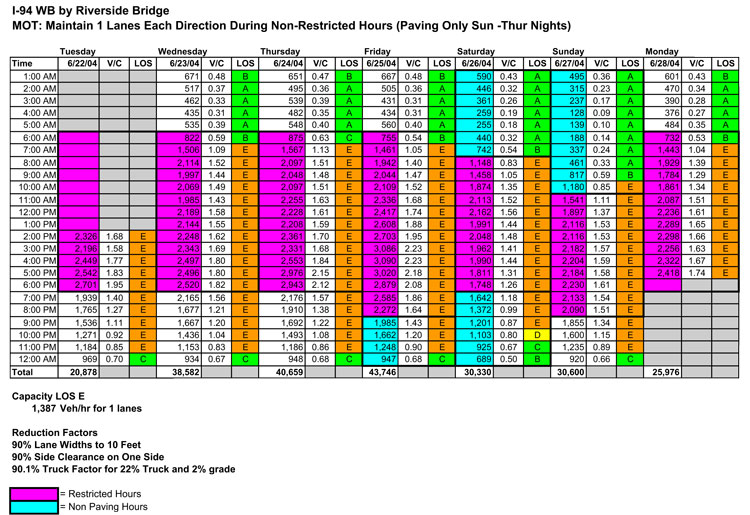
Image description (3): A summary CO3 analysis calculation sheet for I-94 west bound by Riverside Bridge for the bridge replacement project is shown. The input entered includes user cost, distance and speed for the work zone and diversion route, capacity threshold, and traffic volume. The analysis was done for a 24-hour time period during a weekday. The analysis shown indicates a maximum delay of 1.4 minutes with a total delay of 618 vehicle hours; user cost is estimated to 11,342 dollars.
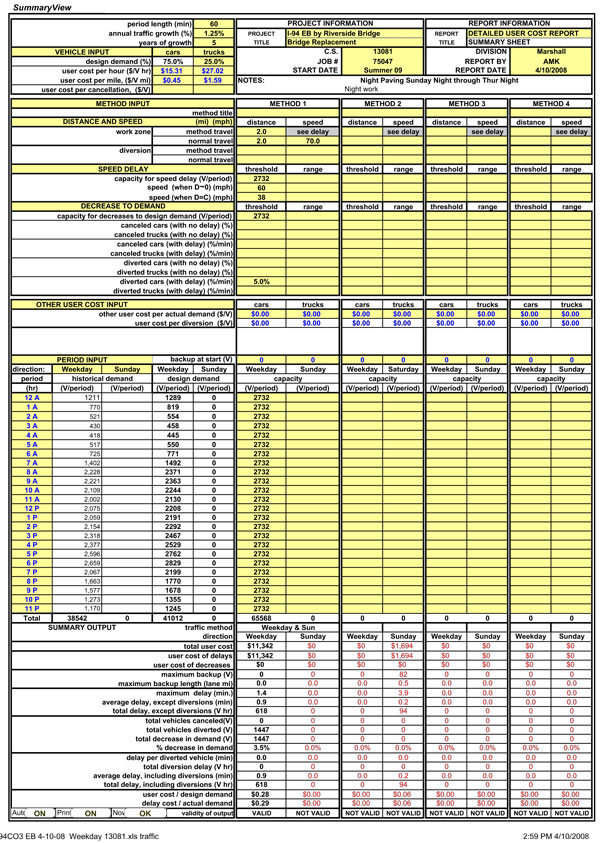
Image description (4): A summary CO3 analysis calculation sheet for I-94 east bound, east of I-194/M-66 for a capital preventive maintenance project is shown. The input entered includes user cost, distance and speed for the work zone and diversion route, capacity threshold, and traffic volume. The analysis was done for 24-hour time period for a weekday. The traffic volume data is color coded to show the hours when paving is restricted due to traffic volume levels, shown in magenta, or other reasons, shown in blue. The analysis shown indicates a maximum delay of 1.4 minutes with a total delay of 73 vehicle hours; user cost is estimated to 1,333 dollars.
D. Clauses
13081-75047A
PROGRESS CLAUSE: After receiving Notice of Award, start work on 4-13-09. No work shall be commenced prior to receipt of formal notice of award by the Department.
The contract shall be open to traffic on or before 11-13-09.
All work shall be completed on or before 11-13-09 except maintenance of soil erosion and sedimentation control items.
This contract shall be completed on or before 5-30-10.
The low bidder(s) for the work covered by this proposal will be required to meet with Department representatives to work out a detailed Progress Schedule.
The named subcontractor(s) for Designated and/or Specialty Items, as shown in the proposal is recommended to be at the scheduled meeting if such items materially affect the work schedule.
The Delivery Engineer will arrange the time and place for the meeting.
The Progress Schedule shall include, as a minimum, the controlling work items for the completion of the project and the planned dates (or work day for a work day project) that these work items will be controlling operations. When specified in the Bidding proposal, the date the project is to be opened to traffic as well as the final project completion date shall also be included in the Progress Schedule.
If the Bidding Proposal specified other controlling dates, these shall also be included in the Progress Schedule.
Failure on the part of the Contractor to carry out the provisions of the Progress Schedule, as established, may be considered sufficient cause to prevent bidding future projects until a satisfactory rate of progress is again established.
The low bidder(s) for the work covered by this proposal may be required to meet with department representatives for a post-construction review meeting, as directed by the Engineer. The MDOT Delivery Engineer will schedule the meetings.
COORDINATION CLAUSE FOR OTHER CONTRACTS IN VICINITY
CS 13081 - JN 75047A
The contractor shall coordinate their construction and traffic maintenance with the following project:
CS 13082 (13083) – JN 74956A: This project is a HMA overlay, concrete pavement repairs under the structures, ramp improvements, and guardrail upgrades on I-94 in Calhoun County. The construction completion is anticipated for xx/xx/2009
CS 13081 (13082) – JN 102807A: This project is a capital preventative maintenance HMA overlay on I-94 in Calhoun County. The construction completion is anticipated for xx/xx/2009.
The contractor's attention is called to the requirements of cooperation with others as covered in Article 104.07 of the 2003 Standard Specifications Construction.
No claim for extra compensation or adjustments in contract unit prices will be allowed due to delay caused by other projects.
E. Maintenance of Traffic Concept/Typical
Summary: Appendix E consists of Maintenance of Traffic related provisions and typical applications for the I-94 by Riverside Bridge Replacement project and I-94 East of I-194/M66 capital preventive maintenance project. The appendix includes:
- Special provisions for maintaining traffic, permanent signing, and pavement marking – regarding the construction influence area, traffic restrictions, work zone speeds, construction staging, traffic control devices, and measurements and pavement
- Maintenance of Traffic Typical – includes minimum merging taper length for different speeds, length of longitudinal buffer space required, and typicals for different work zone conditions.
- Work zone sign design – includes sign dimensions, color, text, and letter spacing
- Estimate of temporary sign quantities – includes MUTCD name for the sign, message shown on the sign, quantities required, and size of the sign
- Detour route map – shows the normal route and planned detour route
Relevance: Maintenance of traffic concepts or phasing plans describe the strategies for temporary traffic control, which is one component of the TMP. In most cases a summary of the temporary traffic control strategies are included in the TMP document itself and the plans and details are provided as an Appendix. Keeping the temporary traffic control plans with the TMP also helps in case there is a need for any clarification of the strategies documented in the TMP.
Image description (1): The illustration shows a typical application for extended temporary traffic control for a two lane shift with a reduced speed limit. The typical application shows the proposed lane configuration and location of various temporary traffic control devices such as channelizing devices, lighted arrow panel, temporary work zone signs, and temporary pavement markings. The typical application shows that the existing speed limit of 70 miles per hour is reduced to 60 miles per hour in the work zone and 45 miles per hour where workers are present.
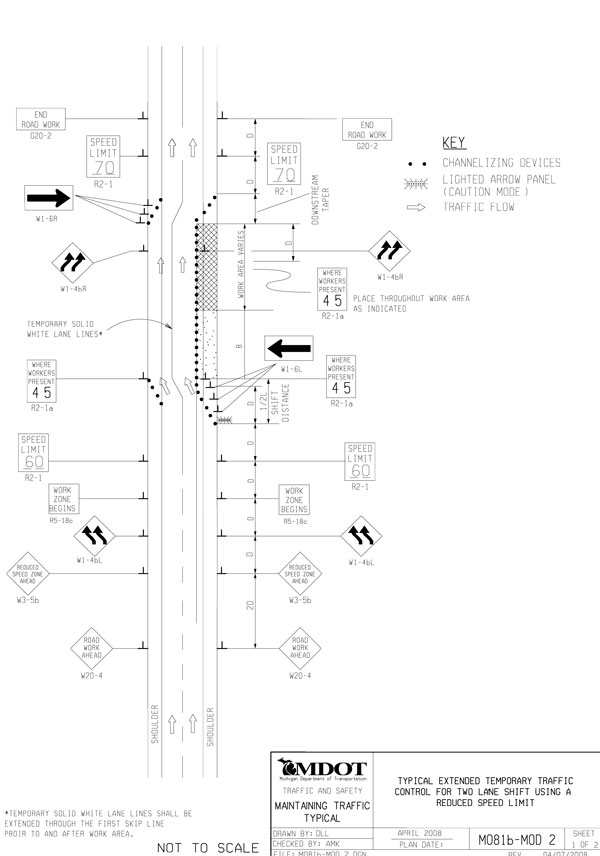
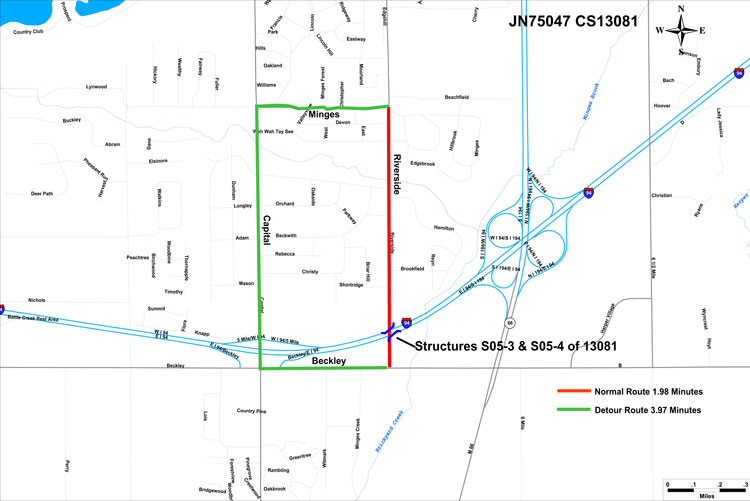
Image description (2): This illustration shows a detour plan for the I-94 bridge replacement project. The plan shows the existing route on Riverside Drive and the proposed detour route on Minges, Capital, and Beckley streets. The existing route has a travel time of 1.98 minutes, whereas, the detour route has a travel time of 3.97 minutes.
F. Design Plans/Typical
Summary: Appendix E consists of temporary traffic control plans for the construction of the I-94 bridge replacement project. The plans consist of:
- Title sheet – which includes job location, general notes, title sheet legend, plan index, county key, approvals, and other general project details such as project number, control section, and project name
- Typical cross section – at various station points for I-94 and Riverside Drive,
- Removal and construction sheet – excavation and filling at various station points for I-94 and Riverside Drive
- Staging typical – to maintain traffic on the outside lane and shoulder and inside lane and shoulder
- General plan of the site,
- Soil boring data,
- General plan of structure, and
- Construction staging details.
Relevance: While design plans are not a critical component of the TMP, it is included to provide the TMP audience with an understanding of the extent of the project scope for the I-94 Bridge Replacement project.
Image description (1): This illustration shows two typical cross sections for the I-94 bridge replacement project. Each typical cross section applies to a specific area between two stations. The cross section provides information on lane and shoulder widths, slope, and material type.
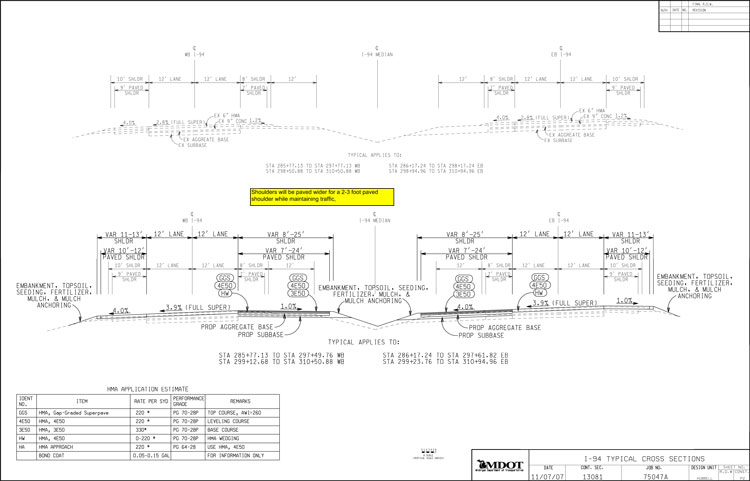
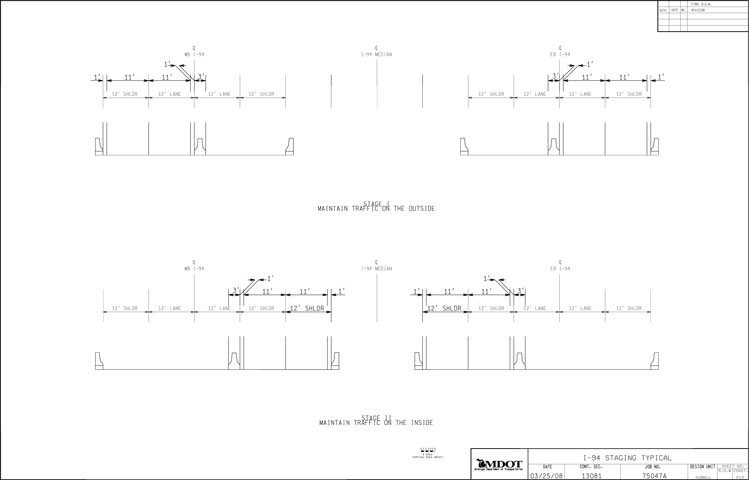
Image description (2): This illustration shows a typical cross section for the I-94 bridge replacement project. Two staging plans are shown. The first staging has two 11 foot lanes on either side of the roadway utilizing the outside lane and shoulder. Construction will be done on the inside lanes and shoulder during this stage. The second staging has two 11 foot lanes on either side of the roadway utilizing the inside lane and shoulder. Construction will be done on the outside lanes and shoulder during this staging.
G. Safety and Mobility Peer Team Review
Michigan Department of Transportation Office MemorandumDATE: May 9, 2008 TO: Brett Xxxx[1], Manager, TSC FROM: Greg Xxxx, Statewide Operations Engineer, Operations Division SUBJECT: Safety and Mobility Peer Team Review (Statewide), Transportation management Plan (TMP) Submittals The May 2008 SPRT review of 2009 projects has been completed. Included with this memo is a copy of the completed review form(s) for each project listed below submitted by your office. Please review these forms and take any appropriate actions to enhance your projects.
If your project(s) was rated as green, feedback to my office is not necessary. Please thoroughly consider any suggestions/comments on the review forms and file the review forms in the project files. If your project(s) was rated as yellow, feedback to my office is required. Please thoroughly consider any suggestions/comments and provide feedback on what safety and mobility items were implemented in your respective TMP(s) based on the SPRT review. This information will be compiled and provided to MDOT Executive Staff and the Federal Highway Administration (FHWA). If your project(s) was rated as red, re-submittal of the TMP to this office is required. Please address all critical issues and resubmit a revised TMP within the next 30 days. If you have any questions or concerns with the review of your project(s), the review process or with this memorandum please contact me at your earliest convenience at 517-636-0463. Statewide Operations Engineer Attachment |
| Project Identification | Control Section: 1308 & 13083 | Job Number: 75047 & 102807 | Route: I-94 | ||
|---|---|---|---|
| Location | I-94 EB & WB from Helmer Road to 61/2 Mile Road | ||
| Work Description | Replacement of two bridges over Riverside Drive. CPM COLDMILL and HMA Overlay |
||
| Contact | Name: Jason Xxxxx | Phone: 555-555-5555 | ||
| Review Team Members | Bill Xxxx, Bruhat Xxxxx, Heather Xxxx, Bil Xxxx, Dean Xxx, Sean Xxxxxxx | ||
| Review Date | 05/06/08 | ||
| Operational Parameters | V/C | LOS | Average Delay (Minutes) |
| Existing | 0.9, 0.9, 0.75 | D, E, C | N/A |
| Work Zone | 1.13, 1.57, 1.41 | E, E, E | 0.9, 1.4, 1.4 |
| TMP Package Complete | X Yes | No | X TTC | ||
| Let Date | October 3, 2008 | X TOP | ||
| Construction Start Date | April 13, 2009 | X PIP | ||
| Construction End Date | May 30, 2010 | X Vicinity Map | ||
| SMPT Recommendation | SMPT Summary Comments |
|---|---|
| Red Light: Not OK to Proceed Review SPRT Comments: Region Engineer to Discuss with COO |
|
| Yellow Light: OK to Proceed Review SPRT Comments: Region/TSC Incorporate Changes As Appropriate |
|
| X Green Light: OK to Proceed |
| Item | Comments | |
|---|---|---|
| X YES | Traffic data sourc(s) is appropriate and reasonable | |
| NO | ||
| X YES | Traffic analysis methodology is appropriate and reasonable for the scope/complexity of the job location. The results are clear and understandable | |
| NO | ||
| X YES | The delay assumptions and calculations are reasonable and the approach is consistent with current practice and policy | |
| NO |
| Item | Comments | |
|---|---|---|
| X YES | The TTC concept seems responsible and logical given the type of work, the system level, the duration of the project, and the traffic volumes | |
| NO | ||
| X YES | Staging and constructability is well thought out and seems responsible. | |
| NO | ||
| X YES | There is evidence of analysis with respect to similar projects and job specific characteristics (shy distance, slopes, attenuation, and horizontal/vertical sight distances); the work zone is designed accordingly. | |
| NO | ||
| X YES | There is analysis of the alternatives considered, with an appropriate comparison of benefits and costs. | What is cost of widening bridge structure vs. user delay cost for one lane operation? |
| NO | ||
| X YES | There is a work zone crash analysis and comparison to crash statistics for similar project types/locations. There are no elements of unacceptable risk for the public or highway workers. | Nice to see crash analysis included with packet |
| NO | ||
| X YES | There is guidance on the development of an internal work zone (contractor’s operation) traffic control plan for contractor ingress and egress. | |
| NO | ||
| X YES | There is an appropriate plan to monitor safety and mobility and adjust the work zone/project during construction as needed. | |
| NO |
| Item | Comments | |
|---|---|---|
| X YES | TOP is complete and reasonable. It includes necessary provisions for pedestrians, emergency response, commercial vehicles, transit operations, etc., if necessary | |
| NO | ||
| X YES | Delay mitigation techniques are evident and are applied appropriately. Are there any techniques that you would recommend be added to the project at this stage that the Region/TSC should consider? | No additional techniques are recommended |
| NO | ||
| X YES | If applicable, is there adequate discussion of projects packaged or bundled with this project, an explanation of mobility influences beyond the project area? | N/A |
| NO |
| Item | Comments | |
|---|---|---|
| X YES | The Public Information Plan is appropriate for the scope of the Project | |
| NO |
| Item | Comments | |
|---|---|---|
| X YES | These are best practices in the area of mobility analysis, mitigation techniques, TTCP or TOP development evident in this TMP that should be shared with others. | |
| NO | ||
| YES | ||
| X NO | These are recommended areas of focus for further review by the Region/TSC | |
| YES | ||
| X NO | There are areas of concern that the team feels should be documented for review by either the Region Engineer or Chief Operations Officer |
previous