EA 08-472214
slide 1

Jonathan den Hartog, P.E.
View the PDF
Version [1.8 MB]
![]() You will need the Adobe
Reader to view the PDFs on this page.
You will need the Adobe
Reader to view the PDFs on this page.
![]()
slide notes
- Introduce yourself.
- $52 million project pavement rehabilitation project
- Begun in April 2009. Estimated completion by the end of this year.
slide 2
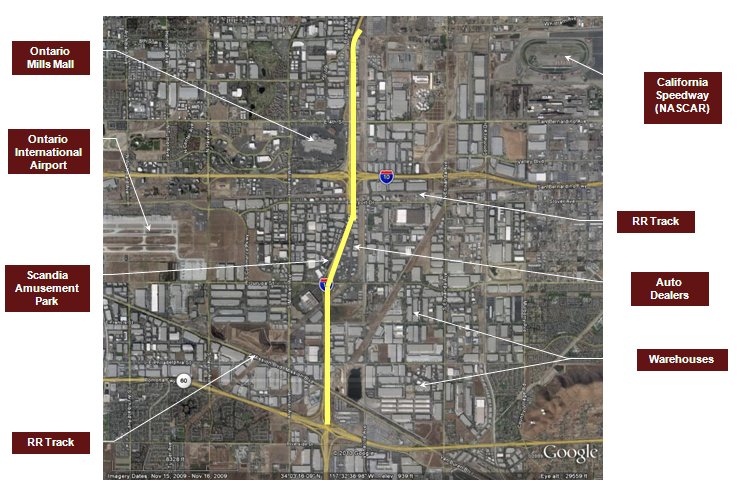
Project Location
![]()
slide notes
- Ontario is about 40 miles east of downtown LA
- In Addition: Major route for Las Vegas traffic. No break on weekends.
slide 3
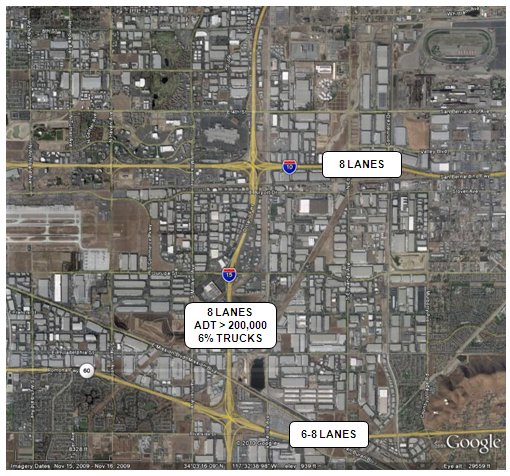
Project Location
![]()
slide notes
- Again, no break on weekends
slide 4
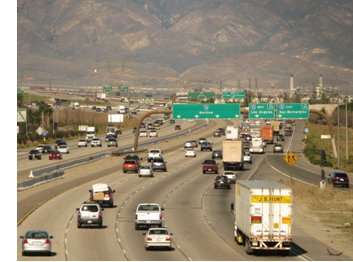
Project Features
- Median Paving
- Bridge Widening
- New Median Barrier
- Shoulder/Ramp Rehab
- Pavement Rehabilitation
- 12 ln-mi lane replacement
- Random slab replacements
- Includes connectors
- Precast Pavement (Super-Slab)
![]()
slide notes
- Picture is non-rush hour, on a weekday. Saturday would be similar. All days can have traffic jams
- Bridge widening was to close the gap between NB and SB bridge decks.
slide 5
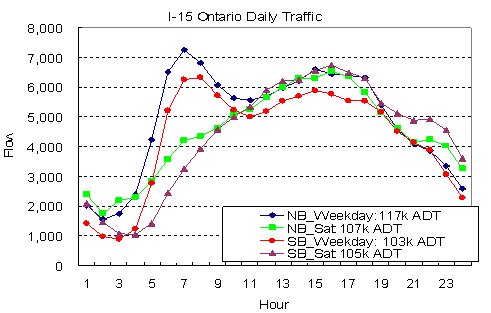
Traffic Volumes
![]()
slide notes
None.
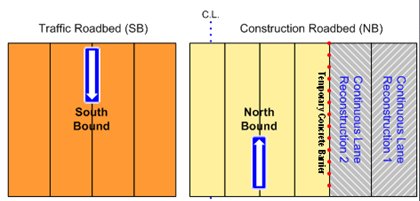
slide 6
Construction Sequence
![]()
slide notes
None.
slide 7
Rapid Weekends
- 5 Major Stages,
- 25 sub-stages
- 410 Working Days (~2 yrs)
- 55-Hour Weekend Closures
- Beginning late Friday evening
- Ending early Monday morning
- Approximately 30 weekends
- ~8 full roadbed closures
![]()
slide notes
- Needed CA4PRS to justify this approach.
- Also, wanted to include incentive to reduce number of weekend closures. Needed to justify this.
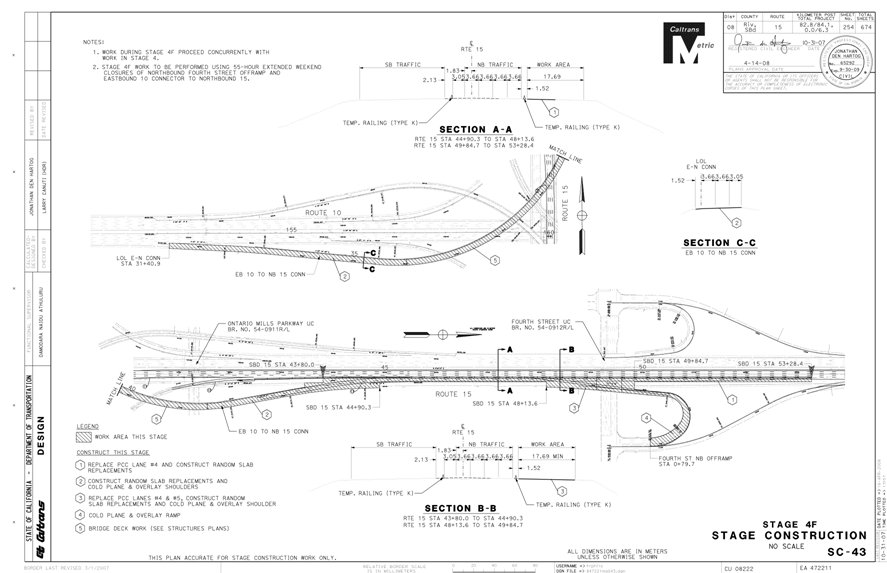
slide 8
Typical Closure
![]()
slide notes
None.
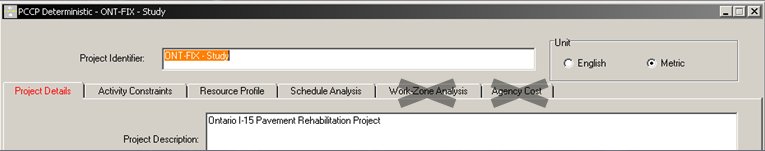
slide 9
CA4PRS Study
- 2 Phase Study
- Alternative Analysis And Comparison
- Detailed Study of Preferred Alternative
- Performed by consultant sub
![]()
slide notes
- The subcontractor was Dr. E.B. Lee
- The CA4PRS study was done in conjunction with a traffic modeling study, performed by a different sub.
- At the time, CA4PRS did not include the Work-Zone Analysis or Agency Cost modules. These efforts had to be done separately.
- Traffic analysis was done by EB Lee (in addition to the traffic modeling study) using the same Demand Capacity Model now incorporated into the software.
slide 10
CA4PRS Study Purpose
- Validate the alternative chosen
- Provide a detailed estimate of:
- Working days for the project
- Number of closures needed for each stage
- Basis for Incentive/Disincentive
$150,000 per saved closure
(Max $900,000)
$175,000 per extra closure
![]()
slide notes
- $150,000 is the average delay damages calculated.
- The disincentive includes $25,000 for the public awareness campaign to alert the public about the closure.
- Incentive is applied for every closure less than 27 used. Disincentive for every closure over 32.
- Did not use the software for LCCA.
slide 11
Alternatives Analysis
| Scenario | Closure Duration | Traffic RUC** ($M) | Traffic Delay**(min) | Agency Cost ($millions) | TotalCost** ($millions) | Cost Ratio |
|---|---|---|---|---|---|---|
| 1. Original | 35 weekends | 3 | 16 | 78 | 79 | 100% |
| 3. Contraflow 55-hr Weekend | 35 weekends | 119 | 363 | 83 | 123 | 156% |
| 4. Progressive Continuous | 8 weeks | 123 | 363 | 77 | 118 | 149% |
| 5. Traditional Nighttime | 1,220 nights | 133 | 22 | 88 | 133 | 168% |
| 6. CSOL 55-hour weekend | 20 weekends | 69 | 363 | 60 | 83 | 105% |
| ** Total Cost = 1/3 RUC + Agency Cost |
||||||
![]()
slide notes
- Go over columns. Delay is per closure.
- 2nd alternative dropped out because of safety concerns.
- Alternative 1 required bridge widening
- Alternatives 3,4 would have serious traffic delay impacts, and would be difficult to determine peak dir., but might be tolerable if the duration was short.
- Alternative 5 would take a long time, and still result in a inferior product.
- Alternative 6 was close in value to the original, but would have higher delays, and was not preferred by maintenance.
slide 12
Road User Costs/Delay
| Scenario | Demand Reduction | 1,500 vphpl* capacity Queue (Miles) |
1,500 vphpl* capacity Delay (Minutes) |
1,500 vphpl* capacity RUC** $(Millions) |
1,700 vphpl* capacity Queue (Mile ) |
1,700 vphpl* capacity Delay (Minute ) | 1,700 vphpl* capacity RUC** $(Millions) |
|---|---|---|---|---|---|---|---|
| 1 – Original | 20% | 8 | 61 | 20 | 2 | 18 | 2 |
| 1 – Original | 30% | 2 | 16 | 3 | 0 | 0 | 0 |
| 3 – 55-hour Weekend | 30% | 51 | 363 | 119 | 34 | 210 | 63 |
| 3 – 55-hour Weekend | 40% | 25 | 179 | 45 | 13 | 81 | 17 |
| 4 – Progressive Continuous | 30% | 51 | 363 | 123 | 34 | 210 | 51 |
| 4 – Progressive Continuous | 40% | 25 | 179 | 47 | 13 | 81 | 13 |
| 5 – 8-hour Nighttime | 5% | 8 | 57 | 418 | - | - | - |
| 5 – 8-hour Nighttime | 10% | 3 | 22 | 133 | - | - | - |
| 06/01 – CSOL (Weekend) | 30% | 51 | 363 | 69 | 34 | 210 | 36 |
| 06/01 – CSOL (Weekend) | 40% | 25 | 179 | 25 | 13 | 81 | 10 |
| 06/02 – 2CSOL (Nighttime) | 5% | 8 | 57 | 120 | - | - | - |
| 06/02 – 2CSOL (Nighttime) | 10% | 3 | 22 | 38 | - | - | - |
| * vphpl: vehicle per hour per lane ** RUC: Road User Cost |
|||||||
![]()
slide notes
- Note that this was done in a spreadsheet that formed the basis of the module in CA4PRS. It was not a part of CA4PRS when we did our analysis.
- On at least one weekend, our vphpl approached 2000.
- Actual delay was generally between 10-15 minutes during peak hours.
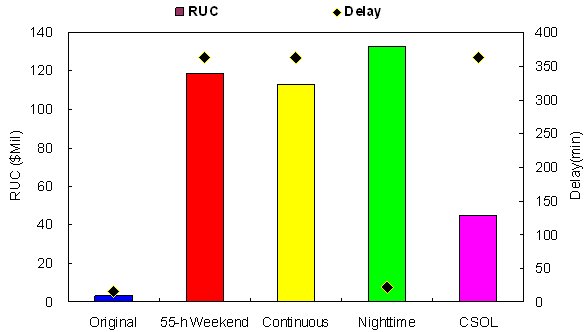
slide 13
Road User Costs/Delay
![]()
slide notes
None.
slide 14
Stage Analysis (Sample)
| Stage | Station Start | Station End | No. of Lanes | Length (m) |
Length (lane-km) | Rehab Type | Total (lane-km) |
55-hour Closures Estimate |
|---|---|---|---|---|---|---|---|---|
| 4B, 4C | 836+81 | 837+81 | 1 | 100 | 0.1 | CLR | 2.5 | 2 |
| 4B, 4C | SB I-15 Conn WB SR-60 | SB I-15 Conn WB SR-60 | 2 | 773.2 | 1.546 | CLR | 2.5 | 2 |
| 4B, 4C | SB I-15 Conn EB SR-60 | SB I-15 Conn EB SR-60 | 2 | 1430.5 | 0.858 | RSR | 2.5 | 2 |
| 2A | 7+40 | 11+79 | 2 | 439 | 0.878 | CLR | 1.28 | 1 |
| 2A | Jurupa On-ramp SB I-15 | Jurupa On-ramp SB I-15 | 2 | 500 | 0.4 | ACR | 1.28 | 1 |
| 2B | 20+90 | 22+77 | 2 | 187 | 0.374 | CLR | 3.01 | 3 |
| 2B | 22+77 | 28+51 | 1 | 574 | 0.574 | CLR | 3.01 | 3 |
| 2B | 28+51 | 33+03 | 2 | 452 | 0.904 | CLR | 3.01 | 3 |
| 2B | 20+96 | 28+95 | 1 | 799 | 0.24 | RSR | 3.01 | 3 |
| 2B | WB I-10 CONN SB I-15 | WB I-10 CONN SB I-15 | 1 | 337.7 | 0.338 | CLR | 3.01 | 3 |
| 2B | SB I-15 Jurupa Off-ramp | SB I-15 Jurupa Off-ramp | 2 | 500 | 0.4 | ACR | 3.01 | 3 |
| 2B | WB I-10 Conn SB I-15 | WB I-10 Conn SB I-15 | 2 | 300 | 0.18 | RSR | 3.01 | 3 |
| Note: CLR=Continuous Lane Reconstruction; RSR=Random Slab Replacement; ACR=Asphalt Concrete Rehabilitation | ||||||||
![]()
slide notes
This is a more detailed analysis of the original alternative. Used to determine:
- Incentive/Disincentive
- Number of weekends needed (min/max)
- Working Days
- Controlling operations
- Good check to make sure our staging works, and that the Contractor has sufficient access.
slide 15
Traffic Study (Dynameq)
| Closure | Study 1 Delay (min) | Study 2 Delay (min) |
|---|---|---|
| WB10-SB15 | 5.5 | 8.4 |
| EB10-SB15 | 4.1 | 7.7 |
| SB15-WB10 | 4.5 | 72.6 |
| NB15-E/W10 | 5.8 | 58.6 |
| EB10-NB15 | 5.8 | 8 |
| Reduce SB 15 | 3 | |
| SB15-E/W60 | 121.4 |
![]()
slide notes
- Contracted 2 traffic studies for this project. The second evaluated the first.
- Studies looked at 6 closures
- Variables hard to predict: Diversion, detour usage (especially in urban area), effects of economy, user learning
- Reduce SB 15 will not be done.
- WB10-SB15 – Actual, closed EB-SB as well. Detour? Delay < 10 min
- EB10-SB15 – See previous.
- SB15-WB10 – Closed SB-EB at the same time, and 4th St onramp. Delay < 10 min. Detour at Jurupa?
- NB15-E/W10 – Have not done yet.
- SB15-E/W60 – Delay < 10 minutes for at least 2 out of 3 of the closures. 1 closure with delays a bit longer, but still under 30 minutes.
slide 16
Schedule
- NTP with CA4PRS study: May 2005
- 30% PS&E: February 2006
- Draft CA4PRS Report: March 2006
- CA4PRS study: October 2006
- 60% PS&E: January 2007
- Advertise: September 2008
- Award: January 2009
- Construction Begins: April 2009
- Anticipated Completion: December 2010
![]()
slide notes
None.
slide 17
VALIDATION OF RESULTS
![]()
slide notes
- We have finished all of the weekend closures.
- About 18 closures used, so the Contractor got the full incentive.
- As is often the case, the Contractor changed many things in the construction staging, and was very aggressive in pursuing the incentive.
- We also experienced lower traffic delays than anticipated, we believe in part due to the economy, and in part due to our public awareness efforts.
slide 18
Screenshots
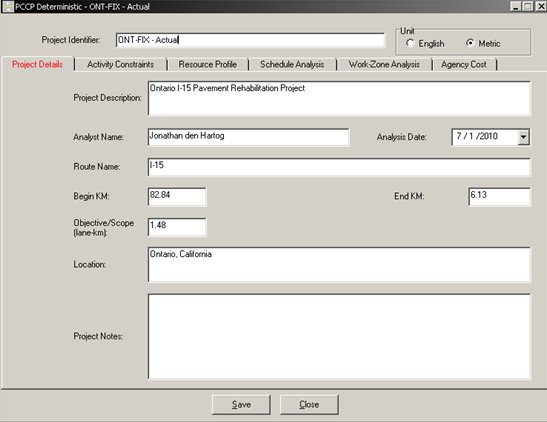
![]()
slide notes
- Objective/Scope is changed for each closure.
slide 19
Screenshots
![]()
slide notes
None.
slide 20
Screenshots
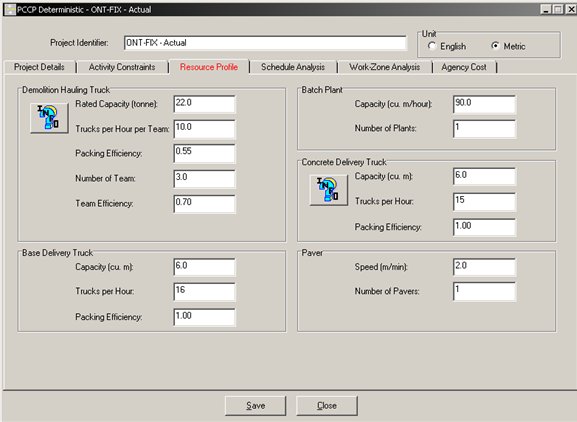
![]()
slide notes
- Couple times they had two pavers out there, but I don't believe they ever operated them simultaneously, due to lack of crews.
slide 21
Screenshots
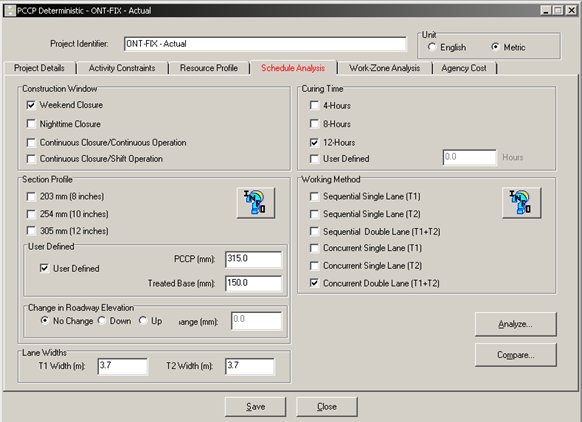
![]()
slide notes
- Note the user-defined section. Need to define the base more, since it was placed in two lifts.
- Set concurrent double lane/single lane as needed. May need to do portions of a stage separately.
- Sometimes our outside lane width was 2 feet wider.
slide 22
Screenshots
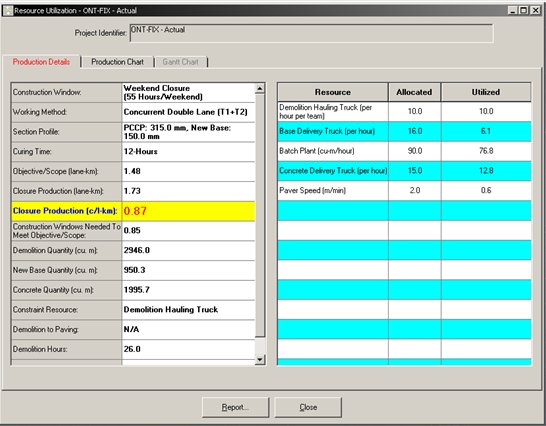
![]()
slide notes
- Note the constraint resource.
slide 23
Inputs: Predicted Vs. Actual
| Tab | Input | Study | Actual | Unit | Notes | Default Values |
|---|---|---|---|---|---|---|
| Activity Constraints† | Mobilization | 3 | 1 | hrs | 2-3 | |
| Activity Constraints † | Demobilization | 2 | Varies | hrs | 4-6 | |
| Activity Constraints† | Concurrent - Demo to Base | 15 | 11 | hrs | 1-2 (Sequential), 9-11 (Concurrent) | |
| Activity Constraints† | Concurrent - Base to PCC | 8 | 5 | hrs | 1-2 (Sequential), 9-11 (Concurrent) | |
| Resource Profile | Demo Hauling Truck | 22 | 22 | tonne | 22 | |
| Resource Profile* | Demo Trucks per hour per team | 10 | 10 | ea | 10 for cut & lift, 12 for impact methods | |
| Resource Profile*† | Demo Packing Efficiency | 0.5 | 0.55 | % | Used impact method instead of cut & lift | 0.5 for cut & lift, 0.6 for impact |
| Resource Profile† | Demo Number of Teams | 2 | 3 | ea | BIG IMPACT! | 2 |
| Resource Profile* | Demo Team Efficiency | 0.7 | 0.7 | % | ||
| Resource Profile†† | Base Delivery Truck Cap. | 10 | 6 | m3 | Used end dumps instead of bottom dumps | 10 for buttom dump, 6 for end dump |
| Resource Profile† | Base Trucks Per Hour | 8 | 16 | ea | 10 | |
| Resource Profile | Base Truck Packing Eff. | 100 | 100 | % | ||
| Resource Profile* | Batch Plant Capacity | 90 | 90 | m3/hr | 100 | |
| Resource Profile | Concrete Delivery Truck Cap. | 6 | 6 | m3 | 6-7 | |
| Resource Profile | Concrete Trucks Per Hour | 15 | 15 | ea | 15 | |
| Resource Profile | Concrete Truck Packing Eff. | 100 | 100 | % | ||
| Resource Profile* | Paver Speed | 2 | 2 | m/min | 2 | |
| Resource Profile | Number of Pavers | 1 | 1 | ea | Sometimes double-lane width | |
| Schedule Analysis †† | PCC Thickness | 290 | 315 | mm | 345 mm for mainline lanes (315 for connectors) | |
| Schedule Analysis | Base Thickness | 152.4 | 150 | mm | ||
| * Unable to verify actual value in field †Difference speeds up actual production ††Difference slows down actual production |
||||||
![]()
slide notes
- Explain the table headings
- Got this input from talking to construction inspectors, and reviewing the inspector diaries.
- Haven't been able to verify every actual input (marked with an asterisk), but we have gotten most of the critical ones.
- Define orange vs. blue highlighting
- Contractor has really understood that the demolition operation is often the critical operation.
- The two slow downs have minimal impact (only minor slow down)
- Show defaults. Note that at the time of analysis, defaults were not included with the program.
slide 24
Predicted Vs. Actual
- Random slabs as night work
- Sometimes paving two lanes wide on connectors
- Combined stages
- Concurrent vs. Sequential
![]()
slide notes
- Demo efficiency was validated by how the contractor performed the Super-Slab work: Fort Miller stated that they have seen very few contractors as efficient as this one on the demo operation.
slide 25
Predicted Vs. Actual (PRELIMINARY)
| Stage Plan1 | Stage Study1 | Stage Description | No. of Weekends Study2 | No. of Weekends Actual2 | No. of Weekends Revised Inputs3 | Notes |
|---|---|---|---|---|---|---|
| 4B,C | 5B,C | SB I-15 connectors to E/W SR-60 | 2 | 2 | Contractor was restricted by width of connector, which forced him to pave one lane at a time. Only 2 demo teams used. Thus very similar to study | |
| 2B,C | 2B,C | SB Jurupa offramp, W10-S15 conn, E10-S15 conn | 4 | 2 | 2 | Study had separate closures for 2B, 2C. Contractor chose to combine stages. |
| 2D,E | 2D,E | SB I-15 connectors to E/W I-10 | 5 | 2 | 2 | Contractor may have included more in 2E,F combination, also need to determine how contractor handled 3-lane widths |
| 2E,F | 2E,F | Fourth St SB ramps | 3 | 1 | 1 | Added 2E work north of S15-E10 connector diverge |
Footnotes (Column descriptions): 1"Plan" is the stage designation as it is called out on the project plans. "Study" is the stage designation as it is called out in the design study. Differences exist because of changes that occurred between when the study was completed and the project design was finished. 2"Study" is the number of closures (weekends) estimated to be needed by the design study to complete the work for the stage. "Actual" is the number of closures actually required to complete the work. 3"Revised Inputs" indicates how many closures were estimated to be needed using the revised inputs for CA4PRS shown in the previous slide. |
||||||
![]()
slide notes
- Read footnotes later.
- This is PRELIMINARY. Used stages that required more than 1 closure.
- Explain: This was create merely by running the revised inputs on the same lane-kilometer objective.
- On the first line, Contractor was restricted by the location to work in a manner very similar to what the study had predicted.
- Second line, the Contractor combined stages, but the study had them separately.
- Third line needs more work to determine why the Contractor was able to perform the work in 2 closures. This highlights the challenge of analyzing this type of work. Contractor significantly revised/combined stages to make work more efficient for his crews.
slide 26
Time Spent
- Pre-Construction Study:
- ~160 hours
- Validation of Results:
- ~40 hours
![]()
slide notes
- Time consuming part is data collection and deciding how the contractor will perform the work.
- In validation, these things are know already (and hopefully your CA4PRS file is already set up), so validation occurs much more quickly.
- More to be done on validation.
slide 27
Lessons Learned
- Construction experience is IMPORTANT
- Design input important for efficiency
- Breadth of knowledge required
- Traffic
- Pavement
- Construction
- Estimating
- Team approach may be best
![]()
slide notes
- A team approach may be best, maybe even a dedicated team.
- D8 is considering a team that would also do things like LCCA, estimate verification, etc.
- Interested to hear suggestions from others with experience with the software.
slide 28
For Further Study
- More detailed field validation.
- How much did the economy effect traffic volumes, allowing the combined closures?
- What kind of traffic diversion did we get?
- Document experience with precast pavement (Super-Slab) to validate precast module.
![]()
slide notes
None.
slide 29
Contact Info
Jonathan den Hartog
(909) 383-5998
jdenhart@dot.ca.gov
More info:
http://www.dot.ca.gov/hq/research/roadway/ca4prs/index.htm
https://www.fhwa.dot.gov/research/deployment/ca4prs.cfm
![]()
slide notes
None.