Work Zone Safety Data Flyer 2017
Printable version [PDF 149KB]
You may need the Adobe® Reader® to view the PDFs on this page.
Contact Information: Work Zone Feedback at WorkZoneFeedback@dot.gov
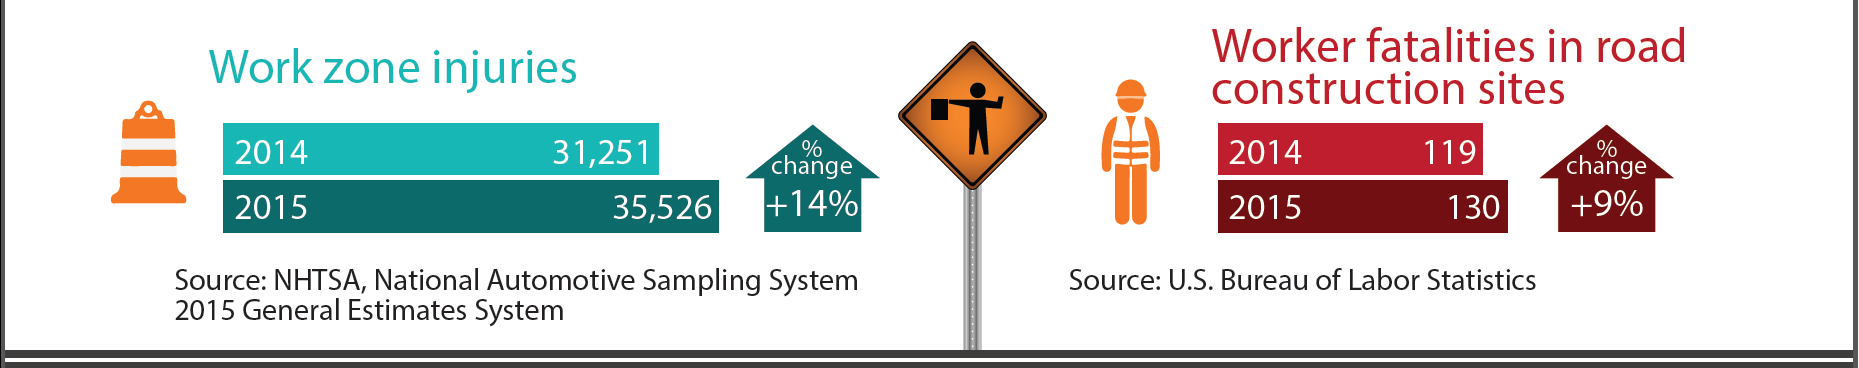
Work Zone Safety Data

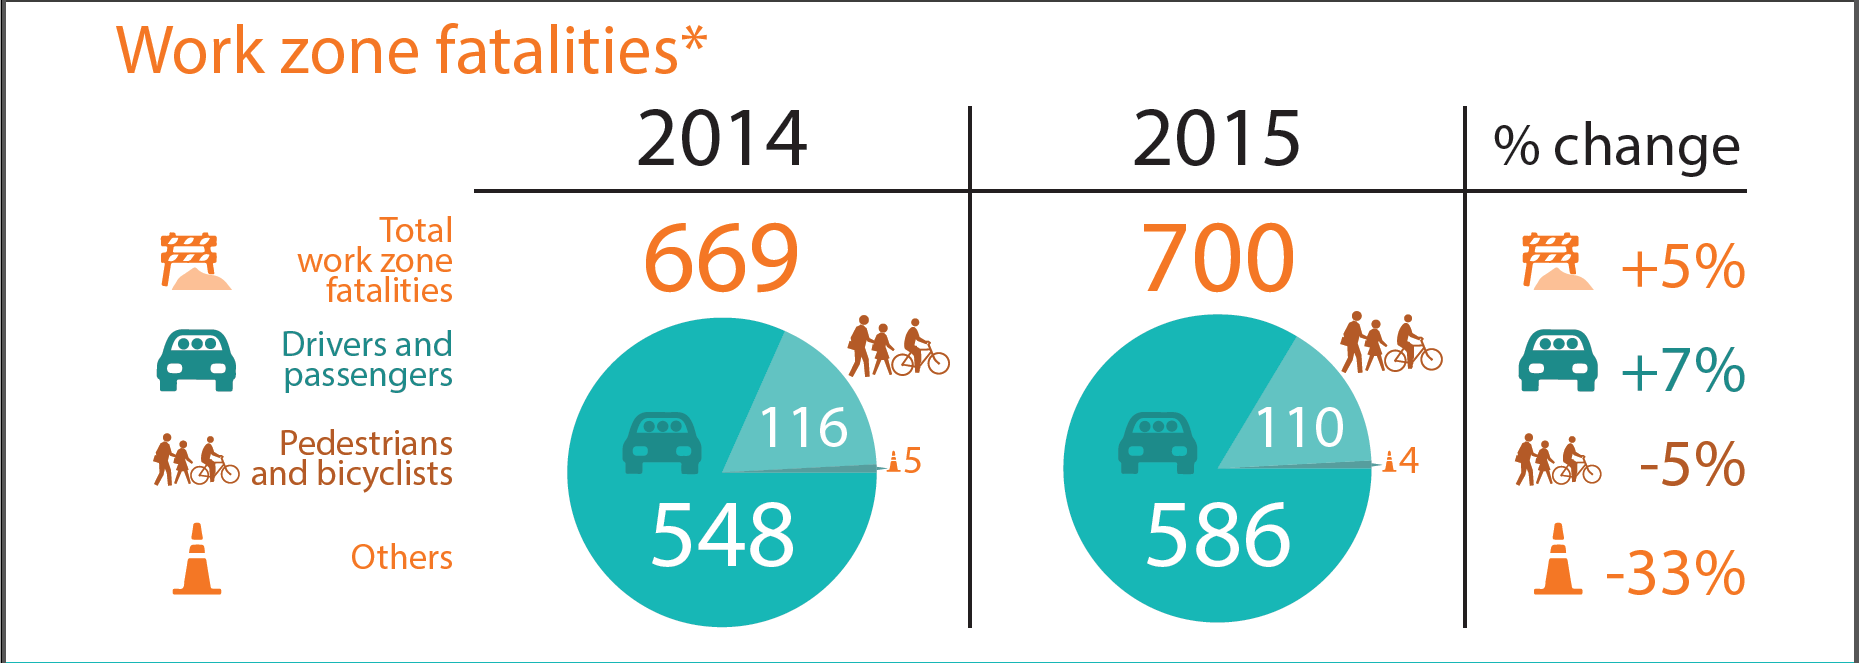


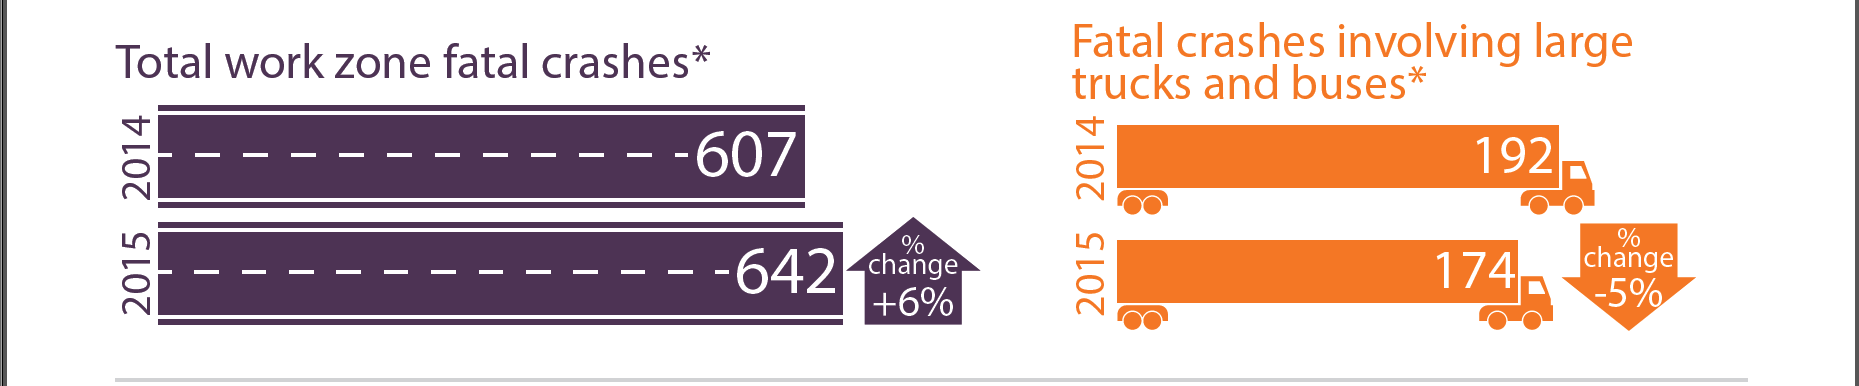
| *Source: 2014 Analysis Reporting Final (FARS) and FARS 2015 Annual Report File, National Highway Traffic Safety Administration | March 2017 |