Introduction
State Departments of Transportation (DOTs) often apply technology in the form of Intelligent Transportation Systems (ITS) to monitor and manage traffic flow, especially in major urban areas. With the active, dynamic nature of work zones, permanent systems can play an often limited role in managing traffic during construction and maintenance activities. While video monitoring from permanent cameras can be beneficial for managing work zones, real-time data is hindered by detection issues such as lane shifts and traffic shifts.
In the recent past, some owner-agencies across the nation have deployed portable ITS technologies to monitor traffic and manage mobility and safety during construction. Portable systems provide a solution for deployment, maintenance, operation, and remobilization of monitoring systems, especially since the roadway characteristics often change dramatically during construction. Most of these systems take the form of mobile traffic monitoring and management through the use of portable sensors to collect traffic data, along with integrated portable changeable message signs (PCMS) to display speed and/or delay information in real-time. Agencies also often integrate a website into the overall system to provide motorists with pre-trip information to allow for better trip planning. A few agencies have also used portable ITS to help manage merging behavior approaching work zone lane closures.
With an increasing presence of construction and maintenance work zones and increased use of portable work zone ITS applications to manage them, the need arises to evaluate the effectiveness of different applications and quantify the benefits of their use. Some states, including Arkansas, Michigan, Minnesota, Iowa, Kansas, Missouri, North Carolina, Wisconsin, and Nebraska, along with local Universities and consultants, have evaluated a limited number of previous deployments to assess benefits and improve system designs. This study was intended to increase the body of knowledge regarding the effects of deploying work zone ITS so that practitioners have additional information to draw from in designing and deploying ITS in work zones.
While many sites were considered, five were chosen based on multiple factors including:
- Estimated certainty of deployment and construction schedules.
- Clarity of the purpose/goals for using the system and ability to measure them.
- Diversity in type of system.
- Likelihood of system activation (e.g., volume/capacity or level of congestion).
- Local participation.
- Ease of gathering information and data for evaluation.
While these factors were ultimately the most important, the study team applied a detailed list of site selection criteria in choosing the sites. Figure 1 highlights the locations of the selected sites and the type of system studied at each site.
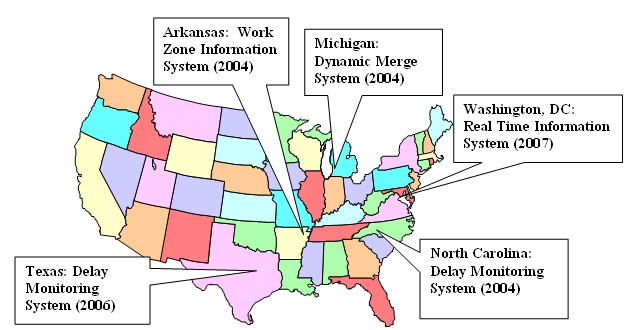
Figure 1. Work Zone ITS Evaluation Sites
Through research prior to and early in the project, the state of the practice appeared to be the use of tested, proven, "off the shelf" work zone ITS systems. However, some of the systems of focus for this study resembled that of a pilot test that, when combined with data issues, made quantification of benefits difficult. Therefore, one of the evaluation goals included for each site was also to verify that the system functioned as designed.
The types of measures that could be used to test performance of the system were also an important consideration as they related to the overall deployment goals. The study team developed a detailed list of hypotheses, associated measures of effectiveness, and relevant data sources. Table 1 highlights some examples of the key hypotheses and measures used at one or more of the study sites.
| Hypothesis | MOE(s) | Data Sources |
|---|---|---|
| The ITS system will provide accurate, timely, and reliable information. | Correlation between work zone conditions and actual message posted on electronic signs. | System logs, project engineer records, interviews. |
| The use of ITS in work zones will divert travelers to alternate routes during times of work zone congestion. | Traffic counts on mainline and alternate routes. | System data, continuous count station data, evaluation-specific devices. |
| The use of ITS in work zones will reduce traveler delay. | Work zone travel times, average vehicle speed, work zone throughput, queue lengths. | Direct observations, system data, travel time runs. |
| The use of ITS in work zones will reduce congestion. | Travel times, queue lengths. | Direct observations, system data, evaluation-specific devices, continuous count station data. |
| The use of ITS in work zones will enhance the safety performance of the highway. | Crashes, incidents, crash frequency and severity (with and without ITS), aggressive maneuvers, citations. | Crash data, work zone inspector diaries, direct observations, citation logs. |
The study team considered additional measures as needed to support each site. The study team applied these measures to the respective sites and analyzed the deployment to quantify the benefits and uncover important lessons learned.
The following sections discuss each of the evaluation sites, highlighting the site characteristics, type of system deployed, and results from each study site. The sites are presented in reverse chronological order with the most recent site first.
Previous | Next