2. Overview of Results
This section presents an overview of the combined results for the 52 Divisions/States that provided responses to the 2012 WZ SA. Results from the 2011 WZ SA are also included for comparison. Table 1 shows the 2012 overall average rating and average ratings for each of the six sections in the WZ SA in comparison to the 2011 results.
| Section | # of Questions | 2011 | 2012 | Change1 | Percent Change |
|---|---|---|---|---|---|
| 1. Leadership and Policy | 10 | 10.0 | 10.3 | 0.2 | 2% |
| 2. Project Planning and Programming | 6 | 8.9 | 9.3 | 0.2 | 4% |
| 3. Project Design | 12 | 10.5 | 10.9 | 0.3 | 4% |
| 4. Project Construction and Operation | 9 | 10.8 | 11.1 | 0.3 | 2% |
| 5. Communications and Education | 5 | 12.6 | 12.8 | 0.2 | 3% |
| 6. Program Evaluation | 4 | 7.5 | 7.7 | 0.3 | 3% |
| Overall | 46 | 10.0 | 10.6 | 0.3 | 3% |
Noteworthy Findings by Section
The highest average ratings were for Section 5 (Communications and Education), followed by Section 4 (Project Construction and Operation) and Section 3 (Project Design). The lowest average rating was assigned to Section 6 (Program Evaluation). This is consistent with the results from previous years.
Each section experienced a slight increase in average rating from 2011 to 2012. Section 2 (Project Planning and Programming) and Section 3 (Project Design) had the highest average rating increase (4 percent for each section). The section that has the greatest increase generally changes from year to year.
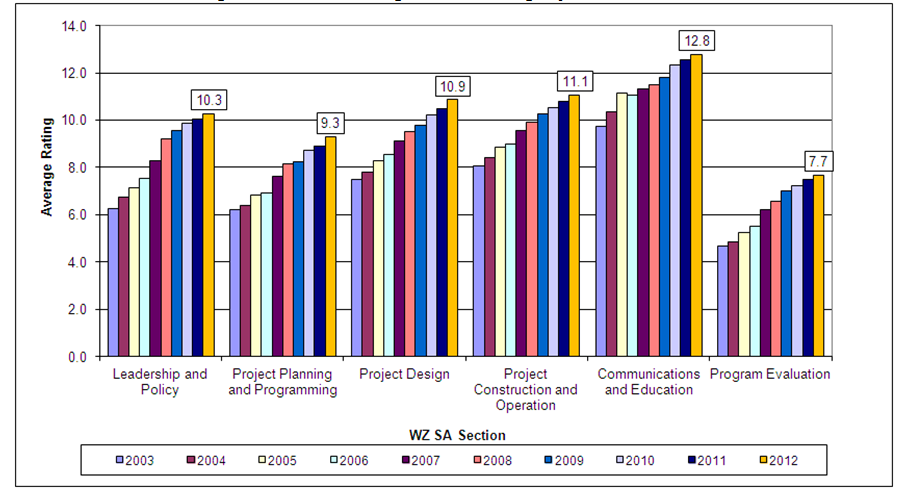
The National average ratings for all six sections have consistently increased since the inception of the WZ SA, with the level of increase varying from section to section as shown in Figure 1. Since 2009, the average rating for every section has been at or above the implementation threshold of seven – meaning that on average across the country, agencies are implementing the practices in all six sections of the assessment. Four of the six sections now have average ratings that show agencies are assessing their performance (rating of 10-12),2 with Section 2 (Project Planning and Programming) approaching this range as well. As agencies have continued to enhance their work zone policies and practices, the average ratings have reached a level to where increases are more gradual.
Figure 1. National Average Section Ratings by Year: 2003 to 2012
Noteworthy Findings by Question
Key findings by question:
- Highest Rated Question: 4.5.4 During
type I, II, and III project construction, does the
agency use a public information plan that provides
specific and timely project information to the traveling
public through a variety of outreach techniques
(e.g., agency Web site, newsletters, public meetings,
radio, and other media outlets)?
- The average rating for this question was 13.8, and increase from 13.6 in 2011.
- This question has consistently had one of the highest ratings of any question in the WZ SA.
- All 52 agencies use public information plans that provide specific and timely project information to the traveling public. The use of public information plans is a well-established and assessed practice in many agencies.
The questions with the largest percent increases in rating between 2011 and 2012 are:
- 8% Increase: 4.2.4 Does the agency's
transportation planning process include a planning
cost estimate review for project types I, II, and
III that accounts for traffic management costs (e.g.,
incident management, public information campaigns,
positive separation elements, uniformed law enforcement,
and intelligent transportation systems [ITS])?
- The 8 percent rating increase (from 9.0 to 9.7) was due to increases by 20 agencies.
- Ratings for 3 agencies increased above 7, meaning they are now implementing this practice.
- The Temporary Traffic Control Devices Rule (Subpart K) established additional requirements for consideration of some of the example practices listed in this question and may help explain the large increase in average rating.
- 7% Increase: 4.3.7 Does the agency have
a process to evaluate the appropriate use of ITS
technologies to minimize congestion in and around
work zones for type I, II, and III projects?
- The 7 percent rating increase (from 9.1 to 9.7) resulted from increases by 14 agencies.
- 45 agencies (87 percent) have a process to consider ITS use in work zones.
- The range of agency use varies greatly. Several agencies noted use of ITS, especially on significant projects, in metropolitan areas and on interstates.
- 7% Increase: 4.3.11 When developing the
Traffic Control Plan for a project, does the agency
involve contractors on type I and II projects?
- The 7 percent rating increase (from 7.8 to 8.4) was due to increases by 15 agencies.
- Ratings for 2 agencies increased to 7, meaning they are now implementing this practice. The increases for both agencies were large (from 0 to 7, from 1 to 7).
- Overall, 34 agencies (65 percent) are involving contractors on type I and II projects when developing the Traffic Control Plan.
Three questions had the lowest average rating (6.9):
- 4.1.10 Has the agency established formal
agreements, such as Memoranda of Understanding (MOU),
with utility suppliers to promote the proactive
coordination of long-range transportation plans
with long-range utility plans, with the goal of
reducing project delays and minimizing the number
of work zones on the highway?
- While this question has consistently been rated low, the average rating increased from 6.7 in 2011 to 6.9 in 2012.
- Slightly more than half (27) of agencies indicate that they are implementing this practice, an increase of one agency from 2011.
- Coordination with utility suppliers tends to be an informal process as opposed to the formal agreement such as an MOU.
- FHWA has made this an area of focus. TMP resources and training promote project coordination, a webinar was held in 2012, and a state-or-the-practice review is planned for 2013 to promote greater coordination to reduce project delays and impacts to traffic.
- 4.6.1 Does the agency collect data to
track work zone congestion and delay performance
in accordance with agency-established measures?
- While the average rating increased from 6.6 in 2011 to 6.9 in 2012, this question has consistently been at or near the lowest rated of all questions.
- More than half (28) of all agencies indicate they are implementing this practice (an increase of two agencies from 2011).
- Both knowledge and resources have constrained implementation of work zone congestion and delay data collection. In 2011, FHWA published a primer and a research report and held a webinar on work zone performance monitoring to help advance knowledge on establishing measures and collecting data to assess the measures. FHWA follow-on efforts are underway, including an online training module that outlines how to develop and use work zone performance measures.
- 4.6.3 Does the agency conduct customer
surveys to evaluate work zone traffic management
practices and policies on a statewide/area-wide
basis?
- The average rating for this question increased from 6.6 in 2011 to 6.9 in 2012.
- Slightly more than half (27) of agencies indicated they are implementing customer surveys to evaluate work zone traffic management practices and policies on a statewide/area-wide basis (an increase of one agency from 2011).
The average rating for four questions remained the same from 2011 to 2012 (4.1.5, 4.1.6, 4.4.7, and 4.5.3). The question about the use of a work zone Web site to provide traveler information (4.5.1) showed a slight decrease (from 13.2 to 13.1), and is the only question that decreased.
The changes in ratings for any WZ SA question may be due to a combination of reasons. Factors that may contribute to changes in rating include enhancements to State practices, changes in the process for completing the WZ SA (enhanced stakeholder input, greater attention to agency process change relative to WZ SA topics, changes in personnel), FHWA technical support to agencies, further implementation of the Work Zone Rule or other recommended practices, or re-baselining of practices. Question-specific factors for rating changes are provided in Section 4.
Noteworthy Findings by Agency
Most agencies increased their overall WZ SA rating between 2011 and 2012. Table 2 shows the changes in average agency ratings. The rating increased for 43 agencies (83 percent), decreased for 6 agencies (12 percent), and remained the same for 3 agencies (6 percent). These percentages are similar to the changes from 2010 to 2011.
| Score Change | Agencies | Percent of Agencies |
|---|---|---|
| Increased by more than 10% | 3 | 6% |
| Increased 6% to 10% | 7 | 13% |
| Increased 1% to 5% | 33 | 63% |
| No Change | 3 | 6% |
| Decreased by less than 5% | 5 | 10% |
| Decreased by 5% or more | 1 | 2% |
| Total | 52 | 100% |
The largest percentage increase in average weighted score for an agency was 37 percent (followed by 16 percent and 11 percent), while the largest percentage decrease in average weighted score was 8 percent.
Work Zone Process Reviews: Responses to the supplemental question show that the majority of agencies (43) have conducted a comprehensive work zone process review in the last two years in accordance with 23 CFR 630 Subpart J, with many completed in 2012. Of the nine agencies not completing reviews during this time, five completed reviews during the few years prior. FHWA is following up with those agencies that have not completed reviews in a timely manner.
1 Numbers in this table and other tables in this report may not calculate exactly due to rounding. Non-rounded values were used in these and other calculations throughout this report. [ Return to note 1. ]
2 See Appendix A for a description of the scoring for the WZ SA. [ Return to note 2. ]