1.0 Define the CORSIM Study
CORSIM simulation can provide a wealth of information; however, it can also be a very time-consuming and resource-intensive effort. It is critical that the manager effectively coordinate the effort to ensure a cost-effective outcome to the study. An effective management plan defines the objectives, scope, approach, tools, resources, and time schedule for the study. This chapter presents the key components of an overall management plan for achieving a cost-effective CORSIM simulation analysis.
1.1 Study Purpose and Objectives
The purpose of the project analysis can be described as the overall view of the project summarized in one or two sentences. The purpose should quickly convey who, what, where, when, and why a study is being conducted. For example, “IDOT is conducting a traffic alternatives analysis of the I-35 corridor in Des Moines from the Main Street interchange to the State Street interchange over the next six months to optimize vehicle/passenger throughput, minimize queues at and adjacent to the interchange ramps, and minimize travel time through the corridor.” The study purpose should be agreed to by all study participants and decision makers.
Once the purpose is established, multiple objectives can be determined, which flow out of and support the purpose. Before embarking on any major analytical effort, it is wise to assess exactly what it is the analyst, manager, and decision makers hope to accomplish. Study objectives should answer the following questions in detail:
- Why is the analysis needed?
- What questions should the analysis answer?
- What alternatives will be analyzed?
- What are the performance requirements? (For example; minimize commute congestion, minimize queue on ramps, provide for stable flow on mainline, maximize progression, minimize intersection delay, provide reliable commute, etc.)
- Who are the intended recipients/decision makers for the results?
Try to avoid broad, all-encompassing study objectives. They are difficult to achieve with the limited resources normally available, and they do not help focus the analysis on the top-priority needs. Provide as much detail to the project objectives as can be agreed upon by all stakeholders involved in the project. An example of specific objectives relating to performance requirements could state that the selected alternative should:
- Provide for minimum average freeway speeds of 75 kilometers/hour (km/h) (47 miles/hour (mi/h)) throughout the peak period between Points A and B.
- Provide for ramp operations which do not generate queues or spillback which impact operations on the freeway or major crossroad.
- Arterial operations within 4.0 km (2.5 mi) of freeway interchanges maintain an average speed of 55 km/h (34 mi/h) and arterial intersections do not result in phase failure or queue spillback into adjacent intersections.
Determining these objectives could be established with an understanding of existing conditions and preliminary assessments of future no-build conditions. When establishing these objectives, the analyst should be aware that looking up Highway Capacity Manual (HCM)(3) levels of service using MOEs produced by a different analytical method (including CORSIM) is not appropriate, and is prone to bias and error. Additional information regarding this is contained in the Traffic Analysis Toolbox Volume 6 (Definition, Interpretation, and Calculation of Traffic Analysis Tools MOEs).
Besides stating specific projects objectives, a great deal of study resources can be saved if the manager and the analyst can identify upfront what WILL NOT be achieved by the analysis. The objectives for the analysis should be realistic, recognizing the resources and time that may be available for their achievement.
Identifying the study objectives also reduces scope creep where more and more objectives are added to the study as it progresses. This can get very expensive if not controlled from the beginning.
1.2 Study Scope
Once the study objectives have been identified, the next step is to identify the scope, or breadth, of the analysis. Several questions related to the required scope of the analysis should be answered at this time:
- What are the characteristics of the project being analyzed? How large and complex is it?
- What are the alternatives to be analyzed? How many of them are there? How large and complex are they?
- How will the alternatives change the flow patterns (e.g., inserting a freeway interchange between two existing interchanges will alter the turning percentages at existing interchanges)? This should be considered at the onset of the project.
- What measures of effectiveness (MOEs) or set of MOEs will be required to evaluate the alternatives and how can they be measured in the field?
- What resources are available for the analysis? How many analysts can be used? How much time is available to conduct the study? Are there any externally defined project milestones such as a presentation to decision makers?
- How is congestion defined in the context of this study?
- What are the probable geographic and temporal scopes of the impact of the project and its alternatives (now and in the future)? How far and for how many hours does the congestion extend? The geographic and temporal boundaries selected for the analysis should encompass all of the expected congestion to provide a valid and consistent basis for comparing alternatives.
- What is the appropriate design year for evaluating alternatives?
- Will a sensitivity analysis be incorporated into the study to provide insights to the effects of minor and modest changes in the travel demand forecasts and assumptions?
- Will the impact of different alternatives be very similar or very different from each other? How disaggregate an analysis is required? Is the analysis likely to produce a set of alternatives where the decision makers must choose between varying levels of congestion (as opposed to a situation where one or more alternatives eliminate congestion, while others do not)?
- What type of information should be provided to the decision makers, and how will that information be conveyed?
- What degree of precision do the decision makers require? Is a ten percent error tolerable? Are hourly averages satisfactory?
- Will the presentation of benefits and impacts, based on a geographic or multi-hour time period provide a new perspective or insight to the decision making process?
How to best develop the logical terminus of an improvement project has been debated since the early days of microsimulation; in the end, it is a matter of balancing study objectives and study resources. Therefore, the modeler needs to understand the operation of the improvement project to develop logical termini. The study termini will be dependent on the “zone of influence,” and the project manager will probably make that determination in consultation with the project stakeholders. Once that has been completed, the modeler then needs to look at the operation of the proposed facility. When determining the zone of influence, the modeler needs to understand the operational characteristics of the facility in the proposed project. This could be one intersection beyond the project terminus at one end of the project or a major generator 3.2 km (2 mi) away from the other end of the project. Therefore, there is no specific geographical guidance that can be given. However, some general guidelines can be summarized in the following text.
1.2.1 Freeway Projects
The geographical scope of a freeway project must take into account significant sources of traffic upstream and bottlenecks downstream of the project area. At the very least, a two lane facility should extend up to 2.4 km (1.5 mi) from both termini of the improvement or study area being evaluated and up to 1.6 km (1 mi) on either side of the freeway. This will allow for sufficient temporal and spatial scope for CORSIM to better represent the traffic-stream characteristics reflected in the real-world through the study area.
Levels of congestion and number of lanes may also require the distances upstream and downstream to be extended. In heavily congested areas, CORSIM requires more distance to establish the traffic stream. CORSIM also does not preposition vehicles on the entry link based on downstream turn movements. The vehicles must have enough time and distance to make the required lane changes to position themselves for the upcoming turn movement.
In addition, CORSIM has inputs for freeway entry lane distribution percentages. This allows the analyst to model the lane volume distribution due to an on-ramp just upstream of the project boundaries. Even though a higher percentage of vehicles are placed in the right lanes of an entry point they may not exit at the next right side exit ramp.
1.2.2 Arterial Projects
The arterial portion of a model network should extend at least one intersection beyond those within the boundaries of the improvement or study area. The network may need to be expanded depending on the interaction due to adjacent intersections or corridors. The network should be sized to capture influences such as the upstream metering of traffic due to traffic signals and the downstream queuing of traffic.
The analyst should consider the potential impact on arterial coordination as warranted. Signal timing studies may need to be expanded to include other signalized intersections that produce platooned arrivals at the arterial being studied.
1.2.3 Combined Network Project Corridor)
One of CORSIM’s strengths is the ability to model the operation of a corridor network. To gain the most benefit from CORSIM when analyzing corridor type networks, the analyst should include elements of both surface streets and freeways.
The network should be sized to capture influences such as the upstream metering of traffic and the downstream queuing of traffic. Modeling a freeway off-ramp without the traffic signal at the interchange will not represent a queue that may be generated by that signal. Likewise, modeling a freeway on-ramp without the traffic signal at the interchange will not represent platooned arrivals onto the freeway that are generated by that traffic signal.
1.2.4 Temporal Scope
The length of the modeling period relates to the location of the project and the type of congestion that is experienced. Congestion levels can often extend beyond a one-hour peak. The modeling period should be long enough to capture the build-up of congestion, the entire length of the congestion, and the dissipation of the congestion. This could take two to three hours or more in heavily congested areas. Within the longer time periods, traffic flow rates should be adjusted every 15 minutes to reflect the dynamic nature of traffic flow, such as the build up to congestion and the recovery afterwards. In rural areas, peak traffic conditions could be less than one hour; in these cases, a single peak hour may be modeled.(2)
An example of selecting a peak period for analysis based on traffic volumes and average speeds, as well as differentiating between the peak hour and peak period, is shown graphically in Figure 2.

Figure 2. Chart. Selecting a peak period for analysis.
The time frame for the build-up of volume should be chosen carefully. Very large networks may have significant travel time from the entry points to the exit points. If the initialization process (discussed in appendix C) is not taken into account properly, the internal roadways of a large network may have more or less congestion than is experienced in the real-world. For a very large network, the model may have to be started prior to the real-world peak period (by about the time it takes to travel the longest path through the network) to allow the initialization period to fill the network accurately.
1.2.5 Design Year
Traditionally, the design year is a 20 year horizon from the anticipated opening date of the project. In addition to analyzing the existing and design year, interim years may need to be considered, resulting from phased construction, changes in land use, or other projects within the area of influence. Selecting an appropriate design year and interim analysis horizons should be done upfront in the project scoping step with the consensus of all stakeholders involved, as the design year may affect the analytical approach and tool selected for the traffic analysis as discussed in the next two sections.
1.3 Analytical Approach Selection
FHWA Traffic Analysis Toolbox, Volume II: Decision Support Methodology for Selecting Traffic Analysis Tools (a separate document) provides detailed guidance on the selection of an appropriate analytical approach. That document should be consulted to determine if a microsimulation analysis tool is warranted. This section provides a brief summary of the key points.
The following are several situations where microsimulation is the most appropriate technical approach for performing a traffic analysis:
- Conditions violate the basic assumptions of the other available analytical tools.
- Conditions are not covered by the other available analytical tools.
- There is testing of vehicle performance, guidance, and driver behavior modification options.
For example, most of the Highway Capacity Manual (HCM)(3) procedures assume that the operation of one intersection or road segment is not adversely affected by conditions on the adjacent roadway. Long queues from one location interfering with another location would violate this assumption. Simulation may be a more appropriate analytical tool for this situation. Simulation can model the effects of one surface street intersection on other nearby intersections, it can model the effects of one freeway on-ramp on other nearby ramps, and it can model the effects of a surface street intersection on a freeway segment. This is however not to suggest that the HCM not be used. Rather, it may be prudent for the analyst to apply multiple tools to support an analysis.
Because it is sensitive to different vehicle performance characteristics and differing driver behavior characteristics, CORSIM is capable of testing intelligent transportation system (ITS) strategies designed to improve traffic congestion. The HCM procedures, for example, are not designed to be sensitive to new technology options, while CORSIM can predict the effect of new technology on capacity before the new technology is actually in place.
1.4 Analytical Tool Selection (Software)
Although this document is dedicated to the use of CORSIM to perform an analysis, CORSIM is not the most appropriate tool for all analyses. When analysts become comfortable with the application of CORSIM to projects, they may be tempted to apply CORSIM to all projects. Each project is different and the most appropriate tool must be selected based on the project itself.
The selection of the appropriate analytical tool is a key part of the study scope and is tied into the selection of the analytical approach. Generally, it is a good idea to separate the selection of the appropriate analytical tool from the actual implementation of the tool. This can be accomplished through a selection process that is independent from any project-level analytical activities. The FHWA Traffic Analysis Toolbox, Volume II: Decision Support Methodology for Selecting Traffic Analysis Tools, identifies several criteria that should be considered in the selection of an appropriate traffic analysis tool and helps identify the circumstances when a particular type of tool should be used. Some of the key criteria for software selection are technical capabilities and limitations, input/output/interfaces, user training/support, and ongoing software enhancements. A brief discussion of each of these criteria in relation to CORSIM is given in the remainder of the section.
CORSIM has many capabilities and limitations that the analyst must be familiar with before selecting it for the project. The following sections describe these capabilities and limitations.
1.4.1 CORSIM Capabilities and Limitations
CORSIM can model many elements of modern traffic systems explicitly. Many of the other features can be approximated using the basic elements of CORSIM, along with engineering judgment. There may be other tools that are better suited for a given situation. The analyst should consider the tool that is most appropriate for the analysis. This section is to be used to decide if CORSIM is the appropriate tool. The authors do not want to promote the use of CORSIM for situations in which they know there are other tools that may be better suited for the situation. Appendix B has a detailed discussion of CORSIM’s capabilities and limitations.
1.4.2 TSIS Input/Output/Interface Support Tools
The process of selecting an analytical tool must take the supporting tools into account. Using CORSIM by itself is not something that is easily done. However, CORSIM is supported by many tools that have been developed over many years to make the task easier. The TSIS package has many tools that make building networks, running CORSIM, collecting data, and animating the output of CORSIM relatively simple.
These tools can be classified into a graphical user interface and three different types of tools. Tools that directly run CORSIM are called Process tools. Tools that allow creating and editing inputs to CORSIM are called Input tools. Tools that allow the user to view the information produced by CORSIM are called Output tools. The following paragraphs give a brief overview of the TSIS support tools. More details can be found in the individual tool user’s guides provided with the TSIS package.
TShell: TSIS is, by design, an integratedset of traffic analysis tools. To provide this integrated environment, TSIS is implemented using container/component architecture. In this architecture, TShell serves as the container, while the tools are its components. Because of its centralized role in this architecture and because it provides the primary user interface for TSIS, TShell is often referred to as TSIS. In reality, TSIS is a collection that includes all of its constituent tools and TShell. The TShell program encapsulates all these different types of tools into one user interface. Although TShell makes these tools easier to use, the important work in TSIS is actually performed by the tools.
The TShell User’s Guide(4) concentrates on describing the user interface concepts of TShell. It focuses on describing the features of TShell that enable you to apply those tools effectively and to maintain the TSIS tool configuration. Furthermore, it illustrates how to use TShell to manage your traffic analysis projects. For more information please refer to the TSIS and TShell User’s Guides.(4, 5)
Process Tools: The process tools that allow execution of CORSIM include the CORSIM Driver, which provides a Windows interface into CORSIM, the CORSIM Server, which allows CORSIM to run in its own memory space so multiple instances of CORSIM can be running at the same time, and the Script Tool that allows the analyst or researcher to write scripts to do repetitive work.
Input Tools: The input tools that allow creating and modifying CORSIM input files include TRAFED, which provides a graphical way to input data, the Text Editor, which allows editing the TRF file and provides some user reference for data fields, and the Translator which imports and exports between TRAFED files and TRF files.
Output/Reviewer Tools: The output/reviewer tools inherent to TSIS include the OUT file and the CSV file generated by CORSIM that provide tables of data collected during a run of CORSIM; TRAFVU, which animates vehicles, signals, and MOEs generated by CORSIM; and the Output Processor, which collects and collates selected data for selected links, detectors, and other network objects over multiple runs of the simulation and stores this data in selected formats.
Interfaces: CORSIM has many built in interfaces that allow the analyst or researcher to get information from CORSIM, set data in CORSIM, or operate CORSIM. These interfaces are described in the Script Tool User’s Guide.(6)
1.4.3 Third Party Products
There are third party products that have been developed over the long life of CORSIM to perform special functions. There are many tools and the list changes frequently so they are not listed here. If the tools built into TSIS do not suit your needs, it may be worthwhile researching other tools. A good resource to consider is the McTrans Center. Their web site can be found at http://mctrans.ce.ufl.edu.
1.4.4 User Training/Support
There are organizations that provide traffic simulation training specific to CORSIM. The National Highway Institute (NHI) has an Introduction to CORSIM training course that provides hands-on training on basic CORSIM concepts. The McTrans Center also teaches a CORSIM course. For more information on these and other training opportunities please refer to the specific organization. The NHI web site can be found at http://www.nhi.fhwa.dot.gov/ and the McTrans Center web site is provided above.
1.4.5 Ongoing Software Enhancements
TSIS and CORSIM are continually being updated and enhanced. Refer to the McTrans Center website listed above for information on the latest release version and software enhancements.
1.5 Resource Requirements
Any traffic analysis requires resources. These resources include people, time, and computer resources. Large analysis projects require extensive computer resources including disk space, central processing unit (CPU) time, and memory.
When simulating the base network and all the alternatives multiple times each to capture the stochastic nature of the model, hundreds of megabytes of disk space may be required. Small to medium projects will require substantially less disk space. Reducing the number of files that are generated during a run or multi-run of CORSIM will reduce the amount of required data storage and reduce the computer processing time. For example, it is recommended that animation files not be generated when performing multiple runs for statistics generation.
CORSIM uses many CPU cycles to perform each second of simulation. Although CORSIM is extremely fast at processing the model, the time required is significant. This is dependent on the number of links, signals, and vehicles in the network. The faster the computer processor, the quicker CORSIM executes. When running the model numerous times, the processing time becomes a substantial resource to manage.
1.5.1 Other Resources
The resource requirements for the development, calibration, and application of CORSIM will vary according to the complexity of the project, its geographic scope, temporal scope, number of alternatives, and the availability and quality of the data.
In terms of training, the person responsible for the initial round of coding can be a beginner or an intermediate level person in terms of knowledge of the software. They should have supervision from an individual with more experience with the software. Error checking and calibration are best done by a person with advanced knowledge of microsimulation software and the underlying algorithms. Model documentation and public presentations can be done by a person with an intermediate level of knowledge of microsimulation software.
A prototype time schedule for the various model development, calibration, and application tasks is presented in Figure 3, which shows the sequential nature of the tasks and their relative durations. Data collection, coding, error checking, and calibration are the critical tasks for completing a calibrated model. The alternatives analysis cannot be started until the calibrated model has been reviewed and accepted.
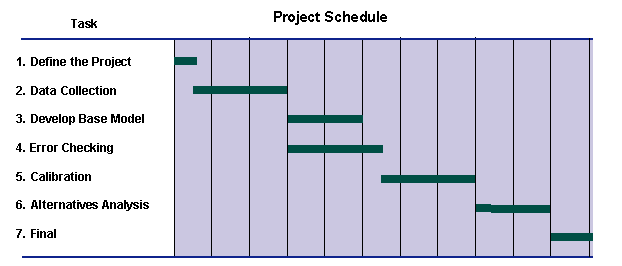
Figure 3 . Chart. Prototypical CORSIM analysis task sequence.(7)
1.6 Management of a CORSIM Study
The process outlined in this document has a sequential nature. Most of the tasks cannot be started until the previous task has finished; although efficiencies may be gained as practitioners employ a methodology which promotes a systematic process. Error checking is the one task that can be done in parallel with the base model development. However, the final error checking must be done after the base model is completely finished.
To ensure the success of the project, strict management of the project must be maintained. It is very easy to continue to make improvements to the model well beyond the criteria outlined in the scope of work. It is also quite easy to continue calibration in an attempt to make the model “perfect” well after the comparison goals have been met. Use checkpoints, milestones, and reviews to ensure the time schedule is maintained. Example milestones and deliverables for a CORSIM study are shown in Table 2.
Table 2 . Example milestones and deliverables for a CORSIM study. (7)
Milestone |
Deliverable |
Contents |
|---|---|---|
| 1. Study Scope | 1. Study scope and schedule 2. Proposed data collection plan 3. Proposed calibration plan 4. Coding quality assurance plan |
Study objectives, geographic and temporal scope, alternatives, data collection plan, coding error-checking procedures, calibration plan and targets |
| 2. Data Collection | 5. Data collection results report | Data collection procedures, quality assurance, summary of results |
| 3. Model Development | 6. 50% coded model | Software input files |
| 4. Error checking | 7. 100% coded model | Software input files |
| 5. Calibration | 8. Calibration test results report | Calibration procedures, adjusted parameters and rationale, achievement of calibration targets |
| 6. Alternatives Analysis | 9. Alternatives analysis report | Description of alternatives, analytical procedures, results |
| 7. Final Report | 10. Final Report | Summary tables and graphics highlighting key results |
|
11. Technical documentation | Compilation of prior reports documenting model development and calibration, software input files |
Different tasks and subtasks can be assigned to different people. The division of labor and the division of tasks can greatly reduce the time required to complete a project but, it simultaneously increases the control required. An experienced CORSIM user should define the project. A beginning CORSIM user can be involved in many subtasks. An experienced CORSIM user should supervise the beginning user and should lead the error checking and calibration tasks.
By monitoring resource usage and task completion times, the management and documentation of the study is much easier. These data can be used for future study estimation. Documenting the CORSIM modeling should be ongoing throughout a project.
The number and type of deliverables should be scoped out at the beginning of the project. Intermediate technical memorandums, documentation of the model calibration, study reports, and interstate access requests are the types of documents that may need to be prepared in addition to basic documentation of the study. The size and number of deliverables necessary is proportionate to the size of the model and project. A larger project may require more intermediate deliverables to facilitate the decision-making process, whereas a smaller project may require only a few deliverables.(2)
One possible way to structure the final deliverables is to create two separate documents, a final report and a technical report. This may only be necessary for larger projects while for smaller projects the documentation may be provided in one report. The key is that the results must meet the needs of two audiences: the non-technical decision makers and the technical specialists responsible for technical reviews. The types of analyses and information that may be delivered at the conclusion of the study could include the following:
- Final Report.
- Study objectives and scope.
- Overview of study approach (tools used, methodology, rationale).
- Data collection (sources and methods).
- High-level model description, diagrams, assumptions, and modifications.
- Demand forecast assumptions (assumed growth inside and outside of the study area, street improvements, variations to support a sensitivity analysis, etc.)
- Description of alternatives and modifications (improvements).
- Discussion of success or failure of design/alternatives.
- Results and recommendations.
- Technical Report.
- Input data (CADD files, diagrams, schematics, tables, demand data, traffic balance data, and traffic control data).
- Model assumptions.
- Sensitivity analysis (a targeted assessment of the reliability of the model results, given the uncertainty in certain input data or assumptions. Additional information on sensitivity analysis can be found in Chapter 6.)
- Calibration tests and results (which parameters were modified and why).
- Alternatives analysis.
- MOE report on a spatial and temporal scale to show how the MOEs change throughout the analysis period and study area.
- Output data (electronic files).
1.7 Example Problem: Study Scope and Purpose
An example problem has been provided to illustrate each step in the overall process. Each step will be explained throughout this document under the appropriate chapters.
The example problem presented is an evaluation of a proposed interchange modification to HWY 100/TH 7 Interchange and HWY 100/Minnetonka Boulevard interchanges. The HWY 100 project is part of an eight-mile freeway reconstruction program with a total cost between $100 and 200 million. The project illustrated in this example problem is a major part of the reconstruction program. The microsimulation modeling supports the reconstruction program and this particular project. To keep costs in perspective, the cost to prepare the modeling is considerably less than one percent of the construction cost.
The proposed interchange projects will include provisions for widening HWY 100 to three lanes in each direction. Currently, the construction area maintains two lanes in each direction while outside of the construction area HWY 100 is three lanes in each direction. This project is the last phase in converting HWY 100 into a six-lane freeway.
Study Objectives
The primary objectives of the study are to:
- Evaluate the proposed interchange concepts.
- Identify operational deficiencies in the freeway system.
- Identify operational deficiencies at the ramp terminal intersections and adjacent intersections in the proposed design.
- Refine concepts and re-evaluate.
- Recommend final design of interchange areas for construction in 2014.
Study Breadth (Geographic)
The proposed reconstruction area will involve less than one mile of HWY 100 freeway; however, due to the operational influence of two system interchanges, the CORSIM model limits are shown in Figure 4 and have been expanded to include the entire HWY 100/I-394 Systems Interchange and the HWY 100/HWY 62 systems interchange to the south.
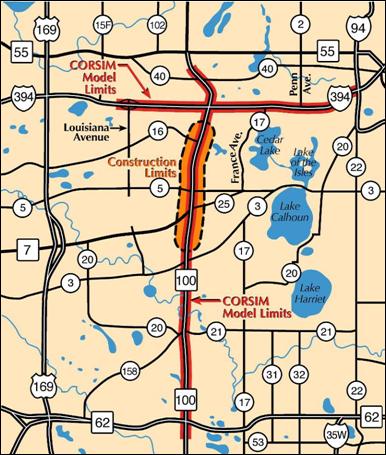
Figure 4 . Graphic. Example problem: study map.
The arterial operations at the Minnetonka Blvd (CR 5 on the study map) interchange area, including the ramp terminal intersection and intersections adjacent to the interchanges, are areas of concern within the construction limits and were thus included in the model. However, the TH 7 /Route 169 intersection was not included in the model, as it is over one mile away from HWY 100 and does not have a significant impact on operations at the TH 7/HWY 100 interchange.
Study Breadth (Temporal)
The data showed that northbound HWY 100 north of the TH 7 interchange experienced significant congestion during the morning peak period. Figure 5 shows the a.m. peak period. The peak hour was found to be from 6:45 a.m. to 7:45 a.m. In order to capture this peak hour, a three-hour peak period is defined from 6:00 a.m. to 9:00 a.m.
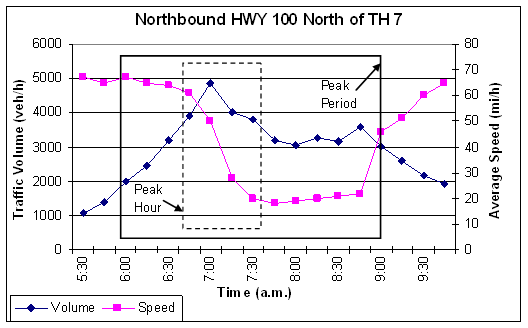
Figure 5 . Graph. Example problem: peak period selection.
Analytical Approach
This project uses CORSIM to model and analyze the HWY 100 corridor from the interchange at HWY 62 to the interchange at I-394. It was agreed that model scenarios will be prepared for no-build conditions for the existing year, opening year (2010), and a 20-year future design (2030); three different build alternatives for the 20-year future; and the preferred build alternative for the opening year. To achieve the project objectives, the work tasks listed in Table 3 will be performed.
Analytical Tool
The use of CORSIM microsimulation model was selected for this project because it can appropriately model the analytical approach requirements. Additional tools to be used in evaluating and developing refinements to the design will include signal timing optimization software for optimizing traffic signal timings.
Resource Requirements and Schedule
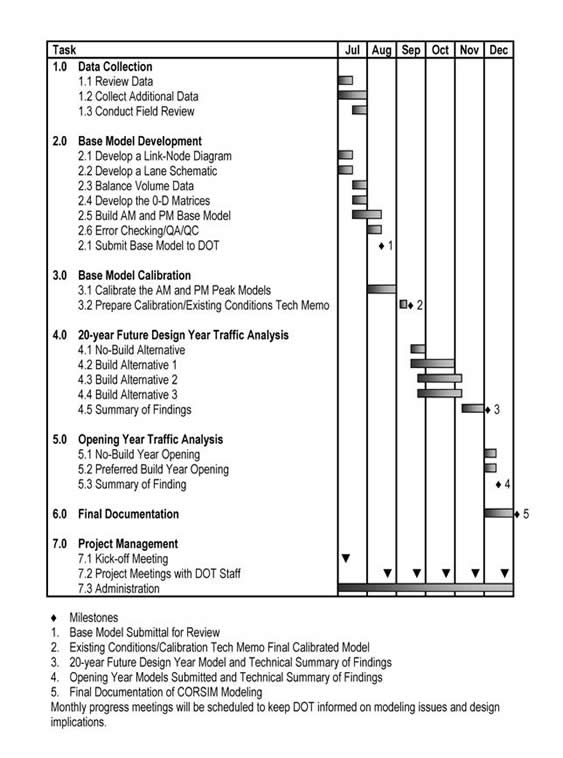
The time and resources required to complete the objectives of the project have been estimated. The schedule on this project was critical and all work was to be completed within a six-month time frame. The level of effort and time schedule with key milestones is included for reference in Figure 6.
Table 3 . Example problem: key tasks and level of effort estimated.
Task Number |
Task Description |
Estimated Person Hours |
|---|---|---|
1 |
Data Collection |
350 hrs |
2 |
Base Model Development |
330 hrs |
3 |
Calibration |
340 hrs |
4 |
Design Year Alternatives |
840 hrs |
5 |
Year Opening Analysis |
370 hrs |
6 |
Final Documentation |
80 hrs |
7 |
Project Management/meetings |
80 hrs |
Total |
2,390 hrs |
|