Empirical Studies on Traffic Flow in Inclement Weather
Executive Summary
Background
Weather causes a variety of impacts on the transportation system. An Oak Ridge National Laboratory study estimated the delay experienced by American drivers due to adverse weather conditions in 1999 at 46 million hours. While severe winter storms, hurricanes, or floodings can result in major stoppages or evacuations of transportation systems and cost millions of dollars, day-to-day weather events such as rain, fog, snow, and freezing rain can have a serious impact on the mobility and safety of the transportation system users. These weather events can result in increased fuel consumption, delay, number of accidents, and significantly impact the performance of the transportation system.
Despite the documented impacts of adverse weather on transportation, the linkages between inclement weather conditions and traffic flow in existing analysis tools remain tenuous. This is primarily a result of limitations on the data used in research activities. For example a recent study of weather-related delay in northern Virginia documented that there are significant weather-related delays but was limited by the fact that the traffic data did not recognize average speeds that were over the speed limit. This influenced the ability to accurately estimate delay caused by weather during free-flow conditions. Measuring the impact of precipitation intensity has also been challenging due to limitations of weather data. Studies conducted in Canada (Ibrahim and Hall) and by the University of Virginia (Smith, et al 2004) differed in their conclusions about the impact of precipitation intensity on speed reduction. More research is needed to determine whether results reflect regional differences or the limitations of the weather data. Research has been limited on the microscopic driving behavior as well, particularly in the areas of vehicle following and lane changing. These are critical parameters in understanding the effectiveness of different traffic management strategies. Researchers and practitioners need improved weather data sets and analytical models that can connect traffic flow to specific weather impacts.
Goals and Objectives
The overall goal of the research work undertaken in this study was to develop a better understanding of the impacts of weather on traffic flow. The research was intended to accomplish the following specific objectives:
- Study the impact of precipitation on macroscopic traffic flow parameters over a full-range of traffic states;
- Study the impact of precipitation on macroscopic traffic flow parameters using consistent, continuous weather variables;
- Study the impact of precipitation on macroscopic traffic flow parameters on a wide-range of facilities;
- Study regional differences in reaction to precipitation; and
- Study macroscopic impacts of reduced visibility.
These objectives reflect the needs identified through the literature searches conducted for this project as well as the research activity. Increasingly sophisticated ITS and traffic management systems provide an opportunity to improve safety and mobility during weather events. Before implementing these strategies, however, more needs to be understood about how weather impacts vary during congested and uncongested conditions and during different weather events. Differences in driver behavior response will also influence strategies, as well as regional differences. A better understanding of these differences is needed as well. Implementation of variable speeds limits, for example, requires an understanding of all the factors listed above.
Research Approach
The work documented in this report was conducted in two parts: 1) literature review and development of a data collection and analysis plan, and 2) analysis and interpretation of the results.
As the research plan was developed, it became clear that collecting new data would be expensive, and thus limit the resources available for analysis and interpretation. Therefore, the recommended plan combined the use of macroscopic traffic data archives with archived weather data in order to meet the research goals that include achieving better understanding of the impacts of weather on macroscopic traffic flow.
Traffic data archives with good geographic coverage were required to meet the objectives outlined in the research plan. In order to meet the study objectives, the traffic data archives had to be available in more than one region, associated with varying weather conditions, and cover regions that receive significant amounts of rain, snow, and fog. Traffic data sources were available from a number of cities that meet these criteria, and three cities that represent a variety of weather conditions were selected – Minneapolis-St. Paul, Baltimore and Seattle. Efforts were made to add a fourth, warm-weather city that does not generally experience severe weather. Several regions were considered but none could offer the desired combination of weather and traffic data.
Data from Automated Surface Observing Systems (ASOS) and Automated Weather Observing System (AWOS) were the best available for this research. They represent high-quality, reliable weather information within a national network. One limitation of using this data set was limited local coverage, since ASOS/AWOS are only located at airports. However, data were available from an adequate number of ASOS/AWOS stations close to desired traffic stations.
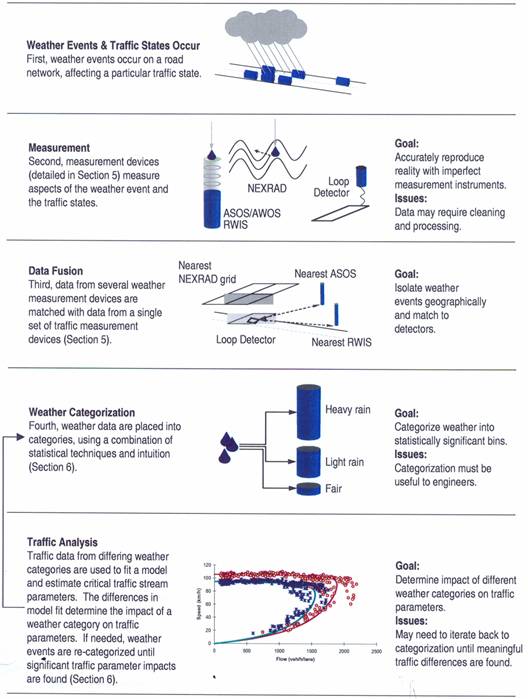
As stated above, the three metropolitan areas of Minneapolis, Baltimore and Seattle cover a wide-range of weather conditions appropriate for this study. Utilizing both weather data and loop detector traffic data, empirical models were calibrated by minimizing a normalized orthogonal error between field observations and model estimates. The optimum free-flow speed, speed-at-capacity, capacity, and jam density were computed for different weather conditions. Inclement weather adjustment factors were then developed for each precipitation level. In addition, statistical models were developed to characterize the behavior of these parameters as a function of the precipitation type and intensity. The general process is shown in Figure ES.1.
Figure ES.1 Process for Developing Empirical Models on Weather and Traffic Flow
Model Form and Calibration
The functional form utilized in this study is the Van Aerde nonlinear functional form that was proposed by Van Aerde (1995) and Van Aerde and Rakha (1995). The model bases the distance headway (km) of a vehicle (n) on several parameters, including vehicle speed, facility free-flow speed, a fixed distance headway constant, a variable headway constant and a variable distance headway constant. This model provides a linear increase in vehicle speed as the distance headway increases with a smooth transition from the congested to the uncongested regime. This combination provides a functional form that allows the speed-at-capacity to differ from the free-flow speed.
The calibration of macroscopic speed-flow-density relationships requires identification of a number of key parameters, including the facility’s expected or mean four parameters, namely: capacity (qc), speed-at-capacity (uc), free-flow speed (uf), and jam density (kj). Key decisions in the calibration process include definition of the functional form to be calibrated, identification of the dependent and independent variable, defining the optimum set of parameters and developing a technique to compute the parameter values.
A customized, heuristic tool was developed (SPD_CAL) to calibrate traffic stream models. The data were initially aggregated into traffic stream density “bins” in order to reduce computational requirements. The “bins” used reflected varying degrees of precipitation intensity and also distinguished between congested and uncongested conditions. After initializing the four traffic stream parameters the model functional form was constructed the objective function computed in an incremental process, varying the four parameters. A set of parameters was computed in an iterative manner that minimizes the objective function. The results have been summarized in various ways to represent the impact of different weather states on the traffic parameters. A sample of results is shown below in the executive summary and more detailed results are shown in Section 5 of the Report.
Research Findings
The results of the research conducted for this study were helpful in identifying weather impacts of traffic flow in the three cities studied. No impacts were found on traffic stream jam density, but both rain and snow did impact traffic free-flow speed, speed-at-capacity and capacity and parameters varied with precipitation intensity. Capacity did not vary with snow intensity, although capacity reductions of 12 to 20 percent were found in snowy conditions. One of the more interesting findings was that the Twin Cities experienced more significant reductions in the traffic stream free-flow speed and speed-at-capacity under snowy conditions when compared to Baltimore (19 versus 5 percent reductions). This finding might appear to be counter intuitive given that the Twin Cities experience higher annual snow precipitation when compared to Baltimore. A possible explanation for this finding is that drivers who are more accustomed to snow are more aware of the dangers of snow. This could also explain the higher reductions that were observed in the Canadian study (33 to 43 percent).
Results of the research are summarized in Table ES.1.
Traffic Parameter |
Weather Condition |
Range of Impact |
|---|---|---|
Free-flow speed |
Light Rain (<0.01 cm/h) |
-2% to -3.6% |
Free-flow speed |
Rain (~1.6 cm/h) |
-6% to -9% |
Free-flow speed |
Light snow (<0.01 cm/h) |
-5% to -16% |
Free-flow speed |
Snow (~0.3 cm/h) |
-5% to -19% |
Speed at Capacity |
Light Rain (<0.01 cm/h) |
-8% to -10% |
Speed at Capacity |
Rain (~1.6 cm/h) |
-8% to -14% |
Speed at Capacity |
Light snow (<0.01 cm/h) |
-5% to -16% |
Speed at Capacity |
Snow (~0.3 cm/h) |
-5% to -19% |
Capacity |
Light Rain (<0.01 cm/h) and Rain (~1.6 cm/h) |
-10% to -11% |
Capacity |
Light snow (<0.01 cm/h) |
-12% to -20% |
The research also produced more detailed, multidimensional analysis results that can be found in Section 5 of the report. The summaries and diagrams show how various parameters are influenced over a range of weather and traffic conditions. Figure ES.2 demonstrates that the free-flow speed and speed-at-capacity Weather Adjustment Factors are impacted by both the snow precipitation rate and the visibility level in the Twin Cities.
Figure ES.2 Variation in Weather Adjustment Factors as a Function of Visibility and Snow Intensity Levels (Twin Cities)
Figure ES.3 shows a comparison of the rain and snow free-flow speed, speed-at-capacity, and capacity Weather Adjustment Factors. The results demonstrate that snow impacts on traffic stream behavior are more significant than rain impacts, as would be expected. Furthermore, the results demonstrate that precipitation appears to produce a constant reduction (independent of the precipitation intensity) for the capacity. Alternatively, the free-flow speed and speed-at-capacity appear to be impacted by the precipitation level.
Figure ES.3 Sample Comparison Snow and Rain Weather Adjustment Factors (Twin Cities)
Future Research
This report concludes with some recommendations of future research related to weather and traffic flow. Several ideas are presented, including enhancing the macroscopic analysis used in this study. This effort would involve original data collection with colocation of traffic detectors and environmental sensor stations. More detailed traffic and weather data would be collected and imaging cameras used to gain a better understanding of driver response to adverse weather conditions. The research also concluded that more work is needed to better understand the impact of weather on different types of facilities, including arterials. Additional cities need to be evaluated to better assess regional differences. For example, no warm weather cities were included in this study. Finally, additional analysis of visibility impacts is needed. While some analysis of visibility data was done, the amount of data was limited and the quality uneven. The inclusion of analysis of crash rates and crash types correlated to traffic flow and speed under adverse weather conditions should also be considered.
Additional work proposed related to human factors and microscopic traffic modeling include analysis of data being collected for the Next Generation Simulation (NGSIM) project and controlled field studies on a test track. The use of surveys to gauge driver reactions to pretrip weather and traffic information are discussed. Finally the Vehicle Infrastructure Initiative (VII) program provides the promise of a much more accurate and extensive database on driver reaction to adverse weather conditions. While privacy issues may limit the ability to obtain individual vehicle data, useful aggregate data will be available.
| Previous Section | Next Section | Home | Top