|
|
|
Travel Time Reliability:
Making It There On Time, All The Time
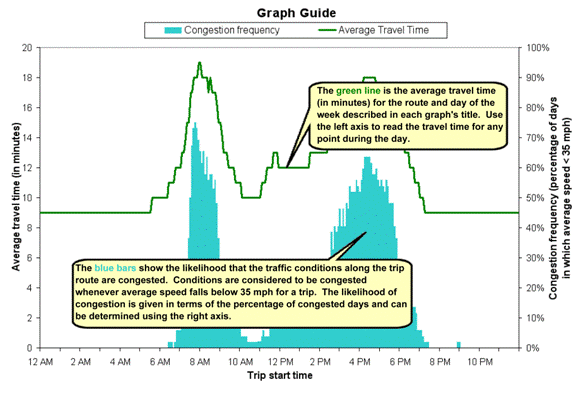
This figure shows a combination bar and line chart in which the bars indicate congestion frequency and the line represents average travel time. Both the bars and the line have a peak in the morning and afternoon that correspond to the peak traffic times.
Figure 9. WSDOT travel time mobility and reliability corridor data.

Source: WSDOT's Central Puget Sound Average Travel Times web page, available at http://www.wsdot.wa.gov/traffic/seattle/traveltimes/commutes/.