Regional ITS Architecture Guidance Document
Regional ITS Architecture Guidance Document
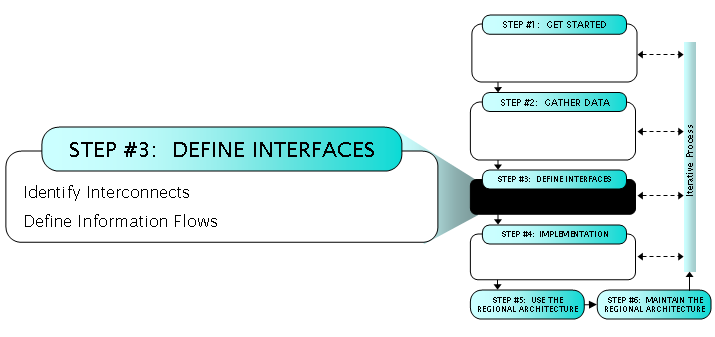
This section describes the "Define Interfaces" step in the regional ITS architecture development process.
At this point, the ITS elements in the region have been identified and defined in terms of the functions that they perform. In the "Define Interfaces" step, these elements are interconnected and the information that flows between the elements is defined. These interface definitions build on the general integration strategy that was described in the operational concept developed in the previous step.
In this section, the "Identify Interconnects" and "Define Information Flows" process tasks are described in detail. Each task description begins with a one page summary that is followed by additional detail on the process, relevant resources and tools, a general description of the associated outputs, and example outputs where they are available. Each task description also includes tips and cautionary advice that reflect lessons that have been learned in development of regional ITS architectures over the past several years.
| These tasks may be performed in parallel or in sequence. |
|
|---|---|
| OBJECTIVES |
|
| PROCESS Key Activities |
Prepare
|
|
INPUT Sources of Information |
|
|
OUTPUT Results from Process |
|
This is one of the defining moments in the regional ITS architecture development process. The region's elements have been defined, the regional needs and services are understood, and an operational concept has identified the integration opportunities in the region in a broad sense. In this step, the connections between ITS elements are identified, creating a "framework for integration" that will support the exchange of information between ITS elements.
 Interface requirements and information exchanges with planned and existing elements are a required component of the regional ITS architecture as identified in FHWA Rule 940.9(d)6 and FTA National ITS Architecture Policy Section 5.d.6.
The inventory, needs and services, operational concept, and functional requirements lay the groundwork for evaluation of which ITS elements should connect to each other. Based on this information and any documentation that may describe existing communications in the region, a preliminary set of connections can be identified.
All that is being identified at this point are connections or "interconnects" between ITS elements. The specific information that is exchanged on each interconnect is not defined until the next step in the process.
 While this two-step "interconnects and then information flows" process for defining interfaces is not mandatory, experience shows that it is usually faster and easier to define interconnects first before specifying information exchanges. One reason to start with interconnects is that there are many more potential information exchanges than there are interconnects. The difference may be an order of magnitude — for example, 1000 potential interconnects vs. 10,000 potential information flows in a regional ITS architecture. Typically, only 20-30% (or approximately 200 to 300) of the valid interconnects will actually be selected for the region, effectively reducing the number of information flows that must be considered by 70-80%. Clearly, it is an iterative process, but use this Interconnect step to filter out all of the unwanted connections as early in the process as possible.
Note that an exception to starting with interconnects is when a regional ITS architecture is being maintained or updated. In this case, small revisions to the regional ITS architecture information flows based on corrections, revised stakeholder needs or updated status of information flows (e.g. from planned to existing) may be most efficiently made by going directly to the "define information flows" editing step. However, when completely new stakeholder requirements or needs involve the addition of new ITS elements associated with new services or new connections between ITS elements that never shared information before, starting with the "identify interconnects" step may still be useful and effective.
Beginning with a preliminary set of interconnects, the stakeholders involved assess whether the interconnects would help support the needs and services of the region. Consider whether the connection exists today, or whether it is planned for the future. Often, a communications or network architecture is already in place between major "centers" in the region. Make sure the network can accommodate the connections identified in this step.
When most of the major stakeholders are present, concentrate primarily on evaluating the potential connections between centers, as those are most likely to cross agency or public/private boundaries. Since an agency typically owns its own center and respective roadside or vehicle assets, the connections to those items really require only the evaluation of the affected stakeholder, and not the stakeholder group at large. Consider handling these non center-to-center interconnections outside of general region-wide meetings.
Consider the existing connections between various stakeholder agencies, companies, or groups as the regional ITS architecture interconnects are defined. Many of these existing connections will be voice communications between people, either by telephone or face-to-face due to co-location of agencies such as public safety and traffic management agencies. There are two different schools of thought on how these interconnects between people should be shown in the regional ITS architecture:
Each region should decide how voice communications should be handled in the architecture. If voice-only connections are identified in the architecture, then they should be distinguished from the data connections to avoid confusion. When voice communications are identified that "will never be replaced with data communications", the benefits of data communications can be discussed with the group — the speed, reliability, and ability to distribute data to many points are powerful motivations for augmenting voice communications with data communications on many interfaces over time.
Security Considerations
 The interfaces between ITS elements can pose security issues that should be identified prior to project implementation. Security boundaries and the interfaces to critical assets can be identified as part of the interconnect definition in the regional ITS architecture.
 The National ITS Architecture identifies connections between architecture entities (subsystems and terminators). Since the ITS Inventory created in Step #2 included the mapping of each element to a National ITS Architecture entity, the framework of interconnects offered by the National ITS Architecture can serve as a starting point by identifying potential connections between each of those ITS elements. It is recommended that these connections be evaluated based on the services, or "market packages", the region desires to support.
 Turbo Architecture was designed to identify connections between ITS elements in the inventory that support selected services or "market packages". Although the tool identifies all potential connections between ITS elements based on the National ITS Architecture, it pre-selects those connections required to support the desired services. The tool facilitates selection or elimination of connections during stakeholder meetings by providing customization tables with a checkbox for each potential connection. Careful assignment of ITS elements to market packages assists Turbo Architecture in pre-selecting interconnects more accurately. In general, the more closely the market package matches the desired regional service, the better Turbo's interconnect pre-selection algorithms will work.
A regional ITS architecture set of interconnects is a collection of all existing and planned interconnects between ITS elements in the region. This output should include each pair of interconnected ITS elements, together with the high-level status of that interconnection (e.g., existing or planned). A brief description or assumptions may be added if desired.
Regional ITS architecture interconnects can be shown as a list of ITS element pairs, indicating those that are included in the regional architecture, or as a diagram that allows one to see the connections "at a glance". Since maintenance of the regional ITS architecture is important, it's advisable to select a form that is easily maintained.
A particularly useful means for displaying the interconnections is a diagram showing all of the connections between ITS elements in the region. For large inventories, this may prove too cumbersome to maintain and for these, consider including only "center" type ITS elements (Traffic Operations Center, Transit Operations Center, etc.) in the diagram.
A subset of the interconnect list can be presented as a diagram for each stakeholder, illustrating all of the connections between the stakeholder's element(s) and other ITS elements in the region. This has proven to be an invaluable explanatory tool for illustrating the benefits of creating a regional ITS architecture to agency or company executives.
Regional ITS architecture interconnects have been published in a variety of tabular and graphical formats. The range of outputs that have been published reflect a spectrum of choices in the tradeoff between output legibility/ accessibility and ease of development and maintenance. Custom diagrams are easy to understand, but somewhat difficult to develop and maintain. On the other end of the spectrum, a simple list of interconnects is easy to generate, but somewhat difficult to decipher for the uninitiated. The following examples illustrate the range of interconnect outputs that can be generated.
Example 1: High-Level Interconnect Diagram
Figure 17 shows an example high-level interconnect diagram for the Greater Yellowstone Rural ITS (GYRITS) Priority Corridor. The diagram presents the key interconnects in the region in an easy-to-understand format. A format like this is attractive and accessible to stakeholders, but it requires more development and maintenance effort than the computer-generated examples that follow.
As with all general presentations of interconnects, Figure 17 also may imply more connectivity than will actually be used in a region. For example, a reader might infer that "transit operations centers" can communicate with "emergency vehicle systems" because the "Trunked/Dedicated Radio Systems" communications is shown as a common wide area wireless resource for the region. Of course, the regional implementation will not include (and may actively preclude) this option. As long as care is taken in interpreting a high-level interconnect diagram, it can be one of the most useful top-level explanations of architecture connectivity.
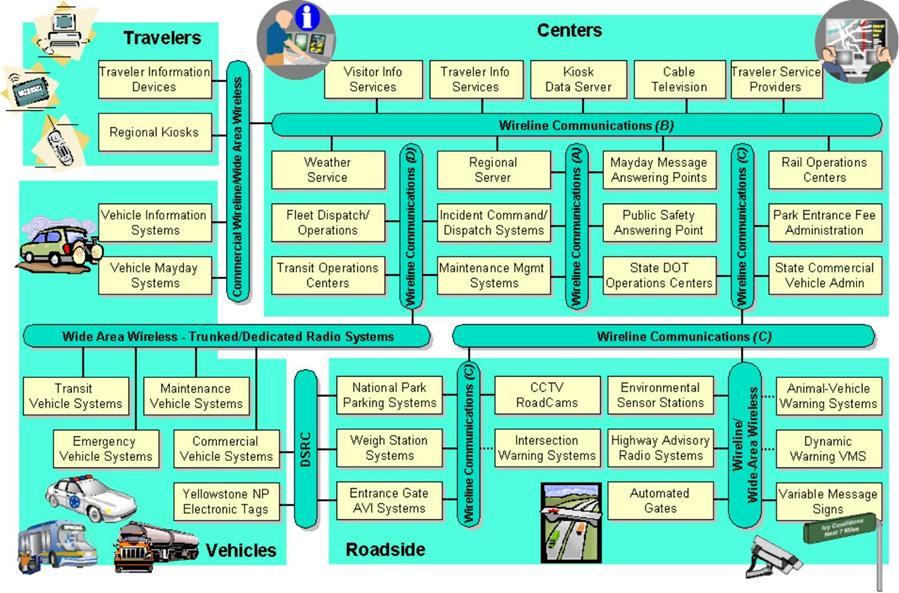
Figure 17: Greater Yellowstone Rural ITS Architecture Interconnect Diagram
Example 2: Architecture Interconnect Diagram
A representation of the Albuquerque regional ITS architecture interconnects for the Albuquerque Police Department that was generated using the Turbo Architecture tool is shown in Figure 18. Each block represents an ITS inventory element, including the name of the stakeholder in the top shaded portion. The interconnect lines between elements are solid or dashed, indicating existing or planned connections. A diagram like this works well as long as a limited number of interconnects will be shown. Where twenty or more interconnects must be displayed, the diagrams become quite complex and can be difficult to read.
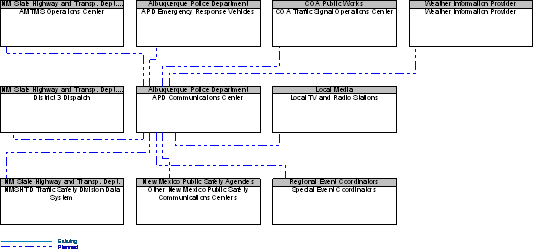
Figure 18: Albuquerque Regional ITS Architecture Interconnect Diagram
Example 3: Tabular List of Interconnects
A tabular list of interconnects also works well, particularly when many interconnects must be documented. An example of an interconnect table for the Metro TMC that is included in the Minnesota Statewide Architecture is shown in Table 6. This output was generated by extracting information from the Turbo Architecture Microsoft Access database and formatting it into a table. Note that an interconnect table does not show source and destination because interconnects are bi-directional. For example, the second row of the table shows an interconnect between Data Center and Metro TMC. Information may move in one direction (either Data Center to Metro TMC or Metro TMC to Data Center) or in both directions on this interconnect.
Table 6: Minnesota Statewide Architecture Metro TMC Interconnects
| Element | Element | Status |
|---|---|---|
| Broadcast Information Providers | Metro TMC | Existing |
| Data Center | Metro TMC | Planned |
| Division of Emergency Management Center | Metro TMC | Planned |
| Electrical Services Center | Metro TMC | Existing |
| Emergency Management Vehicle | Metro TMC | Existing |
| Event Promoters | Metro TMC | Existing |
| Inter-jurisdictional Traffic Management System | Metro TMC | Existing |
| Local Signal Center | Metro TMC | Planned |
| Maintenance Dispatch Center | Metro TMC | Existing |
| Metro TMC | Metro TMC_Roadside Equipment | Existing |
| Metro TMC | Metro Traffic Engineering Center | Existing |
| Metro TMC | National Weather Service | Existing |
| Metro TMC | Road Weather Information Center | Existing |
| Metro TMC | State Patrol Dispatch Centers | Planned |
| Metro TMC | TOCC | Existing |
| Metro TMC | Traveler Information Center | Planned |
| These tasks may be performed in parallel or in sequence. |
|
|---|---|
| OBJECTIVES |
|
| PROCESS Key Activities |
Define Information Flows
|
|
INPUT Sources of Information |
|
|
OUTPUT Results from Process |
|
Once stakeholders have agreed to exchange information between their respective ITS elements, the next step is to define the actual information that flows between the ITS elements in order to support the region's desired services.
Interface requirements and information exchanges with planned and existing systems is a required component of the regional ITS architecture as identified in FHWA Rule 940.9(d)6 and FTA National ITS Architecture Policy Section 5.d.6.
Now that the stakeholders have reached consensus on the interconnectivity of the ITS elements in the inventory, they must define the information that must be exchanged, given the services to be supported.
Each information flow is fully described by a source element (where the information originates), a destination element (where the information is sent) and a descriptive name for the information itself. The high-level status of the information flow (e.g., existing or planned) should also be documented.
In addition to the timeframe specified earlier in the process, stakeholders should discuss the criteria that will be used to make information flow status assignments. What is the status assignment if...
Although each region can define their own criteria for flow status assignments, a reasonable approach is to consider whether the regional ITS architecture will have any impact on the information flows that are somewhere between "existing" and "planned" because implementation has started. For example, if the interface design is complete and ITS standards decisions have already been made, then the information flow may be considered to be "existing" with respect to the regional ITS architecture, even if the interface may not yet be operational. Following this criteria, information flows that can be influenced by the regional ITS architecture are designated as planned. Flows for interfaces that have already been designed are identified as existing. This approach has the added benefit of extending the "grace period" after the architecture is completed when the flow status will still be accurate when compared to criteria that only consider whether the interface is operational.
For flows that do not exist, consider including gradations of "planned" flows. For example, "planned within 5 years", "planned within 10 years", and so forth.
It is often helpful to review the operational concept and services established earlier, and envision the possible scenarios in which information is exchanged. This exercise often brings to light any gaps in understanding the operational concept since it reconciles the information sent by the source ITS element with the information expected by the destination ITS element.
When most of the stakeholders are present, concentrate primarily on evaluating the information flows between centers, as those are most likely to cross agency or public/private boundaries. Since an agency typically owns its own center and respective roadside or vehicle assets, the information flows on those internal agency interfaces really require only the evaluation of the affected stakeholder, and not the stakeholder group at large. Consider handling these non center-to-center information flows outside the general meeting.
Many regions use "hubs" to tie centers together that share information. For example, all public safety agencies in a region might be connected to an "incident information and mutual aid" network. All information exchanges between the public safety agency elements would go through this hub, facilitating region-wide sharing of information between agencies.
In some regions, the stakeholders think of the hub as a key component of the regional transportation system and feel it is important to include the hub in the regional ITS architecture. Explicitly including hubs in the regional ITS architecture has an ancillary benefit in that architectures that include hubs normally have fewer connections and information flows to define and maintain than equivalent architectures that depict point to point connections between all elements served by a hub. Other regions may decide that a "hub" is really a part of the communications infrastructure implementation and therefore should not be reflected in the interfaces defined in the architecture. Both views are valid. The region's stakeholders must decide which interpretation is best for their architecture.
There are a couple of factors to consider when deciding whether hubs should be included in the regional ITS architecture. One factor to consider is the functionality that the hub includes; a hub that implements ITS functions (e.g., data fusion) should probably be included in the regional ITS architecture while hubs that only implement communications functions (e.g., routing, protocol conversion, and data security) may be excluded at the stakeholders' discretion. This brings us to the most important factor in making this decision: Meeting stakeholders' expectations for the architecture by making sure that it reflects the stakeholder's "natural" view of the elements in the region. If the hub is largely transparent to the transportation professionals and other stakeholders, then it probably should be transparent in the architecture. If it is viewed as an integral part of the overall regional system, then it should be included as an important part of the architecture.
When hubs are included in a regional ITS architecture, a few key points should be documented. First, clearly define the element as a hub and include the functions that it performs in the definition. Second, document any specific interconnectivity constraints (e.g., a given public safety agency can NOT talk to another public safety agency using the hub in the above example) so that these selective connectivity requirements are not masked by the broad general connectivity that is suggested by a hub.
Security Considerations
As information flows are identified, they should be examined with respect to the security objectives. By evaluating each information flow against the objectives, the most sensitive information is identified that should be afforded special security protections when the systems are integrated. The National ITS Architecture includes a basic assessment of each information flow against three security objectives that can be used to support this process. In conjunction with the security objectives, specific threats associated with the information flows can be identified, using the general threat categories identified in the National ITS Architecture as a starting point for an analysis that identifies specific threats to information transfers between ITS elements in the region.
 The National ITS Architecture identifies information flows between architecture entities (subsystems and terminators). In the National ITS Architecture terminology, information flows are referred to as "architecture flows". Since the Inventory created in Step #2 of the regional ITS architecture development process included the mapping of each element to a National ITS Architecture entity, the framework of architecture flows offered by the National ITS Architecture can serve as a starting point by identifying information to be potentially exchanged between each of those ITS elements. It is recommended that these information flows be evaluated based on the market packages, or services, the region desires to support.
Where architecture flows from the National ITS Architecture are not adequate to reflect stakeholder requirements, create new stakeholder-defined architecture flows.
Turbo Architecture identifies potential information flows, just as it created interconnects for the previous process step. The tool will identify (but not necessarily select) all potential information flows between ITS elements based on the National ITS Architecture. Turbo Architecture will also select a set of information flows based upon the market packages selected. Careful assignment of ITS elements to market packages assists Turbo Architecture in selecting information flows more accurately. In general, the more closely the market packages match the desired regional service, the better Turbo's default information flow selection will be. The tool facilitates selection or elimination of information flows during stakeholder meetings by providing customization tables with a checkbox for each potential flow.
When market package instances are used and ITS elements are correctly associated with the market package instances, Turbo can be used to show the interconnects or information flows for one market package instance at a time, which greatly facilitates the "customization" of these market package instances. Market package instances can also be printed graphically one instance at a time, facilitating use of market package instances in regional ITS architecture development and maintenance.
A regional ITS architecture defines all existing and planned information flows between ITS elements in the region. The information flow output should include all connected source and destination ITS elements, a descriptive name for the information flowing between them, and a high-level status of that information flow (existing or planned). A brief description or assumptions may be added if desired.
The diagram formats that work well for interconnects generally also work well for information flows, except that the number of ITS elements shown in the diagram will need to be limited to ensure legibility. There is no one-size-fits-all formula for picking the elements that should go on a particular diagram. The key is to pick natural subsets of the regional ITS architecture that are of a manageable (and presentable) size and then generate diagrams for those subsets. There are three types of subsets of information flows that have proven to be most useful in recent regional ITS architecture work:
Information flows for a regional ITS architecture can be shown as a list of source, destination, and information flow "triplets" or as a diagram that shows the same information exchanges as directed flows. In developing information flow outputs, the developer is faced with a classic "ease of development" versus "ease of use" decision. Since regional ITS architectures include many information flows, it is important to make the outputs as easy to develop and maintain as possible. The trade-off is that more automated outputs (tables or auto-generated diagrams) may be more difficult to use, particularly for the uninitiated, than custom crafted diagrams. The appropriate output format should be decided by balancing these considerations against the available resources and the amount and type of use that is anticipated for each output.
Example 1: Custom Information Flow "Context" Diagram
Figure 19 is an example of an information flow diagram taken from the Delaware Valley Regional Planning Commission (DVRPC) regional ITS architecture. The diagram shows the PENNDOT District Traffic Control Center in the "context" of all the interfaces and information flows that it will support. The shapes each represent a National ITS Architecture entity (subsystems in squares, terminators in ovals), and the lines connecting them are labeled architecture flows; the DVPRC opted to identify high priority flows (solid lines) and medium priority flows (dashed lines). Note that once the inventory elements and information flows have been mapped to National ITS Architecture entities and architecture flows, the latter terminology is typically used; therefore, these "information flow diagrams" are often called "architecture flow diagrams". This diagram represents an investment of some time to handcraft the connections and add color to make the diagram attractive and easy to understand.
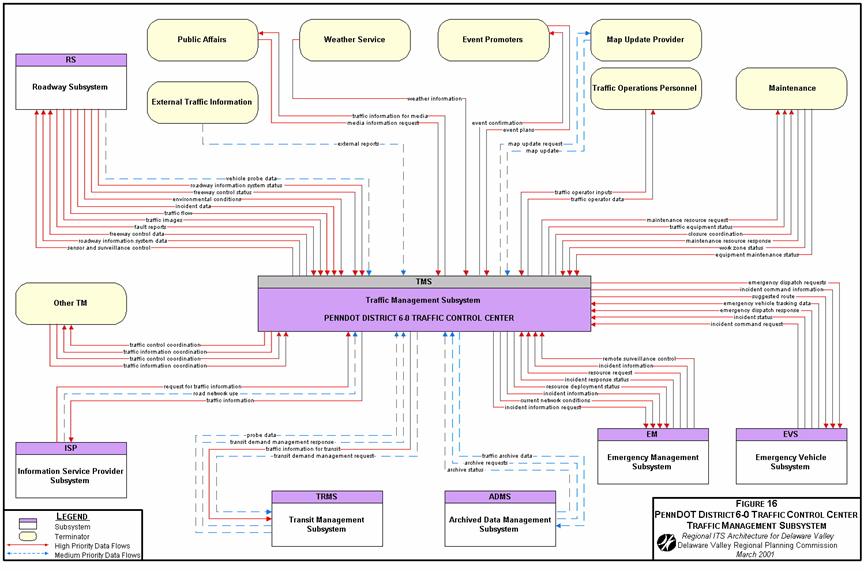
Figure 19: DVRPC Regional ITS Architecture Flow Diagram
Example 2: Auto-Generated Interface Specification Diagram
The example from the FDOT District 3 regional ITS architecture in Figure 20 shows the interface between the County Emergency Operations Centers and the City of Tallahassee Transportation Management Center. Note that each information flow is indicated as existing or planned using the solid/dashed line convention, and completely defined below the diagram as well. The diagram in this case is a standard Turbo Architecture diagram that can be automatically generated for any two elements in the Turbo inventory.
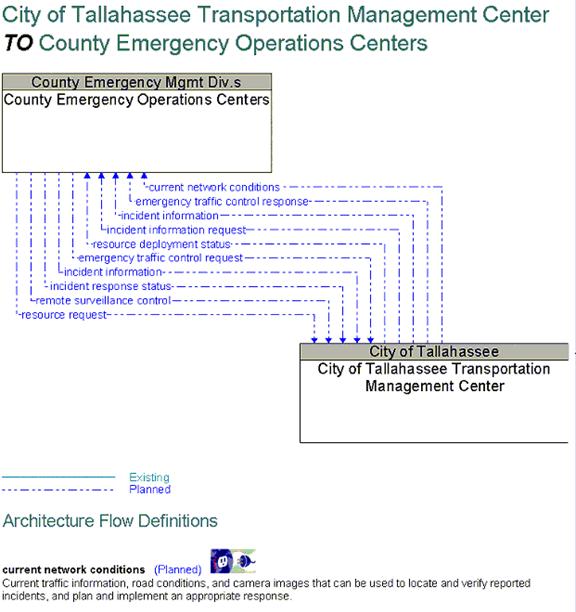
Figure 20: Example of an Information flow Diagram Interface Specification
Example 3: Tabular Presentation of Information Flows
Information flows can also be presented in a table, as shown in the example from the Minnesota Statewide Architecture in Table 7. The table shows the source, destination, information flow name, and flow status for information flows that will be received by the Metro TMC. The table also includes a flow description derived from the architecture flow descriptions in the National ITS Architecture. This table was generated from a Turbo Architecture database.
Table 7: Minnesota Statewide Architecture Information Flows (Draft)
| Source | Flow Name | Flow Description | Destination | Status |
|---|---|---|---|---|
| Broadcast Information Providers | external reports | Traffic and incident information that is collected by the media through a variety of mechanisms (e.g., radio station call-in programs, air surveillance). | Metro TMC | Existing |
| Broadcast Information Providers | media information request | Request from the media for current transportation information. | Metro TMC | Existing |
| Data Center | archive coordination | Catalog data, meta data, published data, and other information exchanged between archives to support data synchronization and satisfy user data requests. | Metro TMC | Planned |
| Data Center | archive requests | A request to a data source for information on available data (i.e. "catalog") or a request that defines the data to be archived. The request can be a general subscription intended to initiate a continuous or regular data stream or a specific request intended to initiate a one-time response from the recipient. | Metro TMC | Planned |
| Data Center | archive status | Notification that data provided to an archive contains erroneous, missing, or suspicious data or verification that the data provided appears valid. If an error has been detected, the offending data and the nature of the potential problem are identified. | Metro TMC | Planned |
| Division of Emergency Management Center | incident response coordination | Incident response procedures, resource coordination, and current incident response status that are shared between allied response agencies to support a coordinated response to incidents. This flow also coordinates a positive hand off of responsibility for all or part of an incident response between agencies. | Metro TMC | Planned |
| Division of Emergency Management Center | incident response status | Status of the current incident response including traffic management strategies implemented at the site (e.g., closures, diversions, traffic signal control overrides). | Metro TMC | Planned |
| Electrical Services Center | work zone status | Status of maintenance work zone. | Metro TMC | Existing |
| Emergency Management Vehicle | emergency dispatch response | Request for additional emergency dispatch information (e.g., a suggested route) and provision of en-route status. | Metro TMC | Existing |
| Emergency Management Vehicle | emergency vehicle tracking data | The current location and operating status of the emergency vehicle. | Metro TMC | Planned |
| Emergency Management Vehicle | incident command request | Request for resources, commands for relay to other allied response agencies, and other requests that reflect local command of an evolving incident response. | Metro TMC | Existing |
Example 4: Market Package Instance Diagrams
An alternative method for identifying information flows between ITS elements is to use the National ITS Architecture market package diagrams and delete the undesired flows and add stakeholder-defined flows. This is a helpful approach when used in conjunction with the Operational Concepts because it places the information flows in the context of a service to be provided. Many market packages illustrate multiple architectural operational concepts to address a particular service, and therefore, the packages must be customized to illustrate only the option selected by the stakeholders. Figure 21 shows how Florida DOT District 3 customized the "ATMS18 — Road Weather Information System" market package by adding a Fog and Smoke Detection/Warning System and supporting architecture flows. Although these flows already existed elsewhere in the National ITS Architecture, they were not originally included in this market package.
| Added Flow | Source | Destination |
|---|---|---|
| roadway information system status | District 3 Field Equipment | FDOT District 3/FHP Pensacola Transportation Management Center |
| roadway information system data | FDOT District 3//FHP Pensacola Transportation Management Center | District 3 Field Equipment |
| driver information | District 3 Field Equipment | Driver |
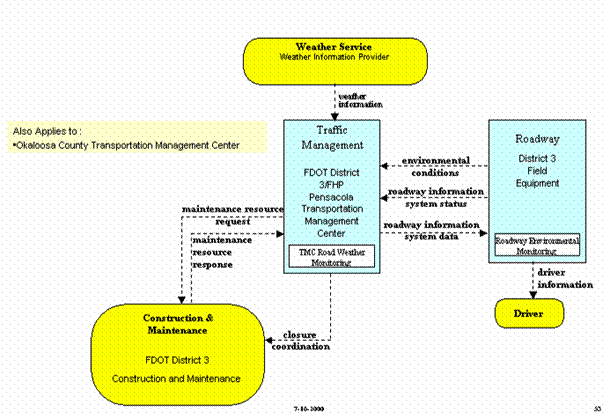
Figure 21: Information Flows in a Market Package Instance Diagram