| Ramp Management Strategies |
|
| 5.1 Chapter Overview |
Chapter 5 is the first of four chapters that comprise the ramp management decision making process. Chapter 5 introduces and describes commonly used strategies that may be implemented to better manage traffic on and adjacent to freeway ramps. In doing so, this chapter lays the foundation from which practitioners may successfully develop and select strategies and plans (Chapter 6), implement strategies and plans (Chapter 7), and operate and maintain strategies and plans (Chapter 8). Together, Chapters 5-8 feed into Chapter 9 (Visibility Module), where practitioners will be able to monitor and evaluate the selected ramp management strategies.
Chapter 5 begins with an overview of four ramp management strategies (see Section 5.2) followed by four separate sections that describe each of these strategies in greater detail (see Sections 5.3-5.6). The strategies discussed here in this chapter and throughout the rest of this handbook include: ramp metering, ramp closure, special use treatments, and strategies implemented at the ramp-arterial terminal (i.e., intersection). These four strategies give agencies the ability to control the rate that traffic is allowed to enter the freeway facility; temporarily or permanently restrict traffic flow, provide priority to special vehicle uses, and implement treatments at the ramp-arterial terminal to improve traffic operations on and along ramps and adjacent arterials. For each strategy, a number of associated techniques and approaches exist, some of which will prove to be better than others at fulfilling agency goals and objectives.
To help facilitate reader understanding of this chapter, several objectives were developed. These objectives are outlined below.
Chapter 5 Objectives:
- Objective 1: Become familiar with the four basic strategies used to manage traffic on freeway entrance and exit ramps.
- Objective 2: Gain a high-level understanding of what each ramp management strategy entails and the benefits and impacts of implementing each.
- Objective 3: Identify where ramp metering strategies have been applied and the results that strategies produced.
- Objective 4: Understand the unique issues associated with each strategy and why these issues are important.
|
| 5.2 Overview of Ramp Management Strategies |
The four ramp management strategies discussed in this chapter may be used separately or in combination with one another to manage traffic on a ramp or at the points where ramps connect to adjacent freeways and/or arterials. The advantages and disadvantages of each strategy differ, thereby requiring practitioners to closely analyze each to determine its appropriateness for satisfying existing problems and conditions. Before deciding which strategy is most appropriate for addressing a specific problem or situation (Chapter 6), it is important that practitioners understand the purpose of each strategy and its advantages and disadvantages. This understanding will help narrow the focus and to identify the one strategy, or set of strategies, that is most appropriate given a set of unique issues and characteristics. A brief overview of the available ramp management strategies is provided in the following section, while Sections 5.3 through 5.6 describe each in greater detail. The strategies discussed are bulleted below in the order that they are discussed.
- Ramp Metering.
- Ramp Closure.
- Special Use Treatments.
- Ramp Terminal Treatments.
|
|
Ramp metering is the deployment of a traffic signal(s) on a ramp to control the rate vehicles enter a freeway facility. By controlling the rate vehicles are allowed to enter a freeway, traffic flow onto the freeway facility becomes more consistent, in essence smoothing the flow of traffic on the mainline and allowing efficient use of existing freeway capacity.
Ramp meters may be programmed to release vehicles one at a time or in a small (usually two-vehicle) platoon to mitigate the impacts that vehicles entering the freeway have on freeway traffic flow. A ramp meter may be coordinated with other ramp meters to smooth traffic flow at a point or along a stretch of freeway or alternatively for several freeways within a regional network. Additionally, ramp meters may be programmed to optimize freeway flow and/or reduce congestion and its effects (collisions, delay, emissions, and fuel consumption). However, it should be noted that motorists may elect to bypass metered ramps in lieu of other ramps upstream or downstream of those that are metered. The potential for diversion is an issue that practitioners need to take into consideration before deploying ramp meters.
Ramp metering has been a practice used since the late 1950’s and early 1960’s when ramp meters were deployed in Chicago, Detroit, and Los Angeles. Since this time, more than 2,100 ramp meters have been deployed in 29 metropolitan areas within the United States (U.S.).[1] Table 5‑1 identifies major ramp metering programs and their approximate number of meters.
Table 5‑1 : Major Ramp Meter Programs[1]
| Metropolitan Area |
No. of Meters* |
Los Angeles – Anaheim – Riverside, CA |
1,316 |
Minneapolis – St. Paul, MN |
419 |
San Diego, CA |
288 |
San Francisco – Oakland – San Jose, CA |
191 |
Houston – Galveston – Brazoria, TX |
128 |
Phoenix, AZ |
122 |
Seattle – Tacoma, WA |
120 |
Milwaukee – Racine, WI |
118 |
Chicago, IL – Gary, IN – Lake County, IL |
113 |
Portland, OR – Vancouver, WA |
110 |
|
* Figures shown were current as of 2002.
Typically, ramp meters are deployed on ramps that connect freeways with local or arterial streets; however, there have been several instances in the U.S. where meters have been deployed on ramps that connect one freeway with another. Of the 10 major ramp meter programs identified above, freeway-to-freeway ramp meters have been deployed in over half of them. These cities are:[1]
- Minneapolis – St. Paul, Minnesota.
- San Francisco – Oakland – San Jose, California.
- San Diego, California.
- Milwaukee – Racine, Wisconsin.
- Portland, Oregon – Vancouver, Washington.
- Seattle, Washington.
Benefits
Experience with ramp meters has shown safety, travel time, speed, throughput, and environmental benefits. When ramp meters were turned off for a six-week study in Minneapolis a before and after evaluation concluded that meters were responsible for a 21 percent reduction in crashes and a nine percent increase in mainline volumes. Surveys in Minnesota and Glasgow, Scotland showed a majority of motorists viewed ramp metering as a beneficial traffic management strategy.
Advantages of ramp meters in regard to freeway operations include:
- Improved system operation.
- Increased vehicle throughput.
- Increased vehicle speeds.
- Improved use of existing capacity.
- Improved safety.
- Reduction in number of crashes and crash rate in merge zones.
- Reduction in number of crashes and crash rate on the freeway upstream of the ramp/freeway merge zone.
- Reduced environmental effects.
- Reduced vehicle emissions.
- Reduced fuel consumption.
- Promotion of multi-modal operation.
Table 5‑2 provides a sample of reported benefits.
Case Study: Minneapolis, Minnesota Ramp Metering Program
In early 2001, a report that documented the results of an evaluation of the ramp metering program in Minneapolis – St. Paul, Minnesota was released. The evaluation which was formally conducted in the fall of 2000, sought to measure the benefits and impacts of ramp meters in the Twin Cities, and to make comparisons of this program with others in the United States. Since ramp meters were already in place, the first phase of data collection focused on collecting data to baseline conditions “with ramp meters”. During the second phase, meters were turned off, and data were again collected to measure conditions in the after phase of when ramp meters were turned off. Analysis of the data that were collected indicated that ramp meters had a net positive effect on traffic operations. When ramp meters were turned off, traffic volumes, travel time, travel time reliability, safety, emissions, and fuel consumption measurements were worse than when meters were on.
Table 5-2 : Ramp Metering Benefits by Performance Measure [2],[3]
| Measure |
Location |
Benefits |
Safety |
Minneapolis, MN |
26% reduction in peak period collisions and 38% decrease in peak period collision rate. |
Seattle, WA |
34% decrease in collision rate. |
Denver, CO |
50% reduction in rear-end and side swipe collisions. |
Detroit, MI |
50% reduction in total collisions, 71% reduction in injury collisions. |
Portland, OR |
43% reduction in peak collisions. |
Long Island, NY |
15% reduction in collision rate. |
Travel Time and Speed |
Long Island, NY |
9% increase in average vehicle speed. |
Portland, OR |
26 to 66 km/h increase in average vehicle speeds (16 to 41 mi/h). |
Denver, CO |
69 to 80 km/h improvement in average vehicle speeds (43 to 50 mi/h). |
Seattle, WA |
Decrease in average travel time from 22 to 11.5 minutes. |
Minneapolis, MN |
64 to 69 km/h improvement in average peak hour speeds (40 to 43 mi/h). |
Throughput |
Minneapolis, MN |
25% increase in peak volume. |
Seattle, WA |
74% increase in peak volume. |
Denver, CO |
18% increase in peak volume. |
Long Island, NY |
2% increase in throughput. |
Environmental |
Minneapolis, MN |
2 to 55% reduction in fuel consumption. |
Savings of 1,160 tons of emissions. |
|
Impacts
Potential negative impacts of ramp meters in regard to freeway operations include:
- Potential for traffic diversion – Motorists may elect to bypass queues that form at ramp meters in lieu of arterials that parallel a freeway facility. This is especially true for motorists who take short trips, in which case wait times at meters may exceed the additional travel time in taking slower arterial routes. If available routes cannot support diverted traffic, operations on nearby arterials may be negatively affected.
- Equity – Arguments have suggested that ramp meters favor suburban motorists who make longer trips, versus those that live within metered zones who make shorter trips. This argument is based on the assumption that the suburban motorist lives outside a metered zone and is not delayed by ramp meters when entering a freeway and traveling through a metered zone. As such, the possibility exists that the motorist who lives closer to a downtown area may have a proportionally unfair commute when comparing travel time against travel distance. As such, ramp meters are sometimes considered to promote longer trips.
- Socio-economic considerations – Ramp meters may shift traffic congestion and associated impacts from one location to another. In areas where traffic problems are minimized, or are all together eliminated, property values may increase due to the fact that these areas are seen more favorably. Consequently, in areas where traffic congestion and associated problems are increased, property values may decrease. Ramp meters have the potential to create queues on the ramp that may flow into the adjacent arterial intersection. This may cause more delay on the arterial which negatively affects the immediate neighborhood and surrounding businesses.
Despite the benefits of ramp meters, there are several other considerations practitioners need to consider before selecting this strategy, or any of the other strategies discussed in this chapter. Practitioners need to consider if resources (e.g., staff, funding, equipment) are available internally to support ramp metering programs and if these systems can be effectively maintained. If resources to deploy, operate, and maintain these systems are not available, ramp metering programs will ultimately fail. In addition to these resources, staff must also consider how they intend to enforce ramp meter compliance, and must investigate if law enforcement is committed to the ramp meter program. Considerations such as these are discussed in further detail in Chapters 7, 8, and 9. |
|
 Closing an entrance or exit ramp to all traffic, or to specific vehicle classes on a temporary, intermittent, or permanent basis is a strategy generally considered for safety benefits at locations with severe geometric limitations. Ramp closures change traffic patterns that have been established over a substantial period of time and therefore should be rarely considered for situations where another ramp management strategy may be successfully deployed. Additionally, before a decision is made to close a ramp, consideration should be given for re-routing traffic that normally uses the ramp. This may include development of detour routes and public information/involvement campaigns to disseminate information to the public. Besides locations with severe geometric deficiencies, ramp closures may also be a viable option for managing special event traffic or controlling traffic in or around work zones. Closing an entrance or exit ramp to all traffic, or to specific vehicle classes on a temporary, intermittent, or permanent basis is a strategy generally considered for safety benefits at locations with severe geometric limitations. Ramp closures change traffic patterns that have been established over a substantial period of time and therefore should be rarely considered for situations where another ramp management strategy may be successfully deployed. Additionally, before a decision is made to close a ramp, consideration should be given for re-routing traffic that normally uses the ramp. This may include development of detour routes and public information/involvement campaigns to disseminate information to the public. Besides locations with severe geometric deficiencies, ramp closures may also be a viable option for managing special event traffic or controlling traffic in or around work zones.
Benefits
Little research is available that document the benefits of ramp closures in improving exiting traffic conditions and safety. Advantages of ramp closure in regard to freeway operations are generally thought to include:
- Reduction in total number of crashes and crash rate, especially rear-end and sideswipe collisions.
- Reduced neighborhood impacts.
- Increased freeway vehicle throughput.
- Increase in freeway vehicle speeds.
These benefits are generally supported by an experiment of peak-period ramp closures conducted on a 5 km (3 mi) stretch of the John C. Lodge Freeway in Detroit. This experiment produced the following findings:[4]
- Freeway volumes increased 3.5 to 13.7 percent.
- Average freeway speed (averages over all periods and locations) increased from 43 to 60 km/h (27 to 37 mi/h) in the AM peak period and from 41 to 62 km/h (25 to 39 mi/h) in the PM peak period.
Impacts
Potential negative impacts of ramp closure in regard to freeway operations include:
- Potential for traffic diversion.
- Promotion of longer trips.
- Increases in fuel consumption and emissions (for diverted trips).
- Socio-economic changes (e.g., neighborhood and business impacts).
- Changes in local land values.
|
| 5.2.3 Special Use Treatments |
|
|
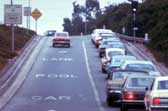 Special use treatments for ramp management focus on providing preferential treatment to a specific class or classes of vehicles and can be applied to either entrance or exit ramps. Special use treatments include exclusive access to ramps for a class of vehicle (e.g., high occupancy vehicle (HOV), emergency, freight, or construction) or special lanes on a ramp for the exclusive use by these vehicle classes. Special use treatments often require regional support to be successfully deployed and funded. Special use treatments are best undertaken in a coordinated effort with other special use treatments and programs. For example, transit management programs may identify candidate ramps where transit vehicle priority considerations may be deployed. Special use treatments for ramp management focus on providing preferential treatment to a specific class or classes of vehicles and can be applied to either entrance or exit ramps. Special use treatments include exclusive access to ramps for a class of vehicle (e.g., high occupancy vehicle (HOV), emergency, freight, or construction) or special lanes on a ramp for the exclusive use by these vehicle classes. Special use treatments often require regional support to be successfully deployed and funded. Special use treatments are best undertaken in a coordinated effort with other special use treatments and programs. For example, transit management programs may identify candidate ramps where transit vehicle priority considerations may be deployed.
Benefits
Advantages of special use treatments in regard to freeway operations include:
- Promotion and greater acceptance of high-occupancy trips through incentives such as travel time savings.
- Reduction in vehicle emissions.
- Travel time savings for specific vehicle classes.
- Improved incident response.
- Reduced delay by separating or removing different vehicle types.
- Improved safety by controlling the mix of different vehicle types.
Impacts
Potential negative impacts of special use treatments in regard to freeway operations include:
- Increased merging complexity (merging between dedicated HOV lanes and regular use lanes), which could lead to safety problems.
- Possible increased congestion in regular use lanes (if the special use lanes were converted from regular use lanes).
- Equity of infrastructure issues (i.e., a new interchange for transit buses may not be perceived as a fair use of infrastructure if a very small percentage of commuters ride transit or if very few buses will be able to use the new interchange).
|
| 5.2.4 Ramp Terminal Treatments |
|
|
Ramp terminal treatments include signal timing improvements, ramp widening, additional storage or new turn lanes on arterials, and improved signing, and pavement markings on or adjacent to ramps. These treatments are geared to improving localized problems at either entrance or exit ramp terminals. Treatments focus on providing solutions to problems at the ramp/arterial intersection, on the freeway (e.g., exit ramp traffic queuing onto the freeway mainline), or on freeway ramps. At exit ramp terminals, the strategies are aimed at reducing queue spillback on the freeway, but may also be aimed at improved arterial flow by limiting the amount of freeway traffic that can access certain areas in the arterial network. At entrance ramps, the strategies generally are aimed at:
- Better coordination of ramp terminal signal timing and ramp metering timing.
- Sufficient storage space, either on the ramp or in turn lanes on the arterial, to contain queues from ramp meters or from a congested roadway.
- Signing to inform motorists approaching a ramp what to expect at the ramp. The types of signing range from information on the status of ramp meters (on or off), freeway congestion, or ramp closure.
Benefits
Advantages of ramp terminal treatments in regard to freeway operations generally include:
- Reduced delay.
- Reduced queuing.
- Improved safety.
- Reduced downstream arterial impacts.
Benefits of ramp terminal treatments will vary depending on the type of treatment implemented. Additional information on the benefits of ramp terminal treatments is provided later in this chapter.
Impacts
The direct negative impacts associated with ramp terminal treatments in regard to freeway operations are generally minor, but may include:
- Increased trip length and travel time, in the case of turn restrictions.
- Increased traffic signal delay for some traffic movements for certain signal timing strategies.
|
| 5.3 Ramp Metering |
As briefly stated earlier in this chapter, ramp metering is the use of traffic signals (posted either above or alongside freeway on-ramps) to control the flow of traffic entering a freeway facility. Ramp metering can be an effective tool to address congestion and safety concerns that either occur at a specific point or along a stretch of freeway. The application of ramp metering, however, must be consistent with overall agency and regional transportation policies, goals, and objectives. Ramp meters should not be deployed until metering goals and objectives are integrated into a larger transportation management program and policies that support ramp meter implementation exist.
Assuming that ramp metering fits into the transportation management program, there are several aspects associated with ramp meter operation that practitioners should be aware of prior to making the decision of whether or not to implement ramp meters. These aspects affect how a ramp meter or system of ramp meters control traffic based on agency goals and objectives and on local conditions. Aspects of ramp metering that need to be considered are listed below:
- Metering Strategy.
- Geographic Extent.
- Metering Approaches.
- Metering Algorithms.
- Queue Management.
- Flow Control.
- Signing.
Each of these aspects is described in greater detail in Sections 5.3.1 through 5.3.7. |
|
An effective and successful ramp metering strategy meets the goals and objectives it was intended to address. In general, a successful implementation strikes a balance between freeway mainline improvements (generally speed increase and crash reduction) and vehicle wait times and queuing on entrance ramps. In other words, the metering strategy seeks to improve conditions on the freeway while minimizing, to the greatest extent possible, queuing and delay on the ramp. Queuing and delay are impacts that result as vehicle demand approaches freeway capacity and traffic flow begins to deteriorate. Ramp metering helps improve vehicle flow by reducing areas of turbulence.
Metering strategies should reflect the goals and objectives of the system. If the primary objective is to reduce crashes at specific areas near merge points and overall congestion is not a concern, then a ramp metering strategy that implements isolated ramp meters that meter on-ramps at demand (i.e., establishing the metering rate equal to or greater than the ramp demand) may be sufficient to meet the objective. On the other hand, if there is a complex set of objectives that include congestion reduction, regional mobility improvement (more attractive rideshare and transit alternatives), safety improvement, and perhaps others, then a system of ramp meters, probably managed by a central computer system, will be required with a more complex control strategy or algorithm.
There is not a pre-determined set of metering strategies from which one selects the most appropriate. A metering strategy embodies a set of decisions on individual aspects or elements of metering. Each decision should be made to best address the specific goals and objectives of the metering system. Specifics of these decisions are discussed below. Chapter 6 contains guidance on making these decisions. However, it is important to first discuss the philosophy of ramp metering in more depth.
Metering Philosophy
One of the goals of ramp metering is to control the amount of traffic entering a freeway facility such that the mainline flows (i.e., traffic demand) do not exceed maximum volume levels. As mainline flows increase, density increases with a corresponding decrease in traffic speed. As traffic demand approaches highway capacity, traffic flow begins to deteriorate. This increases the probability of flow breakdown (i.e., transition from a stable state to a congested state). This concept is illustrated in Figure 5‑1.
Figure 5-1 : Time Trends for Speed and Flow (Typical Morning Rush)
Ramp metering helps balance capacity and demand. Even in an uncongested state, a platoon of vehicles merging onto a freeway can cause enough turbulence (stop-and-go conditions as freeway vehicles slow down or quickly change lanes to accommodate the merging vehicles) to cause localized congestion around the ramp merge area. Metering can minimize these impacts by releasing vehicles in a controlled manner depending on the freeway mainline’s ability to accept traffic. With that said, however, it is important to note that motorists who wait longer than 15 seconds at the signal before proceeding through a ramp meter begin to believe that the meter is not working properly. [5] These beliefs lead to decreased compliance of the meter.
Ramp metering may also accomplish the following:
- Reduce the flow at metered ramps during certain time periods and redistribute it to later time periods. This reduces the flow at critical times to reduce congestion at merge points and at downstream bottlenecks.
- Change driver behavior. These changes include the time of day that metered ramps are accessed, the ramp they access, or their overall selected route. Some may also change mode of travel, but this is a relatively small proportion of the overall ramp traffic.
There have been several studies that have compared the properties of non-congested, stable flow with that of congested, unstable flow, including the transitions between these conditions. The pertinent points of this research is described with reference to Figure 5‑2. [6], [7], [8]
Figure 5-2 : Volume-Density Relationships
As volume increases, average density increases in an approximately linear relationship until the volume reaches the level qA. This near linear relationship implies little speed change. When volume exceeds qA, a probability arises that the flow will transition to an unstable state, which is generally characterized by lower volume, lower speed and higher density. In Figure 5‑2, this transition occurs in the region that is to the right of line AB. If transition has not occurred and if volume continues to increase, operation continues along AB toward point B. Transition will have occurred prior to reaching point B or at that point. After transition, unstable flow conditions may lie to the right of line OB in Figure 5‑2. Some researchers represent the average of flow conditions in this area by line AKj; however, the actual conditions may vary considerably.
Selecting a Metering Strategy
When deciding on or developing a specific metering strategy, practitioners need to first review the goals and objectives that metering is intended to address. Strategies that were developed or have been shown to address those objectives should be considered for implementation. The strategy that appears to best meet the goals and objectives of the system, consistent with local practice and resource constraints, should be selected. With that said however, most applications rely on metering rates that reduce the number of vehicles entering the freeway during certain portions of the metering period or over the entire peak period.
The primary objectives of ramp metering systems are to reduce freeway congestion and/or reduce freeway crashes. However, other objectives may also be addressed by ramp metering. For example, ramp metering may be used to reduce traffic that cuts through neighborhoods or sensitive areas. If traffic is avoiding freeway congestion by driving through these areas to access a downstream ramp, the downstream ramp can be metered. If this ramp feeds the bottleneck that causes the freeway congestion, the problem can be attacked on two fronts. First, ramp metering can improve the flow on the mainline, thereby reducing the need for traffic to cut through the neighborhood or sensitive area. Second, the ramp meter will add a delay to the cut-through trip, again reducing the incentive to cut through the area of concern. In this case, ramp delays may not be a major concern. If the ramp traffic during the metered time is primarily traffic diverting from upstream ramps and the ramp has enough storage, long delays may be advantageous in meeting the objective.
The following sections describe elements of a ramp metering strategy. In selecting a strategy one must consider each of the following elements:
- Geographic extent – the area that will be covered by ramp metering and whether the meters in that area will be operated in an isolated manner or as part of a larger system of meters.
- Ramp metering approach – local or system-wide and pre-timed or traffic responsive.
- Metering algorithm – the specific logic and calculations used to select or determine a metering rate.
- Queue management – how the metering rate will be affected by ramp queues and how the agency will keep queues at a manageable and acceptable level.
- Flow control – how traffic will be released from the meter, one at a time or two at a time in one lane or multiple lanes.
- Signing – how drivers will know that a ramp meter is on or off.
|
|
The geographic extent of ramp metering (i.e., whether or not one or more ramp meters will be deployed, and on which ramps on which freeways) is primarily based on program goals and objectives and the extent and locations of congestion or other traffic or safety problems or concerns. The geographic extent of ramp metering is determined by assessing whether or not problems are isolated or linked. In other words, are problems confined to a single location (i.e., isolated ramp) or do problems extend along a stretch of roadway containing two or more ramps (i.e., ramps that are linked)? The result of this assessment will affect the selection of an appropriate metering approach (see Section 5.3.3), and therefore is important to the selection of appropriate ramp management strategies. A suggested process to help agencies decide on an appropriate ramp metering strategy is described in Chapter 6. The following paragraphs explain the difference between isolated and linked problems.
Isolated
If traffic or safety problems on a freeway are isolated (i.e., occur at specific locations not adjacent to each other), ramp meters may be used independently to reduce the impact of the problem. When problems are isolated, a single ramp meter may be deployed at the location where the problem is occurring to resolve or reduce the impact of the problem. However, the negative impacts of ramp meter installations should be considered before meters are deployed. Any time a meter is deployed, the potential exists for impacts to occur such as those discussed in Section 5.2.1 (i.e., traffic diversion).
Linked
If traffic or safety problems on a freeway extend beyond the area of a single ramp, to include two or more adjacent ramps, ramp meters should probably be coordinated to effectively address the problem(s). Depending on the extent of the problem, ramp meters may need to be deployed along a freeway segment, an entire corridor, or system-wide to effectively address the problem.
|
| 5.3.3 Metering Approaches |
|
|
There are several approaches, and likewise algorithms, that can be used to meter ramps. This section defines each of the available metering approaches and discusses the advantages and disadvantages of each. This discussion acts as the foundation needed to select a specific metering approach and algorithm (see Chapter 6) based on local conditions and agency needs. A summary of metering approaches is provided in Table 5‑3.
Local versus System-Wide Metering
Ramp metering control schemes can be divided into two types, operating under two methods of control. The two types of control schemes are described below:
Table 5‑3 : Summary of Ramp Metering Approaches
|
Pre-timed |
Traffic Responsive |
Local |
- Appropriate for localized problems.
- Detection in the field is not needed.
- Requires periodic manual updates.
- Not effective for non-static conditions.
- Higher operations costs compared to traffic responsive systems.
|
- Appropriate for localized problems.
- Detection in the field is needed.
- Higher capital and maintenance costs compared to pre-timed systems.
- Yields greater benefits because it responds to conditions in the field.
|
System-wide |
- Appropriate for widespread problems.
- Detection in the field is not needed.
- Rarely used compared to system-wide, traffic responsive systems.
|
- Appropriate for widespread problems.
- Detection in the field is needed.
- Most useful for corridor, system-wide applications.
- Greatest capital and maintenance costs, but yields most benefits.
|
|
Local (or isolated) Control
Local control is a process of selecting metering rates based on conditions present at an individual ramp, rather than conditions along a segment of freeway, freeway corridor, or regional freeway network. Therefore, local control is appropriate for individual, non-adjacent ramps where problems are isolated. When local ramp metering is used, one or more ramps may be metered, however, there is no effort made to coordinate the effects of ramp meters. The primary concern is improving conditions and reducing congestion near the local ramp. In some cases, when local ramp metering is used, congestion problems at the local ramp may appear to be fixed, when in reality problems are transferred to or uncovered at downstream locations. In these situations, local ramp metering is not recommended.
System-wide (or coordinated) Control
Unlike local ramp metering, which only addresses a congestion- or safety-related problem at a specific location, system-wide control takes into account conditions beyond those adjacent to the ramp when determining metering rates for an individual ramp. To this extent, system-wide control can be used for a freeway segment, an entire corridor, or several freeway corridors where problems extend from ramp to adjacent ramp. The primary concern therefore focuses on improving freeway conditions for a broader freeway system(s). This makes system-wide control more flexible than local control in handling reductions in capacity that occur as a result of delay, collisions, and road blockages.
System-wide control systems typically include local control functionality to ensure that ramp meters remain operational even if communications are lost.
When multiple corridors are metered, consideration should be given to metering freeway-to-freeway ramps. Freeway-to-freeway ramp metering has been implemented in numerous areas such as Los Angeles, Seattle, Minneapolis, and Portland (Oregon). Chapter 6 provides considerations for freeway-to-freeway metering.
Pre-timed versus Traffic Responsive Metering
The two methods of controlling ramp meters are:
- Pre-timed (also referred to as time-of-day or fixed time). Meter rates are pre-set based on historical conditions and are fixed according to the time of day. Meters are activated based on pre-set schedules.
- Traffic-responsive. Real-time data are used to determine control parameters, perhaps including when ramp meters are active. Traffic responsive systems can also be constrained to operate only during selected times of day, based on policy decisions.
Pre-timed Metering
Pre-timed metering is the simplest and least expensive form of ramp metering for construction and installation. The low cost of this approach is due in part to the fact that detection and communication with a Traffic Management Center (TMC) is not required. However, this approach is also the most rigid because it cannot make adjustments for real-time conditions including non-recurring congestion (i.e., congestion that occurs as a result of weather, collisions, etc.). Similarly, as pre-timed metering rates are based on historical data, metering rates will typically be slightly (or significantly, if the rates are not updated periodically) too low or high for current conditions. This may result in less restrictive metering rates than optimal when congestion is heavy, resulting in more freeway congestion than necessary. It may also result in over restrictive metering rates when congestion subsides, resulting in unnecessary queuing and delays on ramps and arterials.
As such, pre-timed metering approaches are best applied to address traffic problems that are a direct result of recurring congestion or localized safety problems that can be reduced by simply breaking up the queues of vehicles entering the freeway. In other words, pre-timed metering is best used to address conditions that are predictable from day-to-day. Pre-timed metering may also be effective in construction zones or for other temporary metering, including special events that do not recur at the same place or on a regular schedule. The low cost of these systems make them attractive backups to other metering approaches or for situations when the primary approach fails. If there is no mainline or ramp detection, agencies must regularly collect data by alternative means in order to analyze traffic conditions on the freeway and determine the appropriate metering rates. The metering operation will require frequent observation so rates can be adjusted to meet traffic conditions.
Traffic Responsive Metering
Traffic responsive strategies use freeway loop detectors or other surveillance systems to calculate or select ramp metering rates based on current freeway conditions. Traffic responsive metering systems often produce results that are generally five to ten percent better than those of pre-timed metering. [9] A traffic responsive approach can be used either locally or system-wide. Both of these approaches are discussed below.
Local Traffic Responsive
Local traffic responsive metering approaches base metering rates on freeway conditions near the metered ramp (i.e., immediately upstream and downstream of the ramp, or at the merge point). Similar to pre-timed systems, local traffic responsive systems are proven strategies that are often used as backups when system-wide algorithms fail. Unlike pre-timed systems, surveillance of the freeway using traffic detectors is required. Although, more capital costs are required to implement traffic responsive systems, they more easily adapt to changing conditions and can provide better results than their pre-timed counterparts.
System-wide Traffic Responsive
The goal of system-wide traffic responsive systems is to optimize traffic flow along a metered stretch of roadway, rather than at a specific point on the freeway (as is the case of local traffic responsive systems). As such, metering rates at any given ramp will be influenced by conditions at other ramps within the system or corridor that is metered. Like local traffic responsive systems, system-wide traffic responsive systems require data from ramp detectors and local freeway detectors. In addition to these components, system-wide traffic responsive systems are unique in the fact that data is also needed from downstream detectors and/or upstream detectors at multiple locations, potentially from cross-street signal controllers, and from the central computer. System-wide traffic responsive systems have the most complex hardware configuration compared to the other metering approaches discussed so far (i.e., pre-timed and local traffic responsive). A summary of the advantages and disadvantages of system-wide traffic responsive systems is listed in Table 5‑4.
Metering at Demand
Metering at demand, also referred to as non-restrictive ramp metering, establishes the metering rate equal to or greater than the ramp demand. This approach is often used when the sole objective is to reduce the collisions on the mainline due to vehicle platoons that form on ramps; however, it may also be useful in delaying the onset of congestion on the freeway. Because the metering rate is set equal to ramp demand, the main benefit occurs when platoons are broken up to smooth the flow of traffic onto the freeway. Metering in this fashion is beneficial when ramp metering is first introduced in an area, since it allows motorists to become familiar with metering operations while not subjecting them to lengthy delays. As motorists become familiar with the system, meter rates can be set gradually more restrictive. Metering at demand may also be used at ramps within a corridor where traffic diversion is not acceptable or at specific ramps where there is not enough ramp capacity to support normal, more restrictive metering. In this regard, metering at demand ensures that queues do not spill onto the upstream arterial.
Table 5‑4 : Summary of Ramp Metering Approach Advantages and Disadvantages
| Metering Approach |
Advantages |
Disadvantages |
Pre-Timed
(Local & System-Wide) |
- No mainline detection devices are needed.
- No communication with a TMC is required.
- Simple hardware configuration compared to other approaches.
- Provides safety benefit by breaking up platoon of vehicles entering the freeway.
- Can effectively relieve recurring congestion if it is fairly constant day-after-day.
|
- Requires frequent observations so rates can be adjusted to changing traffic conditions.
- Often results in over restrictive metering rates leading to unneeded ramp queuing and delays (unless metering at demand is employed), which could affect arterial operations as well.
- Not responsive to unusual conditions, such as non-recurring congestion, which in turn can lead to public dissatisfaction.
|
Local
Traffic Responsive |
- Ability to better manage freeway congestion than pre-timed metering approaches (especially for non-recurring congestion).
- Operating costs are lower than pre-timed (due to automatic, rather than manual, meter adjustments), so the extra investment upfront may pay itself off over time.
|
- Higher capital and maintenance costs than pre-timed.
- Increased maintenance needs because of mainline detection.
- Reactive versus proactive. In other words, improvements are made after the fact, rather than before problems occur.
- Doesn’t consider conditions beyond the adjacent freeway section, making it difficult to optimize conditions for a downstream bottleneck.
|
System-Wide
Traffic Responsive |
- Provides optimal metering rates based on real-time conditions throughout the system or corridor.
- Some algorithms, such as the fuzzy logic algorithm, have the ability to address multiple objectives (e.g., freeway congestion and ramp queues).
|
- Requires mainline detection (both downstream and upstream detectors).
- Requires communication to central computer.
- Requires technical expertise for calibrating and implementing system.
- More expensive than local traffic responsive in implementation resources needed and communications maintenance.
|
|
Operator Selection of Meter Rate
Operator selection is a method, initiated by an operator, to select a metering rate based on prevailing conditions. Usually, operator selection is used to address special conditions such as incidents or special events, where the system algorithm does not respond effectively. |
| 5.3.4 Metering Algorithms |
|
|
The following sections describe several algorithms commonly used to meter ramps. All of the described algorithms are considered system-wide traffic responsive (although some have the built-in capability to operate as local traffic responsive).
Minnesota Zone Algorithm
The Minnesota Zone Algorithm, a stratified zone metering algorithm, attempts to balance traffic volumes entering and exiting predetermined metering zones to maintain a consistent flow of traffic from one zone to another. The algorithm incorporates entering and exiting traffic volumes of each zone and adjusts the metering rate at individual ramps to hold traffic as needed to maintain consistent traffic flow on the mainline. The algorithm selects one of six predetermined metering rates, ranging from no metering to a cycle length of 24 seconds (meter rate of 150 veh/h).
Metering zones are typically three to six miles in length, and may include several ramps that are not metered. The upstream portion of each zone is typically a free flow area not subject to high incident rates. The downstream portion of a zone typically includes areas defined as bottlenecks, where demand is the greatest.
Key features of the Minnesota Algorithm are:
- Ramp queue lengths are calculated based on queue detector measurements. The queue waiting time is limited to a prescribed value (e.g. four minutes), and the ramp meter rate is raised, as necessary to assure that this condition is met.
- Filtered mainline loop detector data at 30-second intervals is used for the meter rate setting algorithm.
- Spare capacity is calculated from mainline measured volume and speed data.
- Meters are grouped into zones. The intent of the metering algorithm is to restrict the total number of vehicles entering a zone to the total number leaving (including spare capacity). Zones are organized by “layers”. Higher-level layers feature larger zones with greater overlap among zones.
- Metering rates are calculated by distributing the spare capacity among the meters in a zone. If the required metering rates are lower than the minimum metering rates allowed, the metering rates are recalculated for the next higher layer. This process is repeated until all of the minimum rates are satisfied.
There are three variables by which vehicles can enter a zone (inputs) and three by which they may leave (outputs), as summarized in Table 5‑5 and Table 5‑6.
Table
5‑5 : Inputs of the Minnesota Algorithm
| Input Variable |
Input Variable Description |
(M) |
Metered Entrances: Entrance ramps onto any given freeway that are metered. |
(A) |
Upstream mainline volume: Total number of vehicles entering a zone through the station at the beginning of the zone. |
(U) |
Unmetered Entrances: Entrance ramps onto any given freeway that are not metered. |
|
Table 5‑6 : Outputs of the Minnesota Algorithm
| Output Variable |
Output Variable Description |
(X) |
Exits: All exit ramps off any given freeway. |
(B) |
Downstream Mainline Volume: Total number of vehicles leaving a zone through the station at the end of the zone often a result in an unreasonable volume. |
(S) |
Spare Capacity: If a zone is free-flowing with little traffic, there is said to be “spare capacity” on the mainline, and meters will not need to be as restrictive. For this reason, the spare capacity is regard as an output. |
|
The objective of a stratified metering algorithm, like the Minnesota Algorithm, is to regulate zones through metering so that the total volume exiting a zone exceeds the volume entering. For this to happen, the relationship of inputs and outputs within a given zone is as follows:
| |
M+ A + U £ B + X + S |
(5.1) |
| Therefore, |
M £ B + X + S – A – U |
(5.2) |
M is the maximum number of vehicles allowed to pass through all meters in any given zone between stations A and B. The key to stratified zone metering is to disperse the volume M throughout the zone suitably depending on demand (D) on the metered entrance ramps.
Based on demand, the following calculation gives a proposed rate for every meter to run in according to a percentage of M.
Rn = (M*Dn)/D (5.3)
Where Rn is the proposed rate for meter n (n is a meter within the zone), and Dn is the demand for the meter n.
Seattle Bottleneck Algorithm
The Seattle Bottleneck Algorithm calculates both a local control metering rate and a bottleneck metering rate. Calculation of the bottleneck rate occurs when both the following conditions are met:
- A threshold occupancy is exceeded.
- Vehicles continue to be stored in the section.
When conditions are not met, just the local control metering rate is determined.
The local metering rate is based on mainline occupancy adjacent to the metered ramp. For every metered ramp, a meter rate/mainline occupancy relationship is defined by five occupancy-metering rate pairs. The algorithm compares mainline occupancy adjacent to the ramp to pre-defined occupancy-metering rate pairs. The metering rate is determined by interpolating between these pairs for the actual mainline occupancy.
The bottleneck rate is based on traffic volumes downstream of the ramp. A specific number of upstream ramps are identified for every freeway segment, defined by two adjacent mainline detector stations. The bottleneck metering rate reduces the number of vehicles entering the mainline from these ramps by the number of vehicles stored in the freeway segment. Each ramp may have multiple bottleneck metering rates calculated, one for each downstream segment for which it has been identified. The algorithm selects the most restrictive of these as the final bottleneck metering rate.
The algorithm compares the final bottleneck metering rate to the local metering rate and selects the more restrictive of the two. The final step is to adjust the metering rate for ramp conditions, such as queuing. Two queue detection loops are located on each ramp. If traffic queues onto either of these, the metering rate is adjusted upward so the queuing can be eased. A larger adjustment is applied when queues reach the queue detector farthest back from the ramp meter. The final adjusted metering rate is implemented for each ramp.
Washington State DOT Fuzzy Logic Algorithm
The Washington State DOT (WSDOT) Fuzzy Logic Algorithm was developed in response to the limitations in the Seattle Bottleneck Algorithm. The drawbacks in the Seattle Bottleneck Algorithm include:
- When queuing occurs, the metering rate is adjusted upward without trying to reduce metering rates at nearby meters. The result is that queues form as the freeway conditions improve or stay stable. The metering rate becomes less restrictive when the queues reach the queue detectors, which eases the queuing but causes freeway conditions to deteriorate, which then triggers a more restrictive the metering rate, thereby causing ramp queues to form once again in an iterative manner.
- The Bottleneck Algorithm is reactive versus predictive, meaning that problems must first occur before solutions are set in place.
The Fuzzy Logic Algorithm was developed to address the drawbacks of the Bottleneck Algorithm. The WSDOT Training Manual for the fuzzy logic algorithm states: [10]
“There are four main reasons why FLC (Fuzzy Logic Control) is well-suited for ramp metering. 1) It can utilize incomplete or inaccurate data. 2) It can balance conflicting objectives. 3) It does not require extensive system modeling. 4) It is easy to tune.”
The first reason addresses inherent problems with data accuracy and reliability in loop detector data and the second addresses the cyclic nature of the Bottleneck Algorithm mentioned above. The Fuzzy Logic Algorithm uses mainline speed and occupancy data from the immediate upstream detector station and up to several downstream detector stations and occupancy data from ramp queue detectors to determine the best metering rate for conditions. Consideration of ramp queues is built into the algorithm rather than adjusting metering rates in a separate calculation.
Fuzzy Logic
Although the WSDOT algorithm provides an improvement compared to non-metered operation, observations over a period of time identified the following areas where the algorithm could be improved:
- The algorithm required congestion to develop before it could react.
- The algorithm tended to oscillate between controlling mainline congestion and dissipating excessive ramp queues.
Taylor, et al. (15) describe a new algorithm employing fuzzy logic designed to address these deficiencies. Fuzzy logic has the ability to address multiple objectives (by weighing the rules that implement these objectives) and to implement the tuning process in a more user-friendly fashion (by the use of linguistic variables rather than numerical variables). Rule groups used by the algorithm include:
- Local mainline speed and occupancy.
- Downstream speed and occupancy.
- Ramp queue occupancy.
- Quality of the ramp merge.
There are six inputs to the fuzzy logic controller (FLC). These include speed and occupancy from the mainline and downstream detector stations, the queue occupancy detector and the advanced queue occupancy detector (at the upstream end of the ramp storage location). “Fuzzification” translates each numerical input into a set of fuzzy classes. For local occupancy and local speed, the fuzzy classes used are very small (VS), small (S), medium (M), big (B), and very big (VB). The degree of activation indicates how true that class is on a scale of 0 to 1. For example, if the local occupancy were 20 percent, the medium class would be true to a degree of 0.3, and the big class would be true to a degree of 0.8, while the remaining classes would be zero (top of Figure 5‑3). The downstream occupancy only uses the very big class, which begins activating at 11 percent, and reaches full activation at 25 percent (bottom of Figure 5‑3). The downstream speed uses the very small class, which begins activating at 64.4 km/hr and reaches full activation at 88.5 km/hr. The queue occupancy and advance queue occupancy use the very big class. For ramps with proper placement of ramp detectors, the parameter defaults are for activation to begin at 12 percent, and reach full activation at 30 percent. For each input at each location, the dynamic range, distribution and shape of these fuzzy classes can be tuned.
Figure 5-3 : Fuzzy Classes
After the fuzzy states have been developed, weighted rules are then applied to develop the metering rate. Examples of weighted rules are shown in Table 5‑7.
Table 5‑7 : Example Rules Used to Develop Fuzzy Logic Meter Rate
| Rule |
Default Rule Weight |
Rule
Premise |
Rule Outcome |
6 |
3.0 |
If local speed is VS AND local occupancy is VB |
Metering Rate is VS |
10 |
4.0 |
If downstream speed is VS AND downstream occupancy is VB |
Metering Rate is VS |
12 |
4.0 |
If advance queue
occupancy is VB |
Metering Rate is VB |
|
Note: (VS) Very Small, (VB) Very Big
The last step is to generate a numerical metering rate based on the rule weight and the degree of activation of each rule outcome.
Denver, Colorado Helper Algorithm
The Denver, Colorado Helper Algorithm is based on a local traffic responsive algorithm with centralized control. Under centralized control, meters are polled every 20 seconds to collect detector and metering data. If the meter is operating at its most restrictive metering rate and if the detector’s threshold occupancy value is exceeded, the algorithm defines the meter as “critical”. Based on this classification, the algorithm begins to override upstream ramp control. If a ramp remains critical for more than one minute (three consecutive, 20-second periods), the algorithm reduces at the next upstream meter by one metering rate level. The algorithm continues this process for every meter within the system for each consecutive 20-second period until the problem is resolved or until all ramps have been overridden.
The algorithm assigns up to seven ramp meters to as many as six groups or zones (maximum of 42 ramp meters).
Northern Virginia Algorithm
The Northern Virginia Algorithm bases the meter rate in a particular “zone” on predicted demands. The algorithm defines a link as the freeway segment between two entrance ramps. Metering zones can include up to ten links.
The meter rate is determined as the difference between the predicted demand and the capacity of the link that contains the ramp. The predicted arrival demand is calculated sequentially in each zone starting at the link furthest upstream in the zone. The available capacity is sequentially calculated in each zone starting at the link furthest downstream in the zone.
SWARM Algorithm
The System-Wide Area Ramp Metering (SWARM) Algorithm is used for coordinated, system-wide metering approaches. The SWARM Algorithm essentially is the product of two independent control algorithms collectively referred to as SWARM1 and SWARM2.
SWARM1, the more complex of the two, uses previously recorded data to forecast future volumes. Based on this forecast, SWARM1 determines the onset of congestion and restricts real-time volumes from exceeding pre-determined saturation values. The general flow of information for the SWARM1 Algorithm is shown in Figure 5‑4.
Figure 5‑4 : SWARM1 Data Flow
SWARM2 is basically a local traffic responsive algorithm. The overall SWARM algorithm compares the metering rates of both SWARM1 and SWARM2 and picks the more restrictive of the two. |
|
In part, the success of a ramp metering approach depends on the ability to smooth the flow of traffic entering the freeway while adequately containing queues on the ramp. When demand exceeds the metering flow rate, and storage on the ramp cannot handle the excess demand, traffic will queue onto the adjacent arterials, causing delays and increased risk of rear-end crashes. Ramp metering approaches must consider whether and how ramp queues may be managed.
No Queue Limits
Few metering algorithms do not take queue lengths into account at all. If there is no queue management in place, queues may back up onto surface streets. Generally, queue lengths are a sensitive issue with local agencies and the surrounding neighborhood, as well as with the drivers in the queue. Approaches that do not take ramp queues into account are not recommended unless metering rates will always be set at or above ramp demand.
Queue Adjustments
Most ramp metering algorithms have specific philosophies for managing queues, either by:
- Providing sufficient storage for worst-case queues, or
- Detecting queues and adjusting metering rates accordingly.
- Queue detectors are placed on ramps upstream of the meter stop bar at critical locations.
- If a queue is detected at the detector, the meter rate is increased.
- Some algorithms will increase at one level when the queue first extends to the detector and increases the metering rate at a higher level if the queue still exists after a programmable amount of time.
- Some systems have a second queue detector further upstream that will cause the metering rate to increase sharply to more quickly reduce the queue length.
- Some algorithms take the increased metering rate caused by ramp queues at one ramp into account at other ramps and will adjust those metering rates downward to try to keep the level of traffic on the freeway close to the pre-queue adjustment level.
- Some algorithms, like the fuzzy logic algorithm, use queues as an integral part of the algorithm that calculates the metering rate.
|
|
Flow control refers to the manner and rate by which vehicles are allowed to enter a freeway from a ramp meter. The theoretical maximum rate that vehicles merge with traffic on a freeway facility and the length of queues that result from metering applications is in part a result of the type of flow control implemented at the ramp. The selection of a flow rate depends on several factors. These factors include ramp length, number of lanes, and traffic volume.
There are three strategies for controlling the flow of vehicles entering freeway facilities from a ramp. These strategies are described in the following sub-sections and summarized in Table 5‑8.
Table 5-8 : Characteristics of Ramp Metering Flow Controls [3] [11]
Flow
Control Scheme |
No. of Lanes |
Cycle Length |
Approximate Range of Metering Rates
(veh/h) |
Capacity (veh/h)* |
One
Vehicle
Per Green |
1 |
4 – 4.5 sec. |
240-900 |
900 |
Multiple Vehicles Per Green |
1 |
6 – 6.5 sec |
240-1200 |
1100-1200 |
Tandem |
2 |
|
400-1700 |
1600-1700 |
|
* Depending on driver behavior, capacities slightly greater than these shown may be possible.
One Vehicle per Green Metering (Single Lane)
One vehicle per green metering permits vehicles to enter the freeway one-by-one, as vehicles are detected. When a vehicle approaches the ramp meter, it passes over the presence or demand detector which notifies the signal to turn green. As a vehicle passes over the passage detector, the signal is then notified to terminate the green cycle. If a vehicle is not present on the demand detector, the signal indication remains red until a vehicle is detected. One vehicle per green metering has a capacity of 900 vehicles per hour (veh/h). If a capacity greater than 900 veh/h is desired, a multiple vehicle per green approach may be suitable.
Multiple Vehicles per Green Metering (Single Lane)
The multiple vehicles per green approach (also known as platoon or bulk metering) allow two or more vehicles to enter the freeway facility per green cycle. Typically two and in some cases three vehicles are permitted to pass the ramp meter per each green signal indication. Although this approach doubles or triples the throughput of vehicles per green indication, similar results cannot be expected for vehicle throughput as longer cycle lengths are required. Compared to the one vehicle per green approach, the multiple vehicle per green approach results, on average, in an increase in throughput of 200-400 veh/h.
Tandem or Two-Abreast Metering (Dual Lane)
Tandem or two-abreast metering permits two or more vehicles to enter the freeway facility per cycle, depending on the number of lanes at the meter (one vehicle per lane). To smooth the flow of vehicles merging with freeway traffic, vehicles in each lane are released in a staggered fashion.
Tandem metering may be combined with multiple vehicles per green in some locations when demand is extremely heavy. |
|
When ramps are metered, appropriate signing needs to be implemented along the ramp as well as on nearby arterials to alert motorists to the presence and operation of ramp meters and to the specific driving instructions they need to perform when approaching a ramp. Signing needs for metered ramps also depend on the selected metering approach, number of available lanes, and whether or not HOV policies are in place. A description of the possible signing types for metered ramps is provided below.
Advance Warning
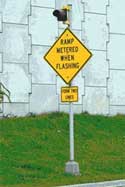 Drivers need to be alerted to the presence and operation of ramp meters in advance of the last decision point for the ramp. In general, advance warning on the arterial is needed to inform motorists of the status of the specific ramp(s) where metering operations are in effect. Advance warning on the ramp is needed to reconfirm the status of metering operations (i.e., meters on or meters off). Drivers need to be alerted to the presence and operation of ramp meters in advance of the last decision point for the ramp. In general, advance warning on the arterial is needed to inform motorists of the status of the specific ramp(s) where metering operations are in effect. Advance warning on the ramp is needed to reconfirm the status of metering operations (i.e., meters on or meters off).
For arterial applications, many agencies install advanced warning signs that consist of a sign and flashing beacon to advise motorists of the presence and operation of ramp meters. [12] The need for these types of signs varies with the metering application in place. For instance, advance warning signs should always be implemented when traffic conditions determine the hours of operation. Because these meters may be turned on and off and different times each day, drivers cannot predict when they may be on and need to be informed of ramp meter status before they enter the ramp. Advance warning signs for meters that are activated on a strict time-of-day basis may not be needed, but consideration should be given to installing advance warning signs where drivers may not be able to see the ramp meter signal head or the back of the queue in time to safely stop. Also, if meters always operate on a strict time-of-day basis and there is no variation, then a static sign that states the hours of metering operations can substitute for an advance sign with warning beacon.
Stop Here on Red or Wait Here for Green
 Signs that read “Stop Here on Red” or “Wait Here for Green” should be placed on one or both sides of the on-ramp at the stop bar to identify the stopping location. This sign helps align motorists over the demand detectors placed upstream of the stop bar. Signs that read “Stop Here on Red” or “Wait Here for Green” should be placed on one or both sides of the on-ramp at the stop bar to identify the stopping location. This sign helps align motorists over the demand detectors placed upstream of the stop bar.
“X” Vehicle(s) per Green
This sign is used to indicate the number of cars that are allowed to pass on each green signal. It should be placed at every ramp signal. A variation on this sign is “X” vehicles per green per lane.
Form Two Lines When Metered
In some locations, ramp shoulders are used during metering operations to help manage queues. Other locations convert wide on-ramps to a de-facto two-lane configuration during ramp meter operations. This sign should be positioned near the beginning of the queue storage area and is used to convert the single-lane on-ramp into a dual-lane queue storage area. |
| 5.4 Ramp Closure |
Ramp closure is one of the simpler forms of controlling traffic on ramps. Closures may involve controlling automatic gates or manually moving barriers or gates at the ramp. More extreme methods such as physically removing the ramp are also options for permanent applications. Regardless of the method used to close the ramp, closures will have a significant impact on existing traffic patterns. Closures will result in traffic diverting to upstream and downstream ramps. As a result, traffic volumes and congestion will likely increase on nearby ramps and adjacent arterials. Similarly, traffic problems that had once occurred at the closed ramp may shift to other locations. Considering these impacts, ramp closures should only be considered for severe safety problems that cannot be addressed through any other ramp management technique.
Little research is available that documents the effects ramp closures have on traffic operations. The results of the research that is available indicate that although ramp closures have a significant impact on traffic patterns, when properly conceived and implemented, they can increase average travel speeds and decrease delay on freeways (see Section 5.2.2). Safety issues may arise at locations where ramps are closely spaced and weaving is made difficult or where on-ramps have inadequate acceleration lanes. Ramps constructed in central business districts are often closely spaced and ramp closures there maybe a better solution to congestion and safety problems than in suburban areas where ramps tend to be more widely spaced. Other situations that may require ramp closures include construction, major incidents, emergencies including severe weather conditions, or special events. |
|
There are three general types or classifications of ramp closures. The three types of ramp closures are:
- Permanent.
- Temporary.
- Time-of-day or Scheduled.
Each type of ramp closure is discussed in greater detail below, and the advantages and disadvantages of each are summarized in Table 5‑9.
Permanent
Of the three types of ramp closures that will be discussed in this section, permanent ramp closures will have the most significant impact on existing travel patterns and, as such, are the least preferred approach. Although temporary and scheduled ramp closures restrict access to ramps at certain times, motorists are still able to use ramps during the period(s) when they are open. Permanent ramp closures do not give the motorists the option of using the ramp again, permanently affecting motorist travel patterns, surrounding land values, and access to and from nearby businesses. As a result of these impacts, permanent ramp closures are rarely implemented. However, severe safety problems and impacts of ramp traffic on surrounding areas may necessitate permanent ramp closures when all other efforts to resolve these problems fail. Careful consideration of the possible impacts of closure should be considered before ramps are closed.
Table 5‑9 : Advantages and Disadvantages of Ramp Closure Methods
| Closure Method |
Advantages |
Disadvantages |
Permanent |
- One time cost (i.e., no costs associated with on-going operations).
- On-going operations not needed.
|
- Significant impact on existing travel patterns.
- Significant socio-economic impact.
|
Temporary |
- Less permanent impacts than permanent closures.
- Significantly reduces conflicts between vehicle types during construction or maintenance on or near the ramp.
|
- Moderate impact on existing travel patterns.
|
Time-of-Day/Scheduled |
- Less permanent impacts than permanent closures.
- May significantly improve mobility during peak periods or others times of recurring congestion.
|
- Moderate impact on existing travel patterns.
- On-going operations costs.
- Greater risk of vehicle/person conflicts when manual methods are used to close the ramp.
|
|
Temporary
Ramps may be considered for closure on a temporary basis during construction, to perform maintenance activities on the ramp, to manage special events, or when severe weather conditions threaten safety. Construction and maintenance related closures eliminate potential conflicts between through traffic and construction/maintenance vehicles. The more potentially dangerous conflicts between construction workers and through traffic are also eliminated, creating a safer working environment. The benefits of temporary ramp closures, however, are not limited to safety. Temporary ramp closures may expedite construction or maintenance activities by freeing up space in and around the work zone. This may increase productivity and lead to considerable time and cost savings as projects are more likely to be completed on time.
 Temporary ramp closures may also provide a critical tool in managing traffic near a special event venue. In some situations, heavy special event traffic demands may overwhelm the ability of the roadways to handle traffic. Closing ramps may be the only viable solution to effectively manage special event traffic. Ramp closures for special events may be modified to allow access only to certain types of vehicles, such as emergency vehicles, delivery vehicles, or HOVs (see Section 5.5 for a discussion of special use treatments). In any case, ramp closures should only be used for special events when they are part of the overall special event traffic management plan. Temporary ramp closures may also provide a critical tool in managing traffic near a special event venue. In some situations, heavy special event traffic demands may overwhelm the ability of the roadways to handle traffic. Closing ramps may be the only viable solution to effectively manage special event traffic. Ramp closures for special events may be modified to allow access only to certain types of vehicles, such as emergency vehicles, delivery vehicles, or HOVs (see Section 5.5 for a discussion of special use treatments). In any case, ramp closures should only be used for special events when they are part of the overall special event traffic management plan.
Ramps may also be closed on a temporary basis when severe weather conditions are present or when travel on a roadway is unsafe. For example, freeway entrance and exit ramps may be closed when significant amounts of snow, ice, or water cover roadways. Weather related closures prevent vehicles from entering the freeway facility and through hazardous condition. Typically, ramps will remain closed until conditions improve, or when maintenance vehicles have finished clearing the roadway of snow or debris.
Time-of-Day or Scheduled
Ramp closures may occur at specific times of day, most notably during the morning and afternoon peak periods when recurring congestion is likely to pose a severe safety problem. Weaving at the ramp freeway merge point and backups on the ramp that extend onto the adjacent arterial are two safety problems that may be resolved through time-of-day/scheduled ramp closure.
Motorists that are unfamiliar with the time-of-day/scheduled approach may become confused over the status of a ramp (i.e., open or closed) when approaching it. Therefore, it is recommended that additional measures be implemented to reduce driver confusion. Such measures may include additional signing and/or establishing a specific time that the closures will occur at each day and not deviating from this time. |
|
There are three commonly accepted methods to close a ramp. These methods are discussed below. In all cases, signing is needed to alert motorists that ramps will be closed. Signing should remain posted until ramps are officially closed and methods used to close the ramp make it obvious to motorists that the ramp has been closed. When ramps are closed on a temporary basis, additional signing may be needed to indicate the current status of the ramp (i.e., open or closed).
Manual Barriers
Manual barriers can be classified as being either portable or fixed. Portable barricades include gates, cones, and other equipment that can be moved from one location to other. As they can be physically moved from one location to another, portable barricades are typically reserved for temporary closures, though this is not to say that they cannot be used to close ramps on a more frequent basis. Doing so, however, may not be as practical, safe, and cost effective since staff must physically travel to the site to close and re-open the ramp. In these situations, fixed barricades may be more practical. Fixed barricades include vertical and horizontal swing gates that have been permanently installed alongside the ramp. Since fixed barricades have been permanently installed, staff are not required to haul gates to and from the ramp, but rather simply swing the gate into position every time the ramp is closed or opened (manual process). However, the disadvantage of fixed barricades lies in the fact that they cannot be moved from one location to another, and are therefore not as flexible as portable barricades in their day-to-day use. In other words, portable barricades can be used for any ramp, whereas fixed gates can only be used for one specific ramp. Other drawbacks of fixed barricades include:
- Expensive to install compared to portable barricades.
- Requires significant clear space (horizontal or vertical) to swing.
- Is subject to conditions in the field that can prevent their use, such as parked cars, snow drifts, and other large objects that cannot be easily removed.
- Barrier equipment mounted on the side of the road represents a fixed-object safety hazard.
Regardless of whether a barricade is portable or fixed, the fact remains that manual barriers must be deployed by a person in the field. If staff are not available, manual barriers cannot be deployed. Similarly, since staff must be available to deploy these barriers, their use is not as practical for time-sensitive closures (i.e., time-of-day closure). In addition, manual barriers also pose a greater safety threat than their automated counterparts, especially portable barricades, due to the fact that the individual responsible for deploying them must walk out onto the roadway to deploy them. Some portable barricades can also be blown down by high winds, thus creating confusion as to whether or not the ramp is open.
Automated Barriers
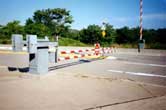 An alternative to the labor intensive, manual methods of ramp closure are automated barriers. Automated barriers installed at entrance or exit ramps increase the flexibility of closing a ramp, and may prove more beneficial for long-term, permanent applications. Automated barriers can be activated from a TMC or other remote facility or in the field by pressing a button at the control assembly. If the location cannot be visually monitored at the TMC or other remote facility, the latter option may be preferred since staff located in the field can determine if it is safe to close a ramp at any given moment. An alternative to the labor intensive, manual methods of ramp closure are automated barriers. Automated barriers installed at entrance or exit ramps increase the flexibility of closing a ramp, and may prove more beneficial for long-term, permanent applications. Automated barriers can be activated from a TMC or other remote facility or in the field by pressing a button at the control assembly. If the location cannot be visually monitored at the TMC or other remote facility, the latter option may be preferred since staff located in the field can determine if it is safe to close a ramp at any given moment.
Like any other automated system, automated barriers have the potential to stop working at any given time, increasing the risk of a serious safety issue. This issue can be mitigated with on-going preventative maintenance program. However, other issues, like driver disregard of automated gates can be a more continuous, long-term maintenance problem. For instance, DOT staff in Milwaukee, Wisconsin have stated that gates used to close ramps to I-43 are often broken by motorists determined to use the ramp even though the gate is closed.
Enforcement Personnel
The last commonly used method of closing a ramp, is completed through stationing enforcement personnel at the ramp. Enforcement personnel may be an effective means of closing a ramp when automated systems are not present and when maintenance staff are not available to deploy temporary barricades. In these situations, enforcement personnel may be used on a temporary basis to prevent traffic from accessing the ramp until maintenance personnel can deploy barricades. The use of enforcement personnel should be held to only severe situations in which the ramp cannot be otherwise closed. The use of enforcement personnel for any other condition is not the best use of an officer’s time, and using personnel in this way can pose a threat to their safety. |
| 5.5 Special Use Treatments |
Special use ramp management treatments include strategies that give “special” consideration to a vehicle class or classes to improve safety, improve traffic conditions, and/or encourage specific types of driving behavior. The most popular special use ramp management application is the designation of high occupancy vehicle (HOV) bypass lanes or ramps. Designation of HOV bypass lanes and ramps limit use of these facilities to only those vehicles with multiple occupants in an effort to reduce overall freeway delay. |
|
When ramps are metered, HOV bypass lanes allow HOVs (i.e., public transit vehicles, carpools, vanpools) and emergency vehicles to bypass metered vehicles without having to stop. When ramps are not metered, HOV lanes offer a means for HOV and transit traffic to bypass queues built up from traffic entering the freeway. However, HOV bypass lanes should be designed properly to reduce the potential safety hazard posed by single-occupant violators who attempt to jump metered queues by using the bypass lane. |
|
Special use treatments also come in the form of separate ramps that are used to give preferential treatment to a specific class or type of vehicle. Construction vehicles, delivery vehicles, and trucks are three classes that may be targeted for special use ramp treatments; however, transit and other HOVs may be considered as well. In regard to construction vehicles, delivery vehicles and trucks, special use applications are focused on reducing conflicts between these vehicles and other vehicles that typically use ramps. In addition, special use applications for these types of vehicles may reduce the impact these vehicles have on neighborhoods. In regard to transit and HOV vehicles, special use applications may include freeway to park-and-ride direct fly-over ramps. These ramps provide travel time incentives for vehicles designated as HOV by allowing them to by-pass arterials leading to and from the freeway and park-and-ride.
Special use applications that give priority to certain types of vehicles must support policies that are in place and conform to local, state and regional goals and objectives. Without support, special use applications may not receive the needed funding to implement or maintain strategies. Additionally, special use ramp applications may be negatively perceived by those who can’t use them. Therefore, additional public information campaigns may need to reassure the public as to the need for and benefits of special use applications. Finally, agreements must be made with law enforcement, so special use treatments are actively enforced.
Case Study: Truck-Only Ramps
In 1999, the Southern California Association of Governments (SCAG) commissioned a truck lane feasibility study for SR-60. SR-60 is a major east-west corridor from downtown Los Angeles, connecting back with Interstate 10 east of LA in Coachella Valley. Caltrans has estimated that some segments of SR-60 carry as much as 28,000 trucks each day (15% of the total traffic). Several truck lane configurations were evaluated, but all had common features. The objective was to build a limited access facility that would serve longer-haul freight movements.
The configurations were based on the assumption that trucks would have their own entrance and exit ramps to and from the freeway. The “high” option consisted of exclusive (and physically separated) truck ramps at freeway-to-freeway interchanges. The “low” option used existing mixed flow ramps with additional truck-only lanes. Additional planning and engineering studies began in 2003.
Another study, also conducted in Los Angeles, examined a proposed interchange concept for I-710. This interstate is a major access route between downtown Los Angeles and the Ports of Los Angeles and Long Beach. In 2000, the Port of Long Beach estimated that it generated 40,000 daily truck trips, the majority of which accessed I-710 for a portion of their trip.
The proposed interchange concept for the I-710 truck lanes uses the existing general purpose (GP) ramps and builds additional truck lanes. The concept involves constructing truck lanes on an elevated structure. Initially, trucks would use dedicated lanes on the existing interchange ramps, merge into the mixed flow traffic and then enter the truck lanes from the mixed flow lanes. Exiting trucks would first exit to the mixed flow lanes and then access the truck-only exit ramps. Configuring the access points for the high truck volume interchanges limited the number of entry and exit points as well as where they could be placed. This design reduces the cost of building separate truck-only interchanges and substantially reduces the right-of-way acquisition that would be necessary. However, it does not address all of the merge problems that trucks face throughout the corridor. The redesign of weaving sections must be accomplished as an additional feature of the design.
These two Southern California studies suggest that truck lanes and truck-only ramps can be an important tool for improving freight mobility in congested urban areas. When planning for successful truck lanes, the application is not solely dependent upon high truck volumes. It is also a function of the length of truck trip (short distances during the midday period). For the majority of truck trips, expanded multi-purpose capacity may provide the greatest overall benefits. However, in corridors with concentrated origin-destination locations and extremely high volume facilities (as in corridors with inter-modal facilities and ports – such as the I-710 project in Los Angeles), truck lanes and truck-only ramps may be feasible. This is especially true if the existing facilities operate in congested conditions throughout most of the day. And, finally, the safety benefits of separating auto and truck traffic may be one of the most compelling reasons to consider dedicated truck lanes. The role that truck-auto interactions play in accident levels should be accounted for in the analysis.
|
| 5.6 Ramp Terminal Treatments |
Ramp terminal treatments are those that can be implemented at the ramp/arterial intersection to better manage traffic entering or exiting the ramp facility. Ramp terminal strategies are focused on managing queues that form on the ramp that spill back onto either the adjacent arterial or the freeway facility. Ramp terminal strategies implemented at entrance ramps will provide better flow of arterial traffic not destined for the freeway, whereas ramp terminal strategies implemented at exit ramps will reduce queues that flow onto the freeway facilities lessening the frequency of rear-end collisions occurring on the mainline. Queues that form on the ramp facility create unsafe conditions that may be minimized or altogether eliminated through consideration and implementation of one or more of the following strategies.
There are at least four different strategies that can be implemented at ramp terminals that can improve traffic conditions (e.g., traffic flow and safety) on or near ramp facilities. The cost to deploy each of these strategies is relatively low when compared to the other ramp management strategies discussed in this handbook. These strategies are listed below and discussed in Sections 5.6.1-5.6.4, respectively.
- Adjustments to signal timing and phasing adjustments.
- Ramp widening.
- Additional or changes to turning movements/storage lanes.
- Additional or improvements to signing and pavement markings.
|
| 5.6.1 Signal Timing and Phasing Adjustments |
|
|
Adjusting the traffic signal timing at the metered ramp/arterial intersection, as well as nearby intersections, will help smooth the flow of traffic entering and exiting ramp facilities. Coordinating ramp meters with traffic signals may prove beneficial to operations on the adjacent arterial and freeway, as well as the ramp. On the arterial, adjustments to left-turn phasing and/or timing will help accommodate ramp bound traffic during metering periods. On the freeway mainline, signal timing adjustments will allow high volumes of exiting traffic to clear the freeway reducing queue spillback on the freeway facility. For exit ramp applications, special attention should be given to the capacity of the arterial to make sure high volumes of exiting traffic do not affect operations.
Adjusting signal timing not only improves the flow of vehicles entering and exiting the freeway, it also reduces the amount of time these vehicles are delayed as well as the environmental impacts these delays cause. A recently released evaluation of traffic signals, gave overall traffic signal operation within the U.S. a score of D-. [14] This poor score was in part attributed to the lack of proactive management of traffic signals. The evaluation concluded that “traffic signal timing is rarely reviewed, resulting in outdated signal timings that do not reflect current traffic and pedestrian needs.” Because traffic signal timing is rarely reviewed, local agency traffic staff cannot determine if traffic signals are operating effectively. This makes it difficult to coordinate traffic signals operated by different agencies, which is often the case for traffic signals located at the ramp/arterial intersection and those located on the ramp (i.e., ramp meters). At a minimum, the evaluation recommends that traffic signal plans be reviewed every three to five years, and that agencies develop and document an approach for tracking the performance of these relatively inexpensive investments, and performing maintenance. Completing these tasks may achieve the following benefits: [14]
- Reduce average delay between 15 and 40 percent.
- Reduce average travel time up to 25 percent.
- Reduce fuel consumption by up to 10 percent.
- Reduce vehicle emissions by up to 22 percent.
|
|
There are several reasons why entrance ramps may need to be widened. First, ramps may need to be widened to provide additional storage capacity. For instance, metered ramps where traffic frequently backs up into the adjacent arterial may be a candidate for widening. Second, ramps may need to be widened to provide enforcement zones, where respective personnel can be stationed safely and where ramp meter operations are clearly visible. Similarly, ramps without adequate room to perform maintenance activities, such as removing debris, trimming nearby vegetation, or repairing infrastructure, may also need to be widened. Lastly, ramps may need to be widened if providing designated lanes for special classes of vehicles, such as HOVs. The additional capacity in these situations would promote use of transit and carpooling/vanpooling by providing benefits in terms of reduced delay for these vehicles.
Likewise, there are several reasons for widening exit ramps. First, more storage may be required at the ramp terminal traffic signal to keep queues from backing on to the freeway. Second, traffic movements at the traffic signal may need to be separated to provide efficient or safe signal operations. Finally, additional turn lanes may be needed to efficiently handle high traffic volumes (see Section 5.6.3).
Widening on either entrance or exit ramps may be implemented in conjunction with adjustments to traffic signal timing to prevent queues from forming on the arterial or freeway. On exit ramps, ramp widening may be implemented with pavement markings (see Section 5.6.4) to separate different traffic movements.
Whenever construction is needed to widen a ramp, practitioners may find it beneficial to complete additional work, if needed, while the ramp is being widened. Such work may include fixing geometric deficiencies, repairing the roadway surface, and posting additional signs. In these situations, it may be more cost effective to complete additional work if the ramp is already closed and/or if the resources are readily available. This reduces the level of effort required to close the ramp and to set up work zone related equipment (signs, barriers, cones, etc.). In cases where the ramp must be closed, completing additional work may also reduce the number of times the ramp must be closed, which consequently reduces the impact on the public. |
| 5.6.3 Turning Movements and Storage Lanes |
|
|
Queues that form as a result of ramp meter operations should be held on the ramp to avoid possible backups onto adjacent arterials. If storage on the ramp is exceeded, and neither the metering rate can be adjusted nor the ramp widened, turn/storage lanes on the adjacent arterial should be considered to hold vehicles waiting to turn onto the ramp. An illustration of how a turn lane provides additional storage for vehicle waiting at a ramp meter is shown in Figure 5-1. Comparing the two diagrams in Figure 5-1, it is easy to see that the addition of a right turn lane on the arterial as depicted in the diagram on the right provides additional capacity for queues that extend beyond the ramp terminal, allowing through traffic on the arterial to flow freely. Without a right-turn lane on the arterial as depicted in the figure on the left, queues that form on the ramp may flow back onto the adjacent arterial, preventing the smooth flow of traffic in the right lane.
Figure 5‑5 : Comparison of Ramp Meter Queue Storage With and Without a Right-turn Lane on the Arterial
Construction of arterial turn/storage lanes may be implemented along with other treatments, such as signal timing, to limit traffic entering the ramp to prevent queues from spilling back through the intersection. Storage lanes may also be needed on exit ramps to contain queues and keep traffic from backing onto the freeway mainline.
Turning movements may be restricted to limit access to a ramp or arterial. For instance, turn restrictions to limit access to ramp may be implemented to intentionally divert traffic away from a ramp either because the ramp does not have enough capacity to hold turning traffic or queues that form on the arterial exceed the storage limits of the turn lane, and because of this traffic flow on the arterial is often impeded. Sometimes turn restrictions are implemented to reduce conflicts (either with other vehicles or with pedestrians) and improve safety and sometimes to improve traffic flow or limit downstream impacts. Consideration should be given to where traffic will re-route in response to these restrictions and whether the roadways in these areas can accommodate increased traffic demands. |
| 5.6.4 Signing and Pavement Marking |
|
|
As a ramp terminal treatment, signing is normally used in support of other terminal treatments. For example, signing will be used in conjunction with pavement marking (and sometimes widening) to add new lanes on an exit ramp. Signing, usually with pavement markings, is also used to designate turn lanes. Signing may also be used to guide motorists to freeway entrance ramps.
Advanced warning should be provided on metered ramps to alert motorists of ramp metering status before the last decision point to divert from the freeway. Advance warning will allow motorists to bypass metered ramps to avoid possible delays. This may be especially beneficial to motorists who take short trips on the freeway. In general, advance warning on the arterial is needed to inform motorists of the status of metering at specific ramps where metering operations are in effect. Advance warning on the ramp is needed to reconfirm the status of metering operations (i.e., meters on or meters off). Additional information, including design requirements for signing can be found in Chapter 10.
Similar to signing, the types and placement of pavement markings depends on the type of terminal treatment or metering system implemented at a ramp. Pavement markings are needed to delineate traffic movements on arterials approaching ramps, and on the ramps themselves. At a minimum, markings are needed to define the lane line, stop bar, channelization (if more than one lane), and HOV markings (if necessary). |
| 5.7 Chapter Summary |
In previous chapters of this handbook, the practitioner responsible for the implementation and operation of ramp management strategies was primarily focused on answering the question, “Is ramp management needed, practical and feasible?” If the answer this question is no, there is no need to investigate ramp management strategies further. However, if the answer to the question is yes, then the practitioner will likely need to answer the question, “What strategies are available to control traffic on ramps?” After reading this chapter, practitioners should be aware of all the possible strategies that can be used to manage and control traffic on ramps, and be able to use this knowledge to select the specific strategies that best address existing problems.
There are four types of strategies for managing and controlling traffic on freeway entrance and exit ramps discussed in this handbook. Each of the strategies also has a subset of strategies or methods in which they can be applied, as discussed in this chapter. For instance, ramp closure can be applied permanently, temporarily, or on a time-of-day basis. Each strategy or subset of strategies is unique, and best applied to different sets of problems or situations. However, the strategies presented may not individually solve problems being observed in the field. In some instances, it may be best to implement a combination of strategies to derive maximum benefits.
The answer to the question “Which strategies or combination of strategies is best for existing problems?” is a difficult one to answer. The overview of strategies provided in this chapter provides the foundation for answering this question and will be used extensively in Chapter 6, which discusses the process of selecting strategies in more detail.
|
| References |
1. ITS Deployment Tracking Website: Year 2002 Survey Results for Total Number of Ramp Meters. U.S. Department of Transportation. http://itsdeployment2.ed.ornl.gov/its2002/searchtechallresults.asp Accessed April 25, 2005.
2. Twin Cities Ramp Meter Evaluation: Executive Summary. Cambridge Systematics, Inc. February 2001. Available: http://ntl.bts.gov/lib/jpodocs/repts_te/13424.pdf
3. Freeway Management and Operations Handbook. Publication FHWA-OP-04-003. FHWA, U.S. Department of Transportation. September 2003. Available: http://ops.fhwa.dot.gov/freewaymgmt/freeway_mgmt_handbook/index.htm
4. Prevedouros, P.D. H-1 Freeway Ramp Closure: Simulation and Real-world Experiment. Transportation Research Board 78th Annual Meeting. January 1999.
5. Twin Cities Ramp Meter Evaluation: Appendix K. Cambridge Systematics. Available: http://www.dot.state.mn.us/rampmeterstudy/pdf/appendices/k.pdf
6. Persuad, B., Yager, S., Tsui, D., Look, H. Study of Breakdown Capacity of a Freeway with Ramp Metering. Presented at the 80th Annual Meeting of the Transportation Research Board. Washington, D.C. January 2001.
7. B. Kerner. Congested Traffic Flow: Observations and Theory. Presented at the 78th Annual Transportation Research Board. Washington D.C. January 1999.
8. Smaragdis, E., Papageorgiou, M. A Series of New Local Ramp Metering Strategies. Presented at the 82nd Annual Meeting of the Transportation Research Board. Washington D.C. January 2003.
9. A Toolbox for Alleviating Traffic Congestion. Publication IR-054A. Institute of Transportation Engineers. 1989.
10. Taylor, C. and D. Meldrum. Algorithm Design, User Interface, and Optimization Procedure for a Fuzzy Logic Ramp Meter Algorithm: A Training Manual for Freeway Operations Engineers. Department of Electrical Engineering. University of Washington. February 2000. Accessed at http://depts.washington.edu/trac/bulkdisk/pdf/481.1.pdf
11. Chaudhary, N.A. and C.J. Messer. Ramp Metering Technology and Practice: Tasks 1 and 2 Summary. Publication FHWA/TX-00/2121-1. Texas Department of Transportation. May 2000. Available: http://tti.tamu.edu/documents/2121-1.pdf
12. Ramp Meter Design Manual. California Department of Transportation. January 2000. Available: http://www.dot.ca.gov/hq/traffops/systemops/ramp_meter/RMDM.pdf
13. Improving Traffic Signal Operations. Institute of Transportation Engineers. 1995.
14. National Traffic Signal Report Card: Executive Summary. National Operations Coalition. Available: http://www.ite.org/reportcard/NTS_ExecSummary.pdf
Continue to Chapter 6 |
|
|
|
 |
|