4. How to Use Operations Objectives in the MTP
4.1 How Operations Objectives Are Applied in the Planning Process
As noted earlier, regional operations objectives flow out of goals established in the MTP, and provide measurements for evaluating progress toward the goal. Within the planning process, regional operations objectives, in turn, lead to the development of performance measures, identification of system performance deficiencies, development and evaluation of M&O strategies, and inclusion of specific programs or projects in the MTP, and corresponding TIP. An example of how operations objectives are applied throughout the planning process is illustrated in the following exhibit.
| Stage of Planning Process | Examples | |||
|---|---|---|---|---|
| Goal(s) Broadly describe what the region wants to accomplish, focused on outcomes. |
Improved transportation system reliability and reduced unexpected traveler delay | |||
| Regional Operations Objectives Specific measurable statements relating to the attainment of goals. |
Reduce incident-based delay so that by 2010, travelers experience… | Reduce traveler delay associated with work zones, weather conditions, and special events (so that…) | Improve access to travel information (so that…) | Improve transit system reliability (so that…) |
| Performance Measures Metric used at a regional basis to track system-wide performance (used in developing a regional objective), or at a corridor, roadway, or intersection level to identify specific deficiencies within the system to address. |
Incident duration (mean minutes per incident) |
Total vehicle hours of non-recurring delay |
Public awareness of traveler information (through surveys) |
Percentage of buses more than 5 minutes off schedule |
| Strategies Approaches to achieve objectives. Includes system preservation, safety projects, management and operations, capacity expansion. |
Traffic cameras and detection systems to identify incidents more quickly |
Work zone information campaign |
Traveler alert system |
Increased rail inspections and maintenance |
| Projects/Implementation Initiatives identified to carry out strategies. |
Install traffic cameras on Route X (2009) |
Implement regional electronic notification system (2010) |
Design and implement regional 511 system (2010) |
Install GPS locator system for bus system (2010) |
In this example, a goal has been developed for the MTP that focuses on improving transportation system reliability and reducing unexpected traveler delays. Through a process of coordination and collaboration between operators and planners, four regional operations objectives have been identified in relation to this goal, focusing on different aspects of system reliability: incident-based delay; work zone, weather, and special event-related delay; access to travel information, and transit system reliability. Each of these regional operations objectives is built upon data that can serve as performance measures for on-going tracking of system performance. Regional decisionmakers can then identify M&O strategies to help achieve the operations objectives. Based on analysis of costs, effectiveness, and other factors, projects and programs will then be selected for inclusion in the MTP and TIP.
Role of the Congestion Management Process
Within TMAs, the Congestion Management Process (CMP) contributes to the development of the MTP as one element of systematic process of using regional operations objectives to develop performance measures, collect data, identify deficiencies, and develop strategies. The figure below illustrates more specifically the relationship between M&O and the CMP.19
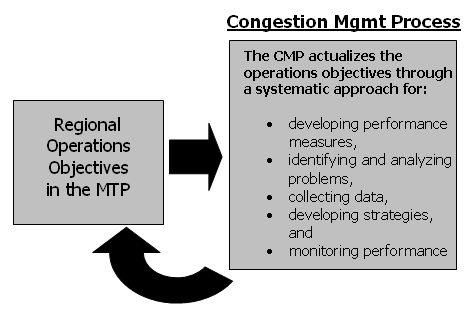
Figure 5: Relationship between Management & Operations and the CMP.
While the CMP focuses on congestion, similar processes can be used throughout the MTP development to determine objectives focused on other areas, such as emergency management and transportation system connectivity.
Even in metropolitan areas that are not required to implement a CMP, the systematic process of defining congestion performance measures, identifying and analyzing congestion problems, collecting data, developing strategies, and monitoring system performance is valuable as a means to apply regional operations objectives in the investment decision-making process.
North Central Texas's Congestion Management Process
The North Central Texas Council of Governments (NCTCOG), the MPO for the Dallas-Fort Worth Metropolitan Area has fully integrated their congestion management process into their regional transportation planning. The area's rapid population growth has outpaced its abilities to expand the transportation system making operations and demand management strategies a top priority for transportation investments. NCTCOG's CMP provides for collecting system performance data including low-level aerial photography and monitoring the performance of the transportation system. This helps to identify freeway bottlenecks and areas needed improvement. The importance of their CMP is evident in NCTCOG's funding allocation priorities during the development of their metropolitan transportation plan. Funds are first allocated in the plan to the maintenance and operation of existing facilities. Next, they develop and allocate funding to congestion mitigation strategies aimed at improving the efficiency of existing facilities or removing trips from the system. The Dallas-Fort Worth region has adopted congestion mitigation strategies such as traffic signal and intersection improvements, freeway bottleneck removal, incident detection and response systems, park-and-ride facilities, and employer trip reduction programs.
4.2 Developing Performance Measures for M&O
How Operations Objectives Relate to Performance Measures
The establishment of regional operations objectives naturally leads to the development of performance measures that can be used to assess and track system performance. Performance measures are indicators of how well the transportation system is performing, and are inextricably tied to objectives. A range of performance measures may come out of the development of regional operations objectives. However, this is a somewhat iterative process, since performance measures need to be identified and data collected in order to select appropriate regional objectives that are specific and measurable.
Transit agencies have for a long time focused on a range of operations-based performance measures, such as on-time performance, vehicle-revenue miles, and cost per revenue mile. Increasingly, MPOs, transit operators and DOTs are becoming customer-focused, which increases attention to the development of performance measures, which support regional operations objectives.
By focusing attention on system characteristics that are important to the traveling public, performance measures can help planners to focus on the day-to-day experience of transportation system users. This provides important balance in settings where planners have been exclusively focused on very long-term development of the network. With greater focus on the day-to-day characteristics of the system, the issues faced by operators, such as incident response, work-zone management, and provision of traveler information, take on greater importance. As a consequence, mid- and long-term planning will reflect greater consideration of management and operations planning and investment needs.
Performance Measurement: An Example from WSDOT, "Measures, Markers and Mileposts," 2007.
Although this example comes from a State DOT, a similar approach could be applied at a regional level.
Although MPOs are generally not responsible for transportation system operations, there are several reasons why an MPO is logically suited to playing a role in performance measurement as part of the transportation planning process: (1) It is responsible for deciding the regional investments in transportation; it's logical for it to measure how well those investments are doing; (2) It is a "neutral" observer of performance, in that most MPOs have no direct operating responsibilities.
Examples of M&O Performance Measures
Performance measures may be used either at a system-wide scale or at a corridor or transportation facility-level in order to determine where deficiencies exist and to prioritize strategies and funding to the most critical problems. For instance, by identifying locations with the greatest recurrent and non-recurrent traffic congestion using performance measures in the CMP, an MPO can help to direct funding toward facilities with the greatest scope, extent, or duration of congestion.
Examples of performance measures relevant to management and operations include20:
- Travel time - Travel time measures focus on the time needed
to travel along a selected portion of the transportation system, and can be
applied for specific roadways, corridors, transit lines, or at a regional
level. Common travel time metrics include:
- Average travel time, which can be measured based on travel time surveys;
- Average travel speeds, which can be calculated based on travel time divided by segment length or measured based on real-time information collection;
- Travel time index: the ratio of peak to non-peak travel time, which provides a measure of congestion.
- Congestion extent - Congestion measures can address both
the spatial and temporal extent (duration). Depending on how these measures
are defined and data that are collected, these measures may focus on recurring
congestion or address both recurring and non-recurring congestion. Examples
include:
- Lane miles of congested conditions (defined based on volume to capacity (V/C) ratio, level of service (LOS) measures, or travel time index;
- Number of intersections experiencing congestion (based on LOS)
- Percent of roadways congested by type or roadway (e.g., freeway, arterial, collector)
- Average hours of congestion per day
- Share of peak period transit services experiencing overcrowding
- Delay - Delay measures take into account the amount of
time that it takes to travel in excess of travel under unconstrained (ideal
or freeflow) operating conditions, and the number of vehicles affected. These
measures provide an indication of how problematic traffic congestion is, and
can address both recurring and nonrecurring congestion-related delay. Examples
of delay measures include:
- Vehicle-hours of recurring delay associated with population and employment growth
- Vehicle-hours of nonrecurring delay associated with incidents, work zones, weather conditions, special events, etc.
- Incident occurrence / duration - Incident duration is
a measure of the time elapse from the notification of an incident until the
incident has been removed or response vehicles have left the incident scene,
and can be used to assess the performance of service patrols and incident
management systems. Incident occurrence can also be measures used to assess
the performance and reliability of transit services. Examples of this measure
include:
- Median minutes from time of incident until incident has been removed from scene
- Number of transit bus breakdowns
- Average number of transit rail system delays in excess of X minutes
- Travel time reliability - Travel time reliability measures
take into account the variation in travel times that occur on roadways and
across the system. Examples of measures include:
- Buffer time, which describes the additional time that must be added to a trip to ensure that travelers will arrive at their destination at, or before, the intended time 95% of the time
- Buffer time index, which represents the percent of time that should be budgeted on top of average travel time to arrive on time 95% of the time (e.g., a buffer index of 40 percent means that for a trip that usually takes 20 minutes, a traveler should budget an additional 8 minutes to ensure on-time arrival most of the time)
- Percent of travel when travel time is X percent [e.g., 20%] larger than average travel time.
- Person throughput - Examines the number of people that
are moved a roadway or transit system, which can account for efforts to improve
the flow of traffic, encourage high occupancy vehicle movement, or increase
seats occupied on transit. Example measures include:
- Peak hour persons moved per lane
- Peak hour persons moved on transit services
- Customer satisfaction - Examines public perceptions about
the quality of the travel experience, including the efficiency of system management
and operations. Customer satisfaction is typically measured through surveys
and may include measures such as:
- Percent of the population reporting being satisfied or highly satisfied with travel conditions
- Percent of the population reporting being satisfied or highly satisfied with access to traveler information
- Percent of the population reporting being satisfied or highly satisfied with the reliability of transit services
- Availability of or awareness of information - These measures focus on public knowledge of travel alternatives or traveler information.
Performance measures related to congestion will be developed through the Congestion Management Process. In the CMP, different measures of congestion may be used, addressing the scope, extent, or duration of congestion; recurring and nonrecurring congestion; and other issues related to congestion.
Incorporating performance measures relating to system reliability, incidents, and nonrecurrent delay can have an important role in changing how an MPO examines and defines its current or baseline conditions. Often, agencies describe baseline conditions as broad averages. However, such descriptions are not very useful when agencies seek to avoid transportation disruptions caused by non-recurrent congestion including special events, incidents, work zones, weather or other disturbances. Using baseline data that do not account for these common departures from average conditions makes it difficult to assess the value of M&O such strategies. As a result, some regions are calculating the contribution of incident delay to traffic congestion and air pollution in order to better show the benefits of programs that address this form of delay.
Examples of M&O Performance Measures
North Jersey Transportation Planning Authority
The North Jersey Transportation Planning Authority (NJTPA) has selected a reliability index that compares non-recurring delay to total delay. NJTPA uses a special post-processing module to its travel demand model to help produce this indicator.
See: www.njtpa.org/planning/strat_eval/strat_eval.html.
Boston MPO
As another example of using performance measures, the Boston MPO measures peak-period passenger crowding and on-time performance by transit line. Using data collected on the regional transit system, the Massachusetts Bay Transportation Authority (MBTA), the Boston MPO reports number of passengers per seat on transit lines in the peak period as well as the percentage of trips operating within five minutes of scheduled times.
M&O Performance Measures: Examples from Puget Sound Regional Council
The Puget Sound Regional Council, in Washington State, has proposed a range of performance measures across different modes of transportation, as shown by the examples below.
| Measure | Highway | HOV | Transit | Ferries | Non-Motorized | Freight |
|---|---|---|---|---|---|---|
| Travel Time and Delay |
|
|
|
|
|
|
| Travel Time Reliability |
|
|
|
|
|
|
| System Access |
|
|
|
|
||
| Throughput |
|
|
|
|
|
|
| Crowding |
|
|
|
|
|
|
| Safety |
|
|
|
|
|
Collecting Data for Performance Measures
Data is a prerequisite for the use of performance measures, and MPOs often face a struggle between the desire to measure regional performance and data limitations and cost considerations that place constraints on the extent to which performance measures can be used. At the same time, a wealth of data is currently being collected in most regions by transportation system operators that are running systems that keep track of real-time travel information. Intelligent Transportation System (ITS) components, in particular, such as toll tag readers and transponders, video detector systems, and traffic management systems that are used to provide travelers with real time travel information can be used to measure performance of the transportation system on an on-going basis.
4.3 Using Performance Measures for M&O
Identifying Deficiencies
A regional operations objective may lead to the development of not only regional performance measures, but development of performance measures that may be used at a more localized level - whether specific geographic areas or specific facilities - in order to assess deficiencies in system performance. For instance, in the CMP, a region must define what it means to have unacceptable congestion, which may vary by type of roadway functional classification and by location (e.g., a lower speed will generally be more acceptable on an urban arterial than on a rural freeway). Once performance measures are established for different types of roadways, these measures can be used at a local scale to identify the areas with the greatest congestion problems and to target strategies and investments to these areas in order to maximize the value of the investment.
For instance, as part of its CMP, the Capital Area Metropolitan Planning Organization (CAMPO), in Austin, Texas, utilizes travel-speed-related measures to identify congested locations. For roadway segments, CAMPO has defined minimum threshold acceptable speeds, based on the type of road and the type of area through which that road travels, with lower speeds more acceptable in a central business district location than in a rural area. The East-West Gateway Coordinating Council (EWGC) in St. Louis, Missouri, used aerial photography with multiple photographs taken during three-hour a.m. and p.m. peak periods, producing traffic volume and density numbers for several time points at the same location. This information allowed EWGC to track the duration of congestion along congested links, distinguishing links with prolonged congestion from those that are congested over short portions of the peak periods.21
Denver MPO's Use of Performance Measurements in CMP
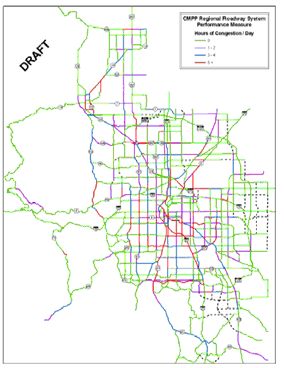
The Denver Regional Council of Governments' (DRCOG) Congestion Management Process (CMP) involves collecting data on several performance measures for segments of the regional roadway system, including: hours of congestion/day; peak hour delay per user (in minutes), percent of peak hour travel time in delay; and travel time index (ratio of peak hour travel time to free flow travel time). These data are then used to assess areas with the most significant congestion problems, and to identify and prioritize strategies.
A number of regions have developed systems to provide the public with real-time information on the condition of the transportation system (e.g., location and severity of delays, location and status of accidents, status of the transit network, weather-related traffic problems, and disruptions from special events). Much of this information can be evaluated to identify trends and current variation in system performance and to assess performance on specific sub-elements of the system. Agencies can examine on-going system monitoring efforts as a starting place for a performance measurement program.
Developing and Evaluating Strategies
Using performance measures leads to the identification, development, and assessment of strategies that are best geared toward achieving results. Therefore, utilizing operations objectives and related performance measures focused on issues such as reliability, travel delay, and other operating issues will naturally lead to the development of M&O strategies. Use of measurable objectives for a wide range of goals, addressing safety, security, the environment, etc. can also lead to greater attention to M&O strategies since the planning process focuses on performance, rather than looking narrowly at categories of projects, such as highways, transit, and bicycle and pedestrian projects.
Overall, efforts to focus on system performance result in better recognition of the value associated with M&O approaches. Data on system performance can highlight the value of investments in programs that minimize incident-related delays, provide information on real-time travel conditions, and improve emergency response times by showing how they can improve transportation system reliability and reduce travel times for customers. For example, information pulled from the CMP can be particularly useful in developing M&O strategies.
The limited number of tools to quantify the benefits of operational strategies is often noted as a constraint in bringing greater attention to M&O strategies. However, there are several tools available to predict the effects of operational strategies on system performance.
- Sketch planning tools, such as the ITS Deployment Analysis System (IDAS) and Screening for ITS (SCRITS). The IDAS software works with the output of traditional transportation planning models, and enables planners to evaluate both the relative costs and benefits of ITS investments.22 SCRITS is similar in that it is intended to allow practitioners to obtain an initial indication of the possible benefits of various ITS applications. It involves a more simplified spreadsheet analysis to expedite a benefit-cost analysis.23
- Travel demand forecasting model post-processors, such as DYNASMART-P. DYNASMART-P is a dynamic network analysis and evaluation tool, which models the evolution of traffic flows in a traffic network.24
- Simulation models, which include microscopic, mesoscopic, and macroscopic applications. Microscopic models, such as CORSIM, have been used for operations planning by Wisconsin DOT, Indiana DOT (INDOT), New York State DOT Region 11, New Jersey DOT, Miami-Dade County, Florida DOT, and California DOT (Caltrans). CORSIM is a comprehensive microscopic traffic simulation, applicable to surface streets, freeways, and integrated networks with a complete selection of control devices (i.e., stop/yield sign, traffic signals, and ramp metering). It simulates traffic and traffic control systems using commonly accepted vehicle and driver behavior models. INDOT is using PARAMICS to evaluate and address future operational needs. The tool is being applied to determine future growth and design needs for I 465, I 70, and I 69 within Marion County. The City of El Paso and the University of Texas - El Paso has combined DYNASMART-P and CORSIM to evaluate downtown traffic and the environmental impacts of one-way and two-way traffic flow reconfigurations.
- Use of archived data, which allows measurement of performance before and after implementation of operations-oriented projects.
It is important to note that the process of bringing operations stakeholders to the table with a focus on M&O in the planning process can help to identify strategies that are already being implemented or considered by operating agencies but which may have never before appeared in the MTP.
4.4 Selecting M&O Strategies and Projects
M&O strategies may be implemented as "stand alone" projects, such as a regional incident management system, traveler information system, or transit smart card. They can also be implemented as part of transportation preservation projects, safety projects, or capacity improvements. It may be useful to consider M&O strategies in connection with any transportation investment in the Plan. For instance, as part of any new highway expansion, it may be useful to consider the role of transportation pricing, high-occupancy vehicle lanes, flexible design to accommodate concurrent flows of traffic, or demand management programs during the construction period. Applying regional operations objectives therefore can also affect the specific project parameters, as the project moves from planning through more detailed project development and design.
The Miami RUSH Program
Miami's RUSH (Resourceful Use of Streets and Highways) addresses congestion bottlenecks that do not justify a full corridor study. Projects that cost less than $500,000 and that are determined to have insignificant environmental impacts are prioritized by member agencies. A lump sum of TIP money is set aside for projects that will be selected through the RUSH process, allowing for swift implementation of the designated improvements.
Strong consideration of M&O strategies in the MTP will naturally lead to M&O programs and projects that appear in the MTP and in the Transportation Improvement Program (TIP). The TIP will contain M&O projects that carry out the regional operations objectives. As noted earlier, a Regional Concept of Transportation Operations (RCTO) can also be developed as a result of the identification of regional operations objectives and strategies in the MTP.
19 For more information on use of the CMP, see A Guidebook on the Congestion Management Process in Metropolitan Transportation Planning, which provides detail on the specific requirements of the CMP and best practices.
20 See NTOC "Performance Measurement Initiative - Final Report," http://www.ntoctalks.com/ntoc/ntoc_final_report.pdf.
21 For more information, see: www.ewgateway.org/trans/transportation.htm.
22 For more information, see: http://idas.camsys.com/.
23 For more information, see: https://www.fhwa.dot.gov/steam/scrits.htm.
24 For more information, see: https://www.fhwa.dot.gov/research/deployment/marketready.cfm.
 You will need the Adobe Reader to view the PDFs on this page.