TRAVELER CHOICES
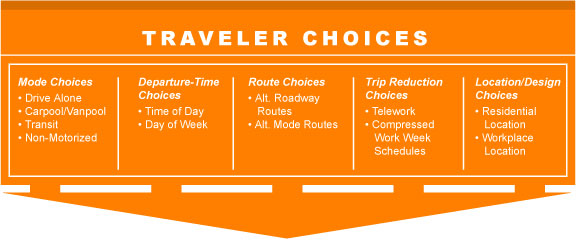
an outline of the range of traveler choices impacted by demand-side strategies
Traveler Choices
Strategies implemented as part of a demand-side program are designed
to facilitate
efficient traveler choices.
Individual travelers, families, and businesses all make important decisions
that collectively impact traffic congestion. These decisions include
day-to-day travel choices, such as travel mode, departure-time, and
travel route. They also include decisions to eliminate some travel altogether
– for example, by working from home a few days a month or by using
internet-based technologies to preclude the need to physically travel
to a store, library, or other destination. Finally, individuals and
organizations make important decisions about the location of their residence
or business – often factoring in transportation-related considerations
such as commute to work travel times or ease of access to public transportation
services.
This section provides additional detail on five primary traveler choices:
1. Mode Choices
2. Departure-Time Choices
3. Route Choices
4. Trip Reduction Choices
5. Origin / Destination Location Choices
Mode Choices… “What travel
mode will I use for my trip?”
Demand-side strategies target improvements to the availability and viability
of real transportation mode alternatives for a full range of travelers,
from school-age children through seniors, and for a full range of trip
types, from the trip to work to the trip to the corner store. By enhancing
the availability of a range of travel mode choices, travelers can select
the most appropriate or efficient option for each trip. In many situations,
the flexibility and convenience of the single-occupant automobile is
the best option. However, for many trips, other mode choices can prove
less expensive, less stressful or more predictable.
The Range of Mode Choices:
• Single-Occupant Vehicle (SOV)
A single individual driving an automobile or motorized cycle with no other passengers.
FAST FACTS: The country’s share of commuters driving alone increased by just over 3% from 1990 to 2000 (from 73.19% to 76.31%). From the 2000 U.S. Census, the District of Columbia (40%), New York (56%), Hawaii (67%), and Alaska (69%) remain the four jurisdictions with the lowest drive alone rates. Alabama (85%), Michigan (84%), and Ohio (84%) have the highest drive alone rates. (2000 U.S. Census)
• Carpool
Two or more people sharing a ride in a private vehicle. Carpooling is the most common and flexible way for travelers to share a ride, and often occurs between family members, friends, or co-workers. More informal than a vanpool and more flexible than public transit, carpools generally have two or more passengers who live in the same neighborhood, or along the same route, using a private vehicle to travel to common or nearby destinations. Carpooling often appeals most to people traveling at least ten miles or whose trip takes over 20-30 minutes.
• Vanpool
A group of seven or more people sharing a ride in a prearranged vehicle. With one or two vanpool participants typically serving as regular drivers, vanpools provide non-stop, point-to-point service. The van’s ownership and operating costs are usually paid for by the van riders on a monthly basis. Vanpools typically serve trips of 15 miles or more. Many transportation agencies complement fixed-route bus and rail transit with vanpool services to provide attractive door-to-door travel options for otherwise difficult to serve trips (i.e., suburb-to-suburb trips, trips to low-density office markets, and trips to/from smaller towns or outlying communities).
VANPOOLING - PUGET SOUND, WA. Six large, medium and small transit agencies in the Puget Sound region include vanpool service as an integral part of their total service package. In January 2004, King County Metro operated 663 vanpool and 60 vanshare vans, Community Transit ran 210 , Pierce Transit ran 228 , Kitsap Transit ran 89, Intercity Transit ran 77, and Island Transit ran 43. In the Puget Sound area, vanpooling has achieved a 2% market share of the overall commuter market. Among commuters who travel 20+ miles each way, vanpooling has reached a 7% market share. King County Metro’s VanShare program provides service to bridge the gap between the commuter and a public transportation hub or terminal (rail station, Park & Ride lot and ferry dock). The agencies specifically look to vanpooling to meet demand in hard-to-serve suburban markets. For more information on vanpooling in the Puget Sound region, contact Syd Pawlowski at King County Metro, 206-684-1535, syd.pawlowski@metrokc.gov.
___
FAST FACTS: While the average fare paid by bus passengers in 2001 was $0.74 per unlinked trip, vanpool passengers paid an average of $2.06. As a result, transit operators in the Puget Sound region achieve an 85% farebox recovery of capital and operating costs for their vanpool programs. In 39 cities reporting data on more than one mode to the National Transit Database (NTD) in 2001, vanpools had the lowest cost-per-passenger and cost-per-revenue-mile expense to transportation agencies. (APTA, NTD)
• Public Transportation
Rail, bus, shuttle or ferry transportation services provided to the general public, utilizing a paid driver and administered by public transportation agencies or private-sector companies. Services may operate along a fixed-route on a set schedule, or may utilize more flexible routing and scheduling options. Public transportation services provide critical, high-capacity access to dense-urban areas (allowing for intensified land use development without increased congestion), offer needed transportation services to those without access or unable to drive (including child and the elderly populations), and are increasingly vital to the success of special events (from major events like the Olympic Games, to recurring events like baseball games or concerts). In an effort to preserve high-value environments and enhance visitors experience, public transportation is now a key element of overall mobility and access planning at many of the nation’s parks, including Acadia and Zion National Parks.
CHICAGO, IL. The City of Chicago has joined forces with the Chicagoland Bicycle Federation to teach motorists and bicyclists to better share city streets. Along with an ad campaign to show motorists how to share the road, they’ll send bicycling ambassadors out to the streets to speak face-to-face with members of the public.
www.biketraffic.org/
USA. In 2003, 500,000 students, parents and community leaders in cities across America joined millions of walkers worldwide to participate in International Walk to School Day.
www.iwalktoschool.org/___
FAST FACTS: Public transportation ridership has increased over 21 percent in the last six years (1998-2003), faster than highway or air travel. Every $1 invested in public transportation projects generates $6 in local economic activity, and supports approximately 47,500 jobs. Public transportation is a $32 billion industry that employs more than 350,000 people. (APTA, 2004)
• Non-Motorized (Walk, Bike, Skate)
Includes walking, bicycling, skating or any other mode of non-motorized travel. Often complements other modes of travel. For example, most public transportation trips begin or end with a walking trip, and many users bicycle to/from transit stops. A safe and convenient environment for pedestrians can dramatically increase the number of people walking to offices, stores, or schools during the day. Walking then enables sharing a ride or taking the bus as a realistic travel alternatives.
DID YOU KNOW? In 2000, the bicycle industry generated $5.89 billion in sales. Each year, nearly one billion trips are made by bicycle, and over 40 million American adults ride a bike at least once a month. Bicycling and walking represent 7% of all trips made nationally, yet accounts for 13% of all traffic-related fatalities in the country. (America Bikes, 2003). More than half of the American public (55%) says it would like to walk more throughout the day either for exercise or to get to specific places. When thinking about deciding where to live, having sidewalks and places to take walks for exercise or fun is important to nearly eight in ten Americans (79%), and “very” important to four in ten (44%). Having areas to walk in the neighborhood rates third on a list of seven items asked in the survey, behind feeling safe from crime and the quality of the public schools. (STPP, 2001)

Departure-Time Choices… “What
time-of-day or day-of-week will I depart for my trip?”
Beyond day-to-day choices about travel mode, travelers also make regular
decisions about the time of day, or even day of week, to depart on their
trip. Travelers often adjust their travel schedules to avoid rush-hour
traffic congestion, to work around childcare or school schedules, or
to take advantage of reduced roadway, bridge or transit off-peak pricing
discounts. Demand-side strategies use a variety of approaches to facilitate
utilization of less-congested travel times, mitigating the length and
duration of congested peak periods (“spreading the peak”).
The enhanced use of real-time travel information increasingly allows
travelers to avoid non-recurring traffic incidents by shifting trips
to an earlier or later time.
The Range of Departure-Time Choices:
• Time of Day
Shifting trip departure-times away from congested times of day, to avoid non-recurring traffic congestion resulting from a traffic incident, to avoid traffic congestion caused by weather, or for individual scheduling needs.
FAST FACTS: The extra time needed for rush hour travel has tripled over two decades. According to the Texas Transportation Institute’s (TTI) 2003 Urban Mobility Report, the national average Travel Time Index for 2001 was 1.39 (meaning a rush hour trip took 39 percent longer than a non-rush hour trip). The national average in 1982 was only 1.13, a 26% increase in travel time for a rush hour trip versus a non-rush hour trip. This increasing “rush hour penalty” creates a growing incentive for travelers to take advantage of less congested travel times. (TTI, 2003)
• Day of Week
Shifting trips to less-congested days of the week. In addition to more common “rush hour” times of the day in many urban areas, congested travel conditions in some communities are more frequently linked to certain days of the week. For example, travel to recreation or tourism destinations can be plagued with peak-direction congestion on Friday afternoons and Saturday mornings, followed by congestion in the reverse direction on Sunday afternoons. US 50 over the Chesapeake Bay Bridge, Highway 99 to the Whistler Blackcomb ski area, Route 6 to the Cape Cod National Seashore, and I-70 to Colorado’s many ski areas all exhibit this day-of-week congestion.
Q. Do demand-side operations programs require people to change their travel patterns?
A. Absolutely not. These programs simply aim to provide travelers with the broadest range of efficient travel choices, the best information on the choices available and how to use them, and balanced financial incentives for the most efficient alternatives.

Route Choices… “Which route
will I use for the trip?”
Many travelers have several routes available to travel between Point
A and Point B. Travelers wisely choose routes that get them where they
need to go (including en route stops) based on experience over time
that informs them of the most efficient route choices. Some travelers
choose the fastest routes, while others choose routes with less-hectic
or safer travel conditions. Other travelers alter travel routes from
day-to-day as the result of changing travel needs (i.e., trip chaining)
or as the result of non-recurring travel delays caused by traffic incidents,
roadway construction, or even weather. The collective route choices
made by travelers in a region affect the performance of the transportation
network (“too many people using the same route at the same time”).
Demand-side programs provide travelers with advanced, real-time transportation
information in a variety of formats, facilitating traveler utilization
of excess roadway capacity on less-congested travel routes, and limiting
the magnitude and duration of both recurring and non-recurring travel
delays. These strategies can also focus on shifting travel away from
residential or other sensitive routes, and can shift demand away from
routes with construction related delays.
The Range of Route Choices:
• Alternative Roadway Routes
Shifting the roadway route utilized to travel between destinations, in order to avoid congested facilities and travel on routes with available capacity. Travelers may utilize a variety of traveler information tools – such as real-time traffic information available on websites or en route variable message signs – to determine the best available routes.
• Alternative Mode Routes
Shifting the transit routes utilized in order to avoid system delays or other issues, or shifting the travel mode used (into transit, bike, walk, etc.) in response to delays on roadway systems.
ROUTE CHOICES – CAPE COD NATIONAL SEASHORE. Of the five million annual visitors to the Cape Cod National Seashore today, one-half arrive during a ten-week period in the months of June-August. The type and duration of tourist visits has changed over the past forty years. The two-week to a full month stay that was usual in the 1960s and 1970s has been replaced by shorter trips, usually a two to three day weekend. In order to address the long-range transportation needs of the area, planners developed the Long-Range 25-Year Plan for Alternative Transportation Systems – including transit enhancements and development of intelligent transportation systems to provide both pre-trip and en route travel information services. From the plan: “Pre-trip information can assist a driver map a route, gather information on current roadway conditions, and identify detours around planned construction. Transit users can identify transit routes, schedules, fares, and connections… En-Route Driver Information systems provide real-time information to travelers who have commenced a trip. Information on delays, accidents, weather conditions, and emergency situations can be communicated to the traveling public. Route guidance systems can identify alternative routes that are available to by-pass delays.” (Volpe, 2003)
___
Trip Reduction Choices… “What
are my options to reduce the need for some trips?”
The demand for travel is based on the need of customers to move between
two points for some purpose, whether to get to work or to the store.
“Trip reduction” choices explore alternative ways to “connect”
origins and destinations, using technology and other advancements to
eliminate the original need for some trips altogether. As an example,
“teleworking” connects people to their jobs through the
information superhighway, rather than the local interstate highway.
The Range of Trip Reduction Choices
• Telework
Simply defined, teleworking is working at home or another off-site location, full- or part-time. While employees may be hooked up to the main office via a sophisticated computer network, it’s possible to telework with as little as a pen, paper and phone. Jobs are more portable than they once were. Teleworking is increasingly used by employers to reduce the demand for office space and parking space. Additionally, teleworking is often used as a recruiting and retention tool. Across the country, part-time teleworking is on the rise, while trends suggest a gradual decline in the number of people working full-time from home. A 2003 survey by The Dieringer Research Group reported that 23.5 million Americans telework at least one day per month, a growth of 40 percent since 2001. The report found that 42 percent of these employee teleworkers work from home at least one day per week, and 22 percent of the employees work at home daily or nearly every day. (Dieringer, 2003)
FAST FACTS: 21% of working Americans teleworked in 2001. 58.8% of teleworkers say they work longer hours because they work at home. (ITAC, 2001)
• Compressed Work-Week Schedules
In a compressed work week, employees complete their required number of work hours in fewer-than-normal days per week (or per pay period). This arrangement allows employees to have one day off each week or one day off every other week, depending upon which type of compressed work week program preferred. The two most popular compressed work week schedules are the 4/40 and 9/80 programs, although other variations also exist. These options are described below:
• 4/40 Program. Employees work four 10-hour days each week, with the fifth day off. To ensure five-day coverage, some employers have half the company take Mondays off and half take Fridays off.
• 9/80 Program. Employees work 80 hours in nine days, with the 10th day off. This schedule usually translates to eight 9-hour days and one 8-hour day (this shorter day is often the Friday that the employee works). In a company with two major work groups, each group might take off alternating Fridays.FAST FACTS: A 1995 study of 2,600 Southern California employees, conducted for the California Air Resources Board, found that “employees on compressed work week reduced their net number of trips by an average of 0.5 per week… The respondents using a 9/80 schedule drove an average of 13 fewer miles per week; those using a 4/40 schedule drove an average of 20 fewer miles per week.”
(Holmes, 1995)
Origin / Destination Location Choices…
“How do residential, business, shopping and other location choices
impact my travel choices?”
While travel choices cover the range of alternatives about how and when
to travel between an origin and destination (decisions that people make
every day), individuals and businesses also make more fundamental choices
about the actual location of these origins and destinations - and these
“location choices” have a significant impact on the demand
for transportation. People looking for a new home often consider the
length and difficulty of their commute to work in their residential
location choice. Companies often consider maximizing access to employee
labor markets, or to central freight shipment locations, when making
business location choices. Retail establishments often assess area consumer
markets and ease of access to their retail location. Additionally, community
land use design decisions can integrate a mix of land uses in one area,
making it easier for people to access multiple destinations (work, shopping,
day care, etc.) in a centralized area. All of these locations choices
can have a significant impact on the number of trips people make, the
length of these trips, and the viability of making these trips by a
variety of travel modes (driving, transit, walking, etc.).
Q. Do these travel choices, such as using transit or adjusting travel times, really work for everyone?
A. No, but even shifting 5-10% of travelers to a different mode or time can have a significant impact on peak period congestion in certain locations. Many travelers in urban areas note that congestion is less severe when area schools are not in session – a prime example of how small shifts in travel patterns can affect overall congestion levels and delay.
The Range of Origin / Destination Location Choices:
• Residential Location
Decisions about residential location, with consideration given to ease of access to adjacent transportation facilities (roadways, transit stations/stops, bike paths, etc.) or to travel distances to key destinations (work, shopping, schools, etc.).
• Business Location
Decisions about business location, with consideration given to ease of access to adjacent transportation facilities, proximity of employee residential locations and commute distances, ease and manner of access to potential customer markets, etc.
FAST FACTS: Quantitative assessments of jobs/housing balance at the sub-regional level have shown that a good balance of jobs and housing can be associated with average commuter trip lengths lower by seven to almost 30 percent, compared to where jobs and housing are out of balance (R.H. Pratt Consultant, 2003).