Does Travel Time Reliability Matter? - PrimerWhat is Travel Time Reliability?The U.S. Department of Transportation (USDOT) defines reliability as "the degree of certainty and predictability in travel times on the transportation system." Defining ReliabilityTravel time reliability is a measure of the consistency, timeliness, predictability, and dependability of a trip. The term reliability has different meanings in different fields of study and even within the context of road transportation systems. For our purposes, however, this primer will adopt USDOT's definition of reliability, which defines it as "the degree of certainty and predictability in travel times on the transportation system. Reliable transportation systems offer some assurance of attaining a given destination within a reasonable range of an expected time. An unreliable transportation system is subject to unexpected delays, increasing costs for system users."(9) Travel time reliability is a measure of the consistency or dependability in the travel time of a trip, or time to traverse a road segment, as experienced in different hours of the day and days of the week.(10) It is measured in terms of the additional time (i.e., time cushion or buffer) that drivers need to allocate to compensate for unexpected delays. Travel time reliability is an important measure for commuters, transit riders, shippers, and other road users because it allows them to make better decisions regarding the use of their time. For example, shippers and freight carriers require predictable travel times to deliver goods and services on time. The concern is not just that travel time is excessive due to rush-hour congestion (i.e., mobility being lower than the desired level) but also that travel time is unpredictable as a function of time or road segment. Traditionally, travel time has been communicated in terms of historical averages calculated over periods of a year or longer (e.g., annual average peak hour travel time). However, road users experience variations in travel time on a daily or weekly basis due to traffic, roadway, and weather conditions. Travelers are more likely to remember the few days they suffered excessive delays versus their average travel times, as shown in figure 1.(10) 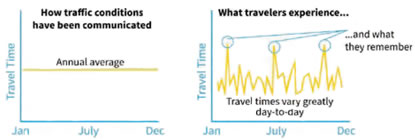 This figure shows a pair of line graphs. Both show travel time on the y-axis and months of the year (January, July, and December) on the x-axis. The graph on the left depicts how traffic conditions have been communicated. It has a single horizontal line sitting in the center of the y-axis spanning the x-axis in its entirety. The graph on the right shows what travelers experience. The line fluctuates up and down, showing varying travel times across months. The highest peaks are circled to indicate they are what travelers remember. This figure shows a pair of line graphs. Both show travel time on the y-axis and months of the year (January, July, and December) on the x-axis. The graph on the left depicts how traffic conditions have been communicated. It has a single horizontal line sitting in the center of the y-axis spanning the x-axis in its entirety. The graph on the right shows what travelers experience. The line fluctuates up and down, showing varying travel times across months. The highest peaks are circled to indicate they are what travelers remember.
Figure 1. Average travel time and actual travel time experience.(10) Variability in travel time can take two forms: (21) day-to-day and thin-day. Day-to-day travel time variation refers to changes in travel time when departing at the same time each day. Within-day travel time variability refers to changes in travel time between the same origin and destination at various times of the day. Typically, travel time is shorter during off-peak hours than during peak commuting hours, resulting in variation in travel time within the same day. Road users, passenger travelers, transit providers, and shippers are concerned with and interested in the time-of-day and day-to-day variation of travel time. Reliability VS. CongestionCongestion is a traffic condition characterized by slower speeds, longer travel times, and the occurrence of vehicle queues (wait lines). It can be recurrent (repeating often) or non-recurrent. Recurrent congestion includes delays that are predictable in frequency and extent (e.g., rush-hour traffic). Conversely, non-recurrent congestion is due to unexpected delays from temporary drops in road capacity (e.g., blocked lane due to a crash or work zone) or sudden surges in demand (e.g., planned special events). Lack of reliability is different from congestion, though it is related to non-recurrent congestion. Reliability refers to the predictability of journey travel times. A highway prone to unexpected delays is unreliable. On the other hand, a highway that is typically congested and where traffic speed is consistently low can be reliable. High levels of congestion, however, increase the likelihood of unreliability.(13) If roads are highly congested, a slight disturbance of traffic flow can result in excessive delays, have a greater impact, and take longer to recover than in a non-congested area. Therefore, lack of reliability in travel time is associated with delays caused by congestion, specifically with delays from non-recurrent events. Congestion and reliability are so closely related that improvements in congestion can improve travel time reliability as well. For example, a bypass around Stockholm reduced delay and improved reliability. In fact, the monetary benefits of the reliability improvement were an additional 15 percent of the benefits of the delay reduction itself.(14) 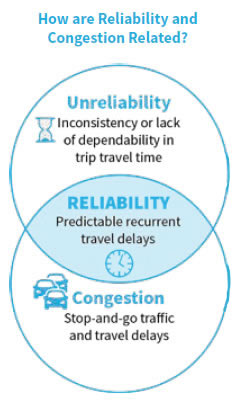 How are Reliability and Congestion Related. Two circles overlapping. First circle - Unreliability: Inconsistency or lack of dependability in trip travel time. Second circle - Congestion: Stop-and-go traffic and travel delays. Overlap between circles - Reliability: Predictable recurrent travel delays. How are Reliability and Congestion Related. Two circles overlapping. First circle - Unreliability: Inconsistency or lack of dependability in trip travel time. Second circle - Congestion: Stop-and-go traffic and travel delays. Overlap between circles - Reliability: Predictable recurrent travel delays.Factors That Affect ReliabilitySeveral factors can affect travel time reliability, namely the following sources of traffic congestion:(11), (12) More than half of total congestion can be attributed to non-recurrent sources.
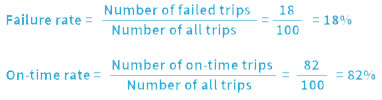
The first two sources can be treated as recurrent congestion (i.e., repeating often) and the rest as non-recurrent congestion. According to USDOT's 2013 Status of the Nation's Highways, Bridges, and Transit: Conditions & Performance, more than half of total congestion could be attributed to non-recurrent sources.(16) Similar statistics were also reported by the 2015 Urban Mobility Scorecard.(15) Measuring Reliability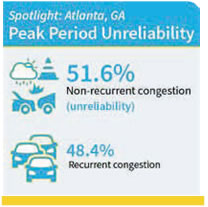 Data from 2008 in Atlanta, GA, showed that more non-recurrent congestion (unreliability) existed in peak periods than recurrent congestion. Primary causes included crashes, debris, and weather.(11) Travel time reliability is a key indicator of the efficiency of a transportation system, and improving it is a prime objective for transportation agencies. The first steps toward improvement include measuring travel time reliability and quantifying it objectively to determine the current level of reliability. Measurement DataTravel time reliability studies require quality travel time data. Travel time reliability cannot be directly measured; rather, it is calculated from travel time data. Travel time is the time taken by a vehicle to traverse a route between two points of interest (e.g., the origin and destination). It is measured by noting the time a trip began and the time the destination was reached. It can also be measured by dividing the distance between the two points of interest by an average speed. Travel time includes running time, which is time spent while a vehicle is in motion, and stopped delay time due to traffic-control devices (e.g., red lights) and other operational delays (e.g., congestion). Methods for measuring travel time include vehicles equipped with Global Positioning System (GPS) and cellular devices, license plate matching, aerial photogrammetry, vehicle-detecting devices, and road-user experience surveys. Travel time over longer periods of time is required to capture daily and seasonal variations and adequately calculate travel time reliability measures.(11) In combination with other basic traffic information, such as volume, travel time data can also be used to estimate other variables (e.g., total delays). Some of the data-capturing techniques that can be used for calculating travel time reliability include the following:(18)
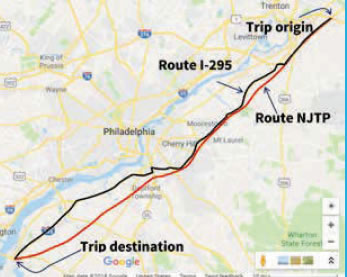
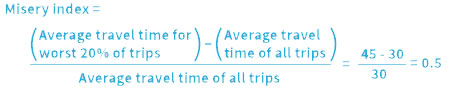
Each data type has its own advantages and limitations, which should be considered in the design of any reliability study. The data source has an impact on travel time reliability assessment.(19) Probe Vehicle Data CollectionTravel time data of two probe vehicles traveling along I-295 and the New Jersey Turnpike (NJTP) were collected for trips made on an hourly basis from 10:00 to 19:00 on three different Sundays: May 24, June 7, and July 19, in 2009.(20) The probe vehicles were dispatched simultaneously from a common trip origin point to a common destination. One used I-295 (64 miles), and the other used the NJTP (60 miles). Average travel time for route I-295 was 58.6 minutes with a standard deviation (or measure used to quantify variation) of 2.89 minutes, while the average travel time for route NJTP was 59.5 minutes with a standard deviation of 5.53 minutes. This shows that I-295 was a more reliable route than the NJTP during this time due to its smaller variation. Reliability MetricsSeveral metrics have been developed to measure travel time reliability, six of which are commonly discussed in literature.(11), (22)
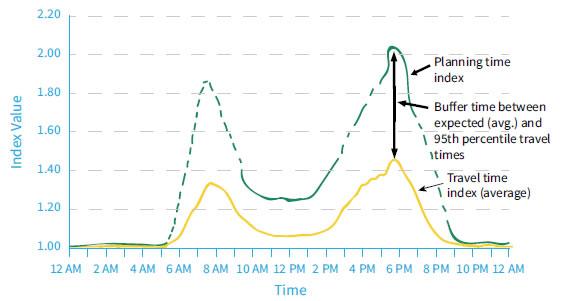
Figure 2 shows the relationship between the travel time index, buffer index, and planning time index.(10) Travel Time Index, Buffer Index, and Planning Time Index FHWA recently issued a final rule with two new travel time reliability metrics as the Moving Ahead for Progress in the 21st Century (MAP-21) performance measures.(23), (24) The objective of MAP-21 performance measures is to assess the performance of the National Highway System (NHS), freight movement on the interstate system, and the congestion mitigation and air quality improvement program. The two new reliability metrics are:
Various agencies use different metrics of travel time reliability as a portion of their mobility performance assessment depending on their needs. Table 2 shows the reliability metrics used by several agencies.
Benefit-Cost: Value of Travel Time and Value of Reliability
The value of travel time (VOT) and the value of reliability (VOR) are key factors in benefit-cost studies. VOT = VOR = VOT is the monetary value that road users place on reducing their travel time. VOR is the monetary value that road users place on reducing the variability of their travel time. The concepts of VOT and VOR involve estimating the magnitude of the benefits gained by saving in travel time and reduction in travel time variability or the penalties incurred by longer travel times and greater travel time variability.(26) Value of Reliability
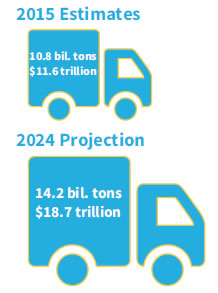
When moving goods from one end of I-5 to the other, a commercial vehicle operator has to add about 6 hours of buffer time to ensure on-time delivery with 95 percent confidence.(10) Recently, the valuation of travel time reliability in a benefit-cost analysis of transportation projects has been gaining attention. Some U.S. and international research projects have been initiated to provide guidance on how an agency can include the value of reliability (VOR) in a benefit-cost analysis when making congestion reduction-related project investment decisions.(27 – 33) Most benefit-cost studies of mobility solutions require the monetary value of travel time (VOT) and the monetary VOR. Understanding VOT and VOR can inform decisionmakers about the value of potential strategies for improving reliability, such as adding tolled roads or high-occupancy lanes or reducing incident clearance times. In the trucking industry, shippers and carriers value travel time at $25 to $200 per hour (depending on the product being carried).(2) A recent study in the area of freight transportation found that the VOT ranged from $12.80 to $283 per shipment hour, and the average value was $37 per shipment hour. VOR ranged from $51 to $290 per shipment hour, and the average of the distribution of VOR was $55 per shipment hour.(34, 35) This indicates that freight shippers valued travel time reliability 1.5 times as much as travel time savings. VOR to travelers can be estimated using data from congestion pricing strategies. This includes strategies like tolled roads and managed lanes (e.g., high-occupancy lanes). Such strategies offer reduced travel time and increased reliability to users who are willing to pay. Based on an analysis of congestion pricing data, many studies have reported that drivers value increased travel time reliability more than travel time savings.(36 – 38) Increased travel time reliability accounted for 68 percent of the benefits of using congestion priced lanes.(38) Another study estimated that users of congestion priced lanes value travel time to be $11.63 per hour, while they value reliability to be $25.45 per hour.(36) This monetary cost associated with travelers and shipments being late or unreliable arrival time should lead to prioritizing travel time reliability in transportation planning and management. And, the significance of travel time reliability should be taken into account in the appraisal and valuation of infrastructure development projects. VOR has increased in recent years. More reliable transportation systems are needed to address changes in business, industrial, and personal travel patterns and the emergence of more complex and interrelated scheduled activities (e.g., the just-in-time freight distribution and arrival systems). In 2015, the total weight of freight transported by road in the United States was estimated to be more than 10.8 billion tons and a value of $11.6 trillion.(25) In 2024, the freight figures are projected to increase to a weight of 14.2 billion tons and a value of $18.7 trillion. To support on-time delivery of freight, a reliable transportation network is critical. For example, for frequent truck drivers who are familiar with the local traffic patterns of a region, information on travel time reliability was found to be a more significant factor in route selection than was historical travel time information.(39) Expanding national and international trade creates greater goods volume, further destinations, and increasingly complex and interdependent supply chains. Successful interdependent and interconnected systems require reliable travel times between origins and destinations. Methods for Measuring the Value of Travel Time Reliability Attitudinal survey: Document commuters' perceptions about the relative importance of travel time reliability. Stated preference survey: Ask respondents how much they value travel time reliability compared to other hypothetical scenarios. (This method represents bias due to respondents not replicating their stated choices as observed in real situations.) Revealed preference study: Capture behavioral responses concerning the actual choices made by participants to travel time reliability measures. (The advantage of this technique is the reliance on actual choices, e.g., the technique avoids problems associated with stated preferences or a failure to properly consider behavioral constraints.) Changing patterns of individuals' employment opportunities, increased income, as well as increased recreational choices have affected passenger miles traveled.(40) Accommodating the busy calendar of an individual demands a more reliable transportation system so that delays in one activity do not affect the next activity. Essentially, road users value travel time reliability for several key reasons:
Travel time reliability is a key factor to the success of the U.S. economy and those who participate in it, including businesses, the traveling public, and local governments. Next, we'll dig a little deeper into the impacts of an unreliable transportation system, which includes negative effects on businesses, the traveling public, and local governments as well as impaired safety and security.
Importance of Reliability Across Transportation Modes On-time arrival of people and freight to their destinations is an important factor in all modes of transportation. Complex global and intermodal logistics chains require minimal disruption to ensure on-time delivery, which makes reliability critical. A recent survey of ocean shippers revealed that reliability of waterborne freight is considered to be the most important factor in maritime transportation compared to cost, speed, safety, security, and trackability.(42) Similarly, in air transportation, on-time departures and arrivals are key performance indicators for airline service quality, which determines customer satisfaction and loyalty, market competitiveness, economic benefits, and profitability.(43) Reliability plays a key role in meeting these performance standards. | ||||||||||||||||||||||||||||||||||
|
United States Department of Transportation - Federal Highway Administration |
||