Guide for Highway Capacity and Operations Analysis of Active Transportation and Demand Management Strategies
3 Measuring the Success of ATDM Implementation
3.1 Introduction
The overarching goal of active transportation and demand management (ATDM) is to increase the productivity and efficiency of the transportation system. ATDM achieves this goal by better tailoring systems operations and control to match fluctuating demand, weather and incident conditions, and by better informing travelers of these conditions so that they make more efficient use of the available system capacity.
Conventional analysis methodologies of roadway capacity improvements are designed to produce a single set of performance results (measures of effectiveness or MOEs) for a given set of input demands and computed capacities for a facility (“Measures of effectiveness” and “performance measures” are terms that can be used interchangeably). In addition, conventional methodologies are often specifically oriented to “ideal” or “near-ideal” conditions, when weather, incidents, and other factors do not adversely affect capacity. Conventional Highway Capacity Manual (HCM) and simulation model methodologies can be adapted to account for adverse effects on capacity, but their default condition is to exclude these effects.
3.2 Criteria for ATDM Performance Measurement
ATDM performance measures are designed to improve the performance of the facility over a range of real-world demand and capacity conditions, not just for a single forecasted condition. The conventional performance measures and methodologies overlook the majority of the benefits of the dynamic control of the transportation system provided by ATDM. Thus, ATDM performance measures must be able to measure not only improvements in average performance; they must also be able to measure improvements in the variability or reliability of that performance.
In addition, because ATDM is designed to be applied at a facility or system level, the performance measures for ATDM must be at the complete facility or system level. Consequently performance measures that are typically used for system level of analysis are recommended for evaluating ATDM strategies.
This chapter focuses on numerical measures of performance, however; much can be learned by examining graphical measures of performance such as the speed profile for the facility over the course of time and over the length of the facility. This can be particularly useful in diagnosing the causes and extent of unreliable performance.
3.3 Performance Measures (Measures of Effectiveness) for ATDM Analysis
A suite of performance measures, also referred to as “measures of effectiveness” in this Guide, are recommended to characterize the impacts of ATDM strategies on travel and congestion.
The performance measures are reported for each scenario, then weighted by their appropriate probability and summed across scenarios to provide overall performance results. The performance measures recommended are:
The VMT-Demand is the total number of vehicle-trips attempting to use the facility during the time period of interest. It is calculated as the sum of the products of the input origin-destination (OD) table vehicle-trips and the shortest path distance between each origin and destination. For example, a certain number of vehicles entering a freeway at on-ramp number one will want to exit at off-ramp number 5. The number of those vehicles is the OD demand between those two ramps. Multiplying the OD Demand between the two ramps by the distance between them gives the VMT-Demand for that pair of ramps. Repeating this computation and summing the results for all possible mainline and ramp pairs, gives the VMT-Demand for the freeway facility. Although, not traditionally a performance measure for highway improvement projects, demand is a measure of the success of ATDM at managing the demand for the facility. Thus, for ATDM, demand is a performance measure of demand management actions of ATDM.
The VMT-Served is the sum of the products of the total link volumes for the time period of interest and the link lengths. VMT served is a measure of the productivity of facility, the improvement of which is one of the key objectives of ATDM.
Diagnostic Tip: VMT-Demand and VMT-Served are ATDM performance measures in their own right. However the difference between the two can be useful for determining if the analyst has selected the appropriate study area and study time for evaluation. For each scenario VMT-Demand should be equal or nearly equal to the VMT-Served for each scenario. This indicates that the analyst successfully selected a study area and peak period that was able to clear all demand for each of the scenarios. If VMT-Demand is greater than VMT-Served for any individual scenario, then the analyst may need to expand the study period or make a manual adjustment to the reported results to account for the unserved demand.
The Vehicle-Hours Traveled (VHT) is the sum of the products of the total link volumes and the average link travel times. Delays to vehicles prevented from entering the facility each 15-minute time slice (the methodology analyzes conditions in 15-minute time intervals, in accordance with HCM concepts) either by controls (such as ramp metering) termed vehicle hours of entry delay or by congestion (VHED), are added to and included in the reported VHT total.
The Vehicle-Hours Delay (VHD) is the difference between the VHT (including vehicle-entry delay) and the theoretical VHT if all links could be traversed at the free-flow speed with no entry delays. VHD is summed over all time slices within the scenario. VHD is useful in determining the economic costs and benefits of ATDM measures. VHD highlights the delay component of system VHT.
Vehicle-hours of entry delay (VHED) for a scenario is the number of vehicles prevented from entering the system each time slice, multiplied by the duration of the time slice and summed over all time slices. VHED should be included in the computed VHD and VHT for each scenario.
Equation 1
Where:
VHD = Vehicle-Hours Delay
VHT = Vehicle-hours traveled including vehicle entry delay.
VHT(FF) = Vehicle-hours traveled recomputed with segment free-flow speeds. Vehicle-entry delay is set to zero.
If multiple paths available to destination, then the VHT is computed for shortest travel time path at free-flow speeds.
Agencies may elect to exclude from the delay the difference between the free-flow speed and the speed at capacity. The vehicle-hours of delay then become the time spent in queuing.
Average System Speed (measured in miles per hour) is a measure of the efficiency of the highway system. It is computed by summing up the VMT-Served for each scenario and then dividing by the sum of the scenario VHTs (including any vehicle entry delay). One of the key objectives of ATDM is to maximize the productivity of the system, serving the greatest amount of VMT at the least cost to travelers in terms of VHT. Thus changes in the average system speed are a good overall indicator of the relative success of the ATDM strategy at achieving its objective of improving efficiency.
The Vehicle-Hours Delay/Vehicle-Trip (VHD/VT) is the vehicle-hours delay summed over all of the scenarios divided by the sum of the number of vehicle trips in the OD tables for all of the scenarios. This gives the average delay per vehicle, which is useful for conveying the results in a manner that can be related to personal experience.
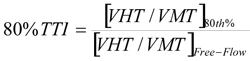
The 80th Percentile Travel Time Index is a measure of the reliability of travel times on the facility. While historically various travel time percentiles have been used to describe travel time reliability, it is recommended that the 80 percentile highest travel time be used for the predicted travel time. The 80th percentile travel time has a more stable relationship to the mean travel time than the 90th, 95th, or 99th percentiles, which is useful in predicting changes in reliability based on changes in the mean travel time. The formula for computing the 80th Percentile Travel Time Index is given below.
Equation 2
Where:
80%TTI = 80th Percentile Planning Travel Time Index
VHT(80%) = 80th percentile highest vehicle-hours traveled among the scenarios evaluated
VMT(80%) = Vehicle-miles traveled for scenario with 80th percentile highest vehicle-hours traveled among the scenarios evaluated
VHT(FF) = Vehicle-hours computed with segment free-flow speeds.
VMT(FF) = Vehicle-miles traveled with segment free-flow speeds.
The Planning Time Index (PTI) is a measure of the reliability of travel times on the facility. It is the ratio of the estimated travel time to the free-flow travel time. It is computed using Equation 2 with the 95th percentiles substituted for the 80th percentiles. For example, a PTI of 1.50 means that the traveler must allow 50% extra time over free-flow travel time to get to their destination on-time. Put another way, a commute will arrive late one day per month (1 of out 20 weekdays) if they plan their trip at the PTI.
VMT-Demand, VMT-Served, Vehicle-Hours Traveled, and Vehicle-Hours Delay are useful for most economic and environmental analyses. In addition, the basic performance measures are key components of the recommended measures of effectiveness for evaluating ATDM. The remaining performance measures are designed to address three key objectives of ATDM:
- To improve facility/system productivity;
- To improve facility/system efficiency; and
- To improve reliability.
3.4 Identifying Temporal Scope for the Performance Measure Computation
A typical HCM analysis focuses on facility performance for a single peak hour or a single peak period. An ATDM Analysis must consider how the facility performance will vary under varying weather, demand, and incident conditions over the course of one or more years. Thus, while a traditional HCM analysis is unidimensional, an ATDM Analysis must be multidimensional to capture the true performance benefits of ATDM. The methodology simply extends HCM analysis to cover all the possible conditions that influence travel, and combines them into a composite picture of facility performance.
When setting the temporal scope (hours of the day, days of the weeks, and weeks of the year) of an ATDM analysis it is easy to overwhelm the critical performance results by mixing them in with hours and days when there is no congestion. Thus just as an HCM analysis usually focuses on the peak period of a weekday, an ATDM analysis should focus on the peak period, but over all of the weekdays in the year.
The key to the ATDM analysis is to select a temporal range for the analysis (such as the morning or evening peak period for all nonholiday weekdays in a year) that is appropriate for the agency’s goals for facility operation. If the goal is to improve weekend and holiday performance, then weekends and holidays should be selected for the ATDM analysis. If the goal is to improve weekday performance then weekdays when the greatest demands are routinely placed on the facility (the morning and/or evening peak periods) should be selected for the analysis.
As shown in Figure 4 for U.S. 101 in Novato, California (San Francisco Bay area), when 24 hours a day are considered for every nonholiday weekday in the year, only 489 out of the 5,489 hours of the year (9%) are congested. The other 91% of the time, ATDM would have little effect on congestion and reliability (although may still have a positive effect on safety) since the facility is not congested. In addition, the vast majority of these uncongested hours are when there are very few people on the road (overnight). To better reflect the experience of the driving public, the hours should be weighted according to the number of people experiencing the condition.
Figure 4: U.S. 101 Weekday Travel Time Rate Distribution (24 hours/day)
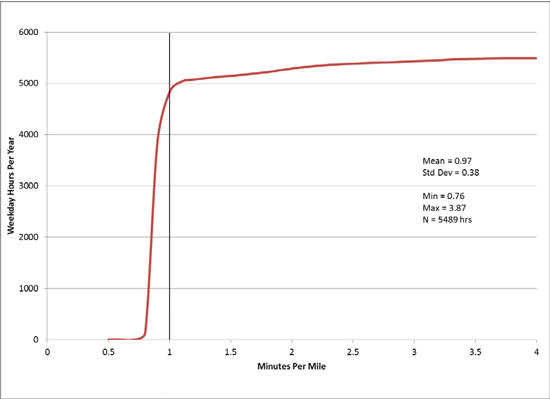
Source: Cambridge Systematics, Inc.
A more useful method for evaluating ATDM is to focus instead on the peak period (or periods) of each day when most drivers are experiencing the condition and when facility performance is most sensitive to minor changes in demand, weather, and incidents.
Figure 5 shows the same U.S. 101 facility performance, but this time focused only on the morning four-hour peak period (6-10 AM) when conditions are most unstable. During the AM peak period demands are more stable so it is more to accurate compare performance across hours and days, without weighting the hours by the volumes.
In this case fully 45% of the hours in the ATDM analysis temporal range are subject to congestion and will be valuable targets of ATDM improvements.
Figure 5: U.S. 101 Weekday AM Peak Period Travel Time Rate Distribution
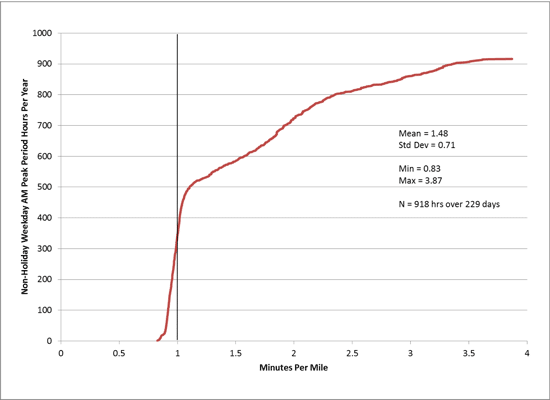
Source: Cambridge Systematics, Inc.
3.5 Example Performance Characteristics of Facilities
There is little experience at this point in time to guide agencies in the determination of acceptable and unacceptable levels of system performance in terms of the recommended performance measures for evaluating ATDM investments: Average Speed, Average Delay, the PTI, and the 80th Percentile Travel Time Index. For reference, field measurements from several data sources (roadway detectors deployed for operations and private vendor-supplied travel times) were used to develop performance profiles for several U.S. highway facilities; see Tables 2 and 3. A few notes on these tables:
- The AM period is 7:00 AM to 9:00 AM, the mid-day period is 11:00 AM to 2:00 PM, and the PM period is 4:00 P.M. to 6:00 PM. The length of the time period chosen will have a substantial effect on the measures.
- TTI is the Travel Time Index, the mean travel time divided by the free-flow travel time.
- BTI is the Buffer Time Index, computed as the 95th percentile travel time minus the mean travel time, all divided by the mean travel time. It is a measure of reliability.
- PTI is the Planning Time Index, the 95th percentile travel time divided by the free-flow travel time.
Notes: FFS = free-flow speed. TTI = Travel Time Index, BTI = Buffer Time Index. PTI = Planning Time Index.
The AM period is 7:00 AM to 9:00 AM, the mid-day period is 11:00 AM to 2:00 PM, and the PM period is 4:00 P.M. to 6:00 PM. The length of the time period chosen will have a substantial effect on the measures.
previous | next