Office of Operations
21st Century Operations Using 21st Century Technologies

Measures of Effectiveness and Validation Guidance for Adaptive Signal Control Technologies

Appendix H. Throughput Performance Metrics

Figure 66. Line Graph. Throughput Performance for ASCT versus Coordination – Volume Counter “C”, Southbound.
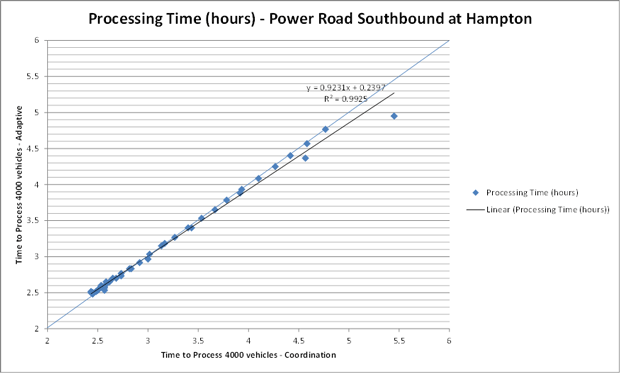
Figure 66. Line graph showing throughput performance for Adaptive Signal Control Technology versus Coordination – Volume Counter “C” southbound. The linear processing time in hours goes from 2.5 hours adaptive over 2.5 hours coordination to 5.3 hours adaptive over 5.5 hours coordination. The actual data points of processing times are clustered along this line, with one processing times outside the main grouping.

(Source: Kimley-Horn and Associates, Inc.)

Figure 67. Line Graph. Throughput Performance for ASCT versus Coordination – Volume Counter “B”, Eastbound.
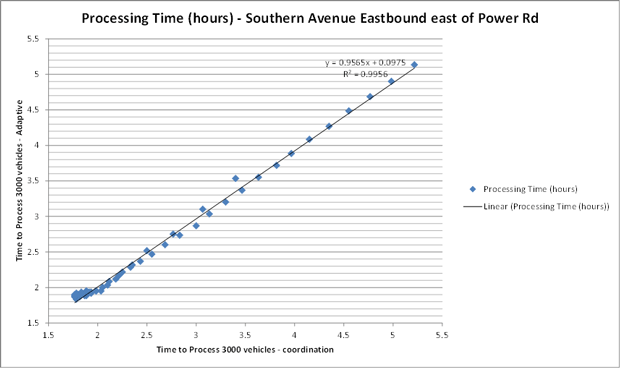
Figure 67. Line graph showing throughput performance for Adaptive Signal Control Technology versus Coordination – Volume Counter “B” eastbound. The linear processing time in hours goes from 1.8 hours adaptive over 1.8 hours coordination to 5.2 hours adaptive over 5.4 hours coordination. The actual data points of processing times are clustered along this line.

(Source: Kimley-Horn and Associates, Inc.)

Figure 68. Line Graph. Throughput Performance for ASCT versus Coordination – Volume Counter “B”, Westbound.
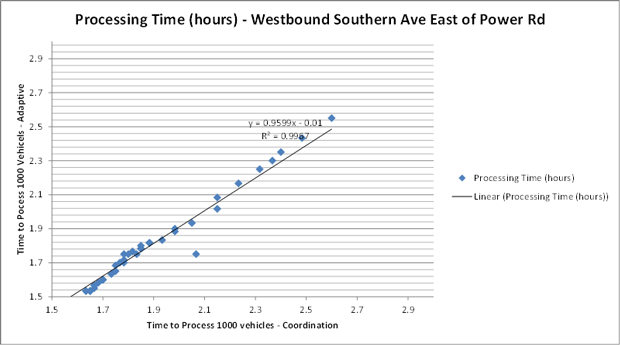
Figure 68. Line graph showing throughput performance for Adaptive Signal Control Technology versus Coordination – Volume Counter “B” westbound. The linear processing time in hours goes from 1.5 hours adaptive over 1.6 hours coordination to 2.45 hours adaptive over 2.7 hours coordination. The actual data points of processing times are clustered along this line, with one processing times outside the main grouping.

(Source: Kimley-Horn and Associates, Inc.)

Figure 69. Line Graph. Throughput Performance for ASCT versus Coordination – Volume Counter “D”, Northbound.
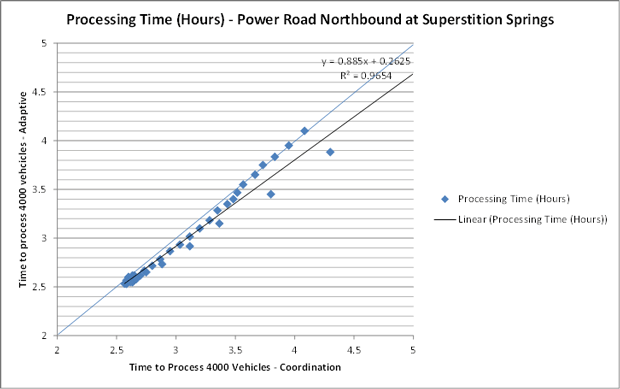
Figure 69. Line graph showing throughput performance for Adaptive Signal Control Technology versus Coordination – Volume Counter “D” northbound. The linear processing time in hours goes from 2.5 hours adaptive over 2.5 hours coordination to 4.7 hours adaptive over 5.0 hours coordination. The actual data points of processing times are clustered along this line.

(Source: Kimley-Horn and Associates, Inc.)

Figure 70. Line Graph. Throughput Performance by Time of Day – Volume Counter ”D”, Northbound.
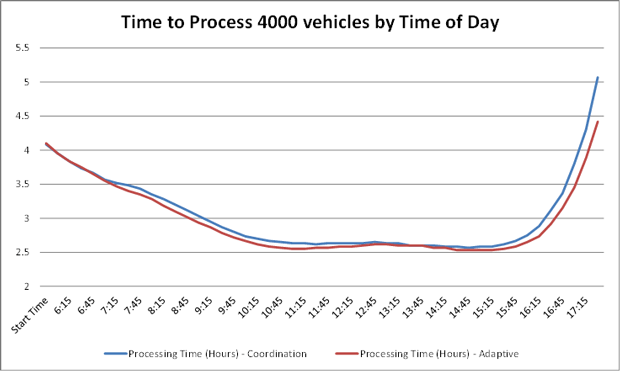
Figure 70. Line graph showing throughput performance by time of day – Volume Counter “D” northbound. The time to process goes from 2 hours to 5.5 hours, and the time of day goes from 6:15 to 17:15 in thirty minute increments. The processing time adaptive and coordination both begin about 4.1 with a bowed low line, up at 2.5 hour from 10:15 to 15:45, climbing up to 4.5 at 17:15 hour.

(Source: Kimley-Horn and Associates, Inc.)

Figure 71. Line Graph. Throughput Performance for ASCT versus Coordination – Volume Counter “D”, Southbound.
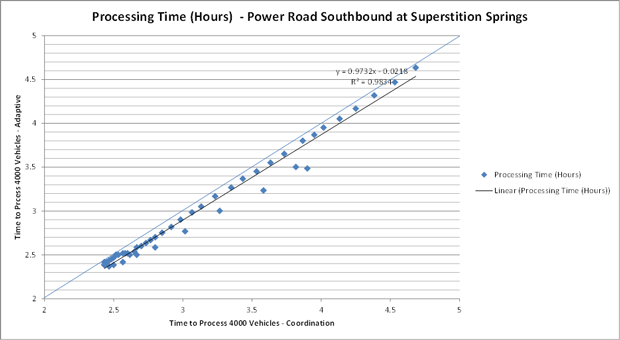
Figure 71. Line graph showing throughput performance for Adaptive Signal Control Technology versus Coordination – Volume Counter “D” southbound. The linear processing time in hours goes from 2.4 hours adaptive over 2.5 hours coordination to 4.5 hours adaptive over 4.7 hours coordination. The actual data points of processing times are clustered along this line.

(Source: Kimley-Horn and Associates, Inc.)

Figure 72. Line Graph. Throughput Performance for ASCT versus Coordination – Volume Counter “A”, Westbound.
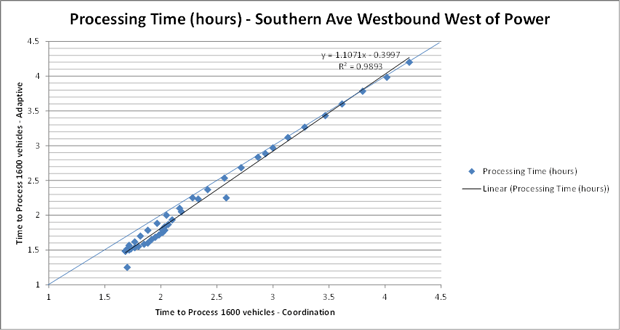
Figure 72. Line graph showing throughput performance for Adaptive Signal Control Technology versus Coordination – Volume Counter “A” westbound. The linear processing time in hours goes from 1.5 hours adaptive over 1.6 hours coordination to 4.2 hours adaptive over 4.2 hours coordination. The actual data points of processing times are clustered along this line, with two processing times outside the main grouping.

(Source: Kimley-Horn and Associates, Inc.)

Figure 73. Line Graph. Throughput Performance for ASCT versus Coordination – Volume Counter “A”, Eastbound.
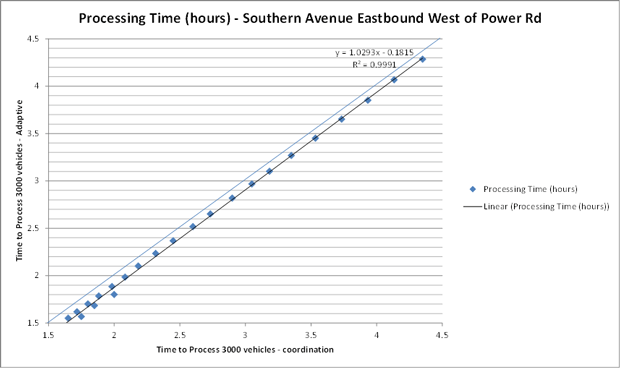
Figure 73. Line graph showing throughput performance for Adaptive Signal Control Technology versus Coordination – Volume Counter “A” eastbound. The linear processing time in hours goes from 1.5 hours adaptive over 1.6 hours coordination to 4.3 hours adaptive over 4.4 hours coordination. The actual data points of processing times are clustered along this line.

(Source: Kimley-Horn and Associates, Inc.)