Measuring Border Delay and Crossing Times at the US–Mexico Border
Final Report
Automated Crossing and Wait Time Measurement
(You will need the Adobe Acrobat Reader to view the PDFs on this page.)
CHAPTER 4: TECHNOLOGY IDENTIFICATION, SELECTION, AND IMPLEMENTATION
Objectives and Approach
The overall goal of the Part II project initially was to implement a system that would automatically and accurately collect data, measure, and disseminate wait and crossing times for US-bound commercial freight at BOTA. Additionally, the proposed system had to be designed to sustain long-term data collection in real-world operations and be easily transferable (as a design concept) to other POEs desiring it along the northern and southern borders of the United States.
As stated in the Background and Overview section of this report, FHWA has sponsored several other initiatives aimed at identifying technologies that could be used to calculate crossing times for US-bound commercial freight at the US–Mexico border. These previous efforts were used to aid in the technology selection for the BOTA technology implementation project.
The technology selection for this project consisted of two parts. The Part I initiative that preceded the activity that this report is based on was a technology assessment that identified technologies that were best suited to achieve the overall goal of this project. Part II involved two specific objectives: 1) selecting a final technology for the BOTA border crossing time measurement system, and 2) implementing the system itself. (It should be noted that during the project, the objective expanded to include a system of comparable configuration to obtain wait time at Pharr-Reynosa, where crossing time was already being measured.) The outcomes of Part I and Part II are described below.
Part I – Technology Identification
Technology Trade-Off Analysis
For the Part I study, six different technologies that could potentially facilitate the automatic measurement of border crossing times for commercial freight vehicles were identified and analyzed. This study, also entitled “Measuring Border Delay and Crossing Times at the US–Mexico Border,” provided a comparative analysis of the six selected technologies in its Part I–Tasks 1 and 2 Report. The full report can be found at http://tti.tamu.edu/documents/TTI-2007-1.pdf. The six technologies examined in the study’s Part I Report were:
- Automatic Vehicle Identification (AVI).
- AVI using Laser Frequency.
- AVI using Radio Frequency (Radio Frequency Identification – RFID).
- AVI using Infrared Frequency.
- Automatic License Plate Recognition (ALPR).
- Vehicle Matching.
- Automatic Vehicle Location (AVL).
- Global Positioning Systems (GPS).
- Mobile Phone Location.
- Inductive Loop Detectors.
Factors such as cost, accuracy of readings, availability, and reliability were analyzed for each of the technologies listed above. Table 2 summarizes the results of the initial analysis from the Part I study by listing the advantages and disadvantages of the six technologies below.
| Technology | Advantages | Disadvantages |
|---|---|---|
| AVI |
|
|
| AVL |
|
|
| Mobile Phone Location |
|
|
| ALPR |
|
|
| Vehicle Matching |
|
|
| Loop Detectors |
|
|
From the initial analysis, it was concluded that three of these six technologies were most appropriate to support a system that would sustain long-term data collection and be easily transferable to other POEs along the southern and northern borders of the United States. AVI (specifically with RFID), AVL (specifically with GPS), and ALPR all appeared to have the requisite characteristics to be considered for a crossing time measurement system.
After reviewing the initial assessment, the FHWA determined that the benefits of using RFID and GPS to measure commercial freight border crossing times outweighed the concerns associated with each technology. The ALPR generation available at the time was viewed as good technology, just not as cost-effective overall for crossing time calculation as RFID and GPS (NOTE: ALPR was not tested as were RFID and GPS). Some of the important benefits of the RFID and GPS technologies are described as follows.
Benefits of using RFID:
- CBP was currently using RFID transponders in commercial vehicles that could be used to capture data by this proposed system.
- Data collected for the border wait times can easily be shared with CBP and the DPS.
- DPS was planning to install RFID readers at several of their BSIFs.
Benefits of using GPS:
- The data collected are very precise
- The information received could be used to measure border wait times and locate exactly where delays are occurring.
- Real-time information is provided.
It should also be noted that not every truck need have a tag for an RFID system to produce beneficial results. RFID and GPS were subsequently chosen as the two technologies considered best suited to support a system that automatically measures commercial freight border crossing times.
Bench Test of RFID Technology
Based on the results of the analysis performed during Part I activity, a bench test of RFID technology was conducted in a real world setting. In July 2008, a demonstration of passive RFID tag reading was coordinated using a portable setup in Austin, Texas. Within the last few years, several toll facilities had become operational in the Austin area, which put a reasonable population of RFID toll transponders (TxTags) on the area roadways. Additionally, the large number of overpasses in Austin provided an opportunity to gain easy access above the travel lanes. The bench test had two specific objectives: 1) measure the reliability of tag reads, and 2) demonstrate that tag reads between two points can be used to calculate the travel time between those two points. The results of the bench test by objective are documented below.
Objective 1 – Measure the Reliability of Tag Reads
The panel antennas were each mounted over a single lane, and tag read data were captured to a laptop using a Transcore model 2210 reader. The tag count gathered during this period was used as the baseline. This count was done by visually inspecting cars for TxTags under their windshields from overhead as they passed underneath the overpass. Electronic tags were read until the visual count reached 100 tags. The portable tag reading system reported 95 tags in one test and 103 in another compared to the visual count of 100. The differentials are small and errors easily could have arisen from visually misjudging a tag as well as traffic weaving near the reader location. In general, the portable system proved to be a reliable way to interrogate toll tags from an overhead structure. Further testing revealed that a single antenna mounted over the stripe between two lanes did a very good job of acquiring tags in both lanes, even though it is designed for reading only a single lane.
Objective 2 – Calculating Travel Times
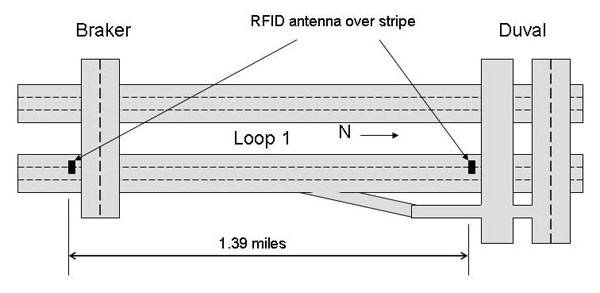
A demonstration of travel time measurement with portable equipment was conducted on a small portion of Loop 1 northbound between the Braker Street and Duval Street overpasses in Austin. Testing occurred during off-peak hours with traffic speeds averaging 65 miles per hour (mph). The goal was to show that enough toll tag identification numbers (IDs) could be acquired at each location to provide a reasonable number of tag ID matches per minute, resulting in a travel time estimate between the two locations. One station was located on the Braker Street overpass at Loop 1. A single panel antenna was positioned over the center stripe between the center and median lane. An identical setup was deployed at Duval Street. The setup for this demonstration is illustrated in figure 14. The single antenna solution gathered data both from the center and median lanes; however, since the antenna was not optimally placed for either lane, it likely missed a small fraction of tags in those lanes. Vehicles in the shoulder lane were not read at either location. The exit ramp for Duval Street offered the only alternate travel path between the two reader locations.
The demonstration logged tags from both sites for approximately 30 minutes in the noon hour (off-peak) on July 24, 2008. The clocks on the recording equipment (i.e., laptop) at both locations were manually synchronized prior to collecting data. Note that this experiment was a rather simple deployment, which approached the limits of the RFID system capabilities. A normal deployment would place a single antenna over every lane at each site. It was impossible to match any vehicles in the shoulder lane and any vehicles that may have moved into the shoulder lane between Braker and Duval Streets such as vehicles taking the exit. A full deployment would not have this limitation and thus the results should be better (i.e., more tag matches between Braker and Duval Streets) than those in this experiment.
The total tags acquired at each site varied by approximately 90 tags, which is a significant amount. These numbers either reflected a poor reliability performance by the reader at Braker Street or could have been an indication of the traffic pattern near the Duval Street site. Vehicles may have had a tendency to choose the median and center lane for their upcoming entrance onto the tolled portion of Loop 1.
The results of this bench test exercise demonstrated that a system using RFID technology could be implemented to automatically capture the travel times of vehicles traveling between two points. Also, this test proved that the data collected by the system can be used to calculate average travel times of the vehicles passing through the system on an interval basis. Finally, testing two different RFID tag types (the TxTag and the DPS tag) demonstrated that the RFID equipment to be used for the proposed system could be configured to read different types of tags.
Part II - Technology Selection
The Part II project had a technology selection component, which focused more on the risks associated with using the two candidate technologies identified in the Part I analysis (i.e., RFID and GPS). The findings of the risks associated with using both RFID and GPS technologies are summarized in table 3.
| Technology | Potential Risks |
|---|---|
| RFID |
|
| GPS |
|
After analyzing the advantages and disadvantages of both RFID and GPS technologies, RFID was selected as the recommended technology for the border crossing time measurement system at BOTA. The final portion of the Part II Technology Assessment included a stakeholder meeting in El Paso, TX. This first stakeholder meeting was held on February 20, 2008 in El Paso, TX. Stakeholders invited to this meeting included representatives from the following organizations:
- Mexican Public Stakeholders.
- Customs (Aduana).
- Department of Transportation (SCT).
- General Services Administration (INDABIN).
- State Department (SRE).
- Ciudad Juárez Metropolitan Planning Organization (IMIP).
- Ciudad Juárez.
- Mexican Private Stakeholders.
- Maquila Association (AMAC).
- Local Transportation Service Providers.
- US Public Stakeholders.
- CBP.
- Texas DPS.
- FHWA.
- FMCSA.
- TxDOT.
- New Mexico Dept. of Transportation (NMDOT).
- El Paso Metropolitan Planning Organization (MPO).
- City of El Paso.
- County of El Paso.
- Camino Real Regional Mobility Authority.
- GSA.
- Local University Representatives.
There were two main goals for this stakeholder meeting. The first was to validate with stakeholders the selection of RFID as the technology that would be used to measure border crossing times at BOTA. The second was to solicit ongoing stakeholder participation for the duration of the project, particularly from those stakeholders more involved in the commercial freight crossing process.
In order to meet the first goal of identifying the technology to be used, background information on the Part II project and the results of the Part I analysis of six different technologies that could support border crossing time measurements were considered. A discussion aimed at addressing any stakeholder questions and/or concerns about RFID technology and the proposed system was facilitated. This discussion also stressed that the project’s interest was in aggregated transportation data. It was made clear that the intended implementation did not seek to determine the identity of any driver, vehicle, or motor carrier, and the envisioned RFID system would not reveal identity anyway. There were no objections to the proposed RFID system by the local stakeholders, which validated the initial assessment that RFID was the best-suited technology to measure border crossing times at BOTA.
However, some stakeholders did express an interest in collecting more detailed data for each US-Mexico border crossing. The original proposed system established two measuring locations (one before the queue on the Mexican side of the border and one after the BSIF on the US side) where RFID equipment would be installed in order to calculate the total crossing time for a US-bound trip. In order to collect more detailed data, additional measuring locations could be set up between each inspection facility in the US-bound border crossing process to segment the trip and measure the time a truck spends in each facility. (Segmentation would eventually be accomplished by installation of the additional reader station at the CBP primary inspection booths and modification of the algorithm to also measure wait times.)
Based on the Part I and Part II analyses and an assessment of BOTA’s operational characteristics, RFID was confirmed as the technology that would be used to measure commercial vehicle border crossing times at BOTA. Both GPS and RFID technologies were considered highly capable of sustaining this particular system; however, several factors at BOTA contributed to RFID’s selection. These factors included:
- Both CBP and DPS were currently using RFID in their facilities at BOTA. DPS installed several RFID stations inside its BSIF compound and distributed transponders to shippers and carriers on a voluntary basis.
- A high percentage of carriers were outfitted with RFID tags in order to comply with CBP and DPS initiatives at BOTA and the El Paso–Ciudad Juárez region.
- Because of substantial infrastructure investments by CBP and DPS, it appeared that RFID would continue to be utilized in the long run at other land border crossings along the US–Mexico border.
- Both DPS and TxDOT were willing to cooperate with the project team, and CBP expressed interest in the project.
- Local private stakeholders during the stakeholder meeting in El Paso favored RFID because of its “non-intrusive” capabilities .
After receiving final approval from the FHWA for the selection of RFID as the technology to be used, the RFID-based system was implemented. The design and installation of the system are summarized in subsequent sections of this report.
Part II - Implementation at BOTA Border Crossing
In Part II, the results of the Part I technology trade-off analysis were revisited and the recommended technologies verified to be still applicable. Bridge of the Americas in the vicinity of El Paso–Ciudad Juárez was considered for the RFID system implementation. Subsequently, in 2009 two RFID reader stations were installed at the port of entry to measure crossing times of US-bound trucks, followed by installation of a third reader at the CPB’s primary inspection facility in 2011. Around the same time, RFID readers were installed at CBP’s primary inspection facility at Pharr-Reynosa. TxDOT had earlier implemented a similar system at Pharr-Reynosa with capabilities to measure crossing time only.
This section of the report deals with systems engineering process utilized by the research team leading to a successful implementation of the system at both BOTA and Pharr-Reynosa. It also provides information regarding design and installation of equipment in the field as well as aggregation of data, archival and dissemination processes. Evaluation of both systems were also conducted, results of which are described in the following chapter.
Site Characterization and Identification of RFID Reader Locations
The pilot implementation conducted did not endeavor to install the optimal system for all users; rather the implementation was designed in a way that can be reconfigured. For example, in view of the above discussion of border delay and crossing times, it would be possible to discriminate shipments among FAST, non-FAST that go through primary inspection only, and non-FAST that go through secondary inspection. At BOTA, there was initially a concept for where five reader stations could be located to provide the greatest segmentation benefit. As shown in figure 15, the five reader locations that were identified would provide segmentation of the commercial vehicle crossing and allow identification of what steps in the crossing process were introducing delays.
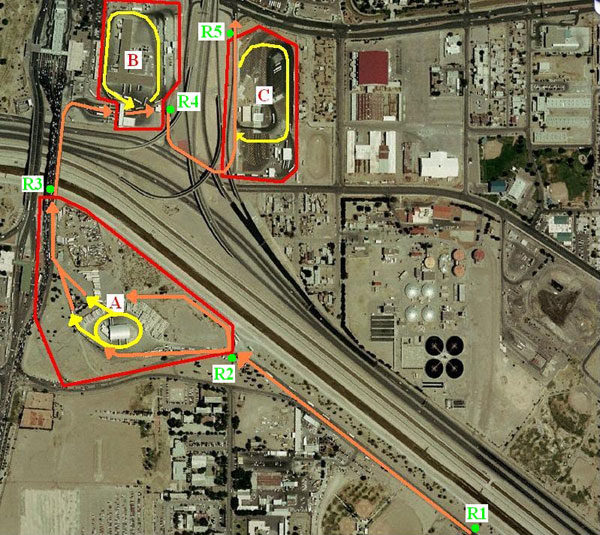
Red lines outline the three distinct facility compounds at BOTA, designated by boxes with red letters:
(A) Mexican Export Lot, (B) US Federal compound, and (C) BSIF,
Orange line indicates basic direction of flow for all US-bound trucks crossing the border
Yellow line indicates internal route within a compound taken by trucks selected for secondary inspection
Green dots indicate the location of originally proposed reader sites, whose numbering is indicated by the adjacent boxes with green “R” and number
(Note that the time for a vehicle to progress from R1 to R3 as shown generally corresponds to wait time, although it can be seen in figure 15 that R3 is somewhat “upstream” from CBP primary and thus technically did not fully meet the wait time definition.)
While there was interest in the five reader locations and the benefits that would accrue from different combinations of reader locations, ultimately there were two readers initially implemented, corresponding to R1 and R5 in figure 15.
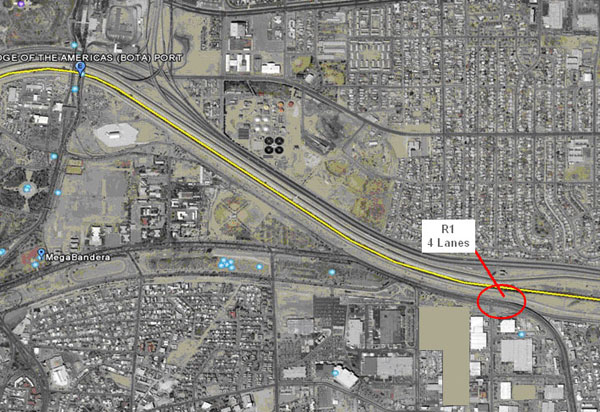
The initial intended location for RFID reader station R1 shown in Figure 15 had to be moved upstream to the convergence of Boulevard Cuatro Siglos and Mexican Highway 45 approximately ½ mile southeast of BOTA due to construction on the approach roadways on the Ciudad Juárez side during this project. (The yellow line in figure 16 is the international border along the Rio Grande).
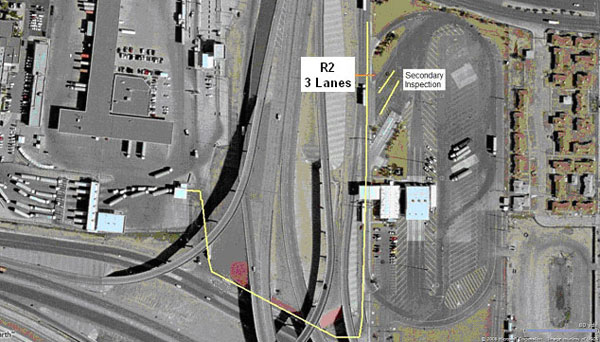
Station R5 in figure 15 was later re-designated as R2, although its location did not change. Figure 16 shows the location of the R2 RFID reader station on the US side at the exit of the State’s inspection facility. The yellow line in figure 17 is the generally counter-clockwise direction of flow of trucks that have left the CBP facility and are cleared to depart without secondary inspection).
System Requirements for a Border Crossing Time Measurement System
A second stakeholder meeting which took place on April 16, 2009 was coordinated as part of this project. The second stakeholder meeting was meant to provide stakeholders in the El Paso–Ciudad Juárez region with an update on progress toward implementation of the RFID-based border crossing time measurement system. The second stakeholder meeting included a project overview, reviewed current progress toward implementation, examined planned RFID reader sites, discussed the system design and installation plans, described the October 2008 limited field test and results at BOTA, presented the concept for the prototype automated crossing time measurement system, and discussed next steps. The attendees were essentially the same as the previous (first) stakeholder meeting.
The response from stakeholders who attended this meeting was overwhelmingly positive, as substantial progress had been made on the system’s implementation since the first stakeholder meeting in February 2008. From this meeting, as well as from previous tasks in this project, a group of stakeholder needs for the border crossing time measurement system were confirmed. The following is a list of the system users’ high-level needs:
- The system should not interfere in any way with day-to-day operations at BOTA. The process of vehicle detection shall not impact the speed or path of vehicles through the facilities.
- The system should be focused on analysis of aggregated data rather than the identity of drivers, shipments, and trucks in order to maintain anonymity. The goal is to generate average crossing times from individual vehicle data and not to specifically track and store crossing times of individual vehicles.
- Processed travel time data should be available to authorized subscribers through Web viewing.
- Access to archived crossing time information would be beneficial.
- Obtaining segmented trip data would be desirable but not absolutely essential to the success of the project.
In order to meet the needs of the public and private stakeholders, the project team confirmed the following list of system requirements. These system requirements were formulated through analyses of BOTA operations, RFID technology, and stakeholder meetings/interviews.
- The system needs to automatically measure the time required for a US-bound truck to cross from a pre-determined point upstream of the typical queue on the Mexican side to the exit of the BOTA POE on the US side.
- The system must not require the interaction of either drivers or employees of agencies manning the POE on either side of the border during normal operation, other than to report on a visible anomaly such as damaged system hardware (e.g., a tag reader antenna).
- System failure must not affect operations at the POE.
- The system will not require an interface to any current equipment or data streams in use at the POE. The system will not rely on data from other parties to be effective, although data from these parties may be incorporated at some point to increase the overall value of the project.
- The commercial vehicles are expected to have RFID tags using either the TransCore eGo or American Trucking Associations (ATA) tag protocol (based on information received from TxDOT). The field tag reader equipment shall be able to read tags of either protocol.
- For an RFID tag-reading system of this type to be operationally useful, it is not necessary for all or even a high percentage of the trucks to have tags. Similarly, the reader stations are not required to read and record every tag as in a tolling application. There is room for misreads. The match rate of readable tags (i.e., a percentage representing the capability of the system to detect and pair the ID of a tag when it passes readers at different field stations) is expected to be a lower percentage than the percentage of tags detected by the initial tag reader compared to total truck volume. That reality is due to trucks that pass the first reader but divert and do not cross the border, trucks that cross the border but are not allowed to exit, and trucks that are sent to secondary inspection and are “timed out” of the crossing time calculation. (It should be noted that the number of tags matched in this process is referred to in this report as the sample size.)
- The field station design must also include a solar powered option to support deployment in a more remote area or an area with unreliable electrical service.
- The field stations shall be capable of maintaining an accurate time clock, at least accurate to the minute, for use in time-stamping tag reads. Other approaches that can maintain time synchronization are also acceptable.
- The field tag reading stations should be physically compact as components may need to be installed on current traffic signal or new light weight pole installations.
- All field equipment should exhibit sufficient environmental specifications to ensure proper operation in the El Paso area climate.
- The field station design should incorporate a method to detect malfunctioning equipment and attempt to self-correct or otherwise compensate for the problem. This is particularly necessary for the communication link.
- The design shall utilize off-the-shelf components, which can readily be purchased in case a repair is required.
- The field station design shall be such that little ongoing maintenance is required since the sites may be difficult to access without prior authorization.
- The field station should be designed to remain operational after the term of this project. It is anticipated that another agency will assume responsibility for the operation and maintenance of the system at the end of the project.
- The project’s Central System will reside at the Texas Transportation Institute’s El Paso, Texas, office.
- All data created during the course of the project shall be stored in an archive for potential future use.
- The project will calculate current average border crossing times for US-bound commercial vehicles utilizing BOTA.
- Project output data shall follow accepted Internet standards for data subscription/syndication.
- Processed travel time data need to be available to authorized subscribers having password protection (e.g., CBP, City of El Paso and Ciudad Juárez bridge operations, Texas DPS, TxDOT) through Web viewing.
System Engineering Methodology
With a system requirements list in place, a concept of operations (ConOps) for the border crossing time measurement system was developed. The ConOps describes the organization and operation of the system. Following is a summary of the project’s design (the project’s Final System Design with Architecture Appendix documents the following in greater detail).
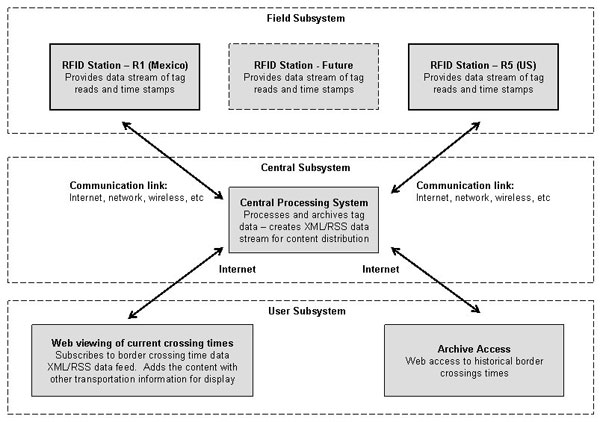
The border crossing measurement solution is organized into three subsystems representative of each component’s function. The three subsystems are:
- Field Subsystem.
- Central Subsystem.
- User Subsystem.
The Field Subsystem is comprised of the tag detection stations including the communication equipment. A minimum of two detection stations are required, one in Mexico and one in the United States. The detection station reads RFID tags and passes the data to the Central Subsystem via the communication equipment. The Central Subsystem receives tag reads from the field detection stations and performs all processing to derive and archive the aggregate travel times between the stations. The User Subsystem interacts with the Central Subsystem to provide an Internet web portal for data users (stakeholders, the public, etc.) to access current border crossing times and, if given proper credentials, to access archived crossing time data. Figure 18 shows the subsystem’s organization.
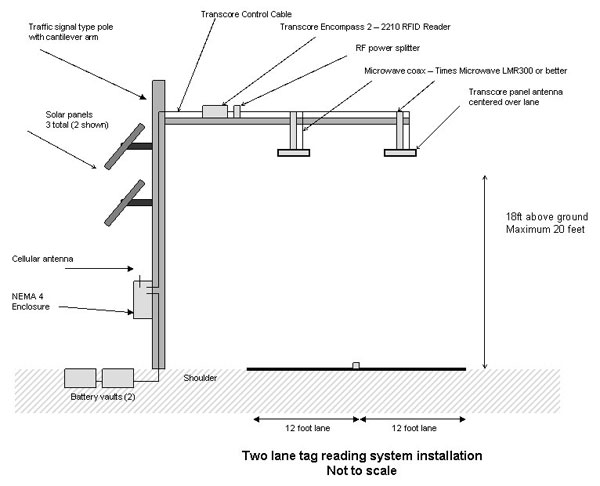
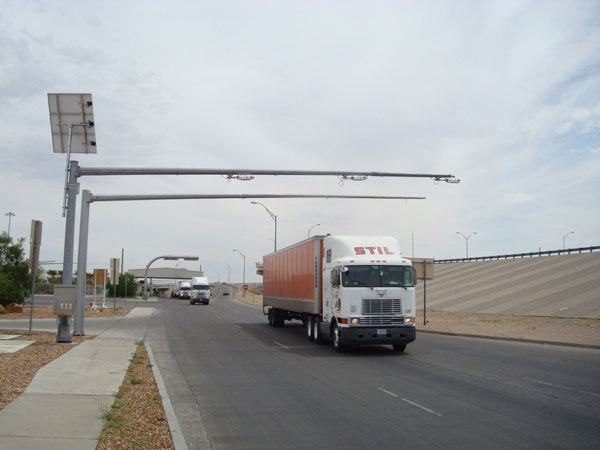
Northbound commercial vehicles (trucks in Mexico intending to cross the border into the United States) pass an RFID tag reader installed at a point sufficiently ahead of the end of any queue on the Mexican Export Lot. This reader station is defined as R1. RFID tags on the trucks are read as they pass the reader station. The tag query process recovers a unique identifier for each vehicle similar to a serial number. The reader station applies a time-stamp to the tag read and forwards the resulting data record to a central location for further processing via a data communication link. A similar tag reading station is installed at the exit of the BSIF. This station also time-stamps tag reads and forwards the data record to the central facility. There are several options for a communication link including public and private wireless and wire line. The data bandwidth requirements for each station are not excessive and could easily be met by each of these alternatives. An example detection station is shown below in figure 19.
The central facility receives data from all tag reading stations associated with the project (there were two stations installed initially at BOTA). The facility stores all inbound raw reader station data and subsequent processed data in an archive for future access and use by regional transportation agencies and other authorized stakeholders. In essence, the central facility acts as a data center for the project and therefore should be located in a reasonably secure building with reliable electric service and with personnel available to provide technical support as needed.
The raw data are processed to match tag reads of individual trucks at the entrance point on the Mexican side and the exit point on the US side. The difference in time-stamps yields a single truck’s progression as a function of time through the POE. It should be noted that the border crossing time is the sum of the time incurred on the Mexican side (Aduana, or Mexican Customs), the CBP facility, and the BSIF. If more reader stations are incorporated, producing trip segmentation, a better picture of the progression can be obtained using the same technique. The tag matching process is executed periodically to obtain a reasonable sample of trucks to produce an average.
The average US-bound crossing time was made a shareable resource. The User Subsystem manages access and creates web displays using the border crossing time data. The crossing time data are available via a simple subscription service as well as accessing a project related webpage. Archived data may also be available through the project’s prototype web tool website (discussed later).
Equipment Purchase and Bench Testing
An equipment list was generated from the Final Design Document, and all identified products were procured in quantities to build two complete field detection stations. Transcore was selected as the vendor for all the RFID equipment (tag readers, antennas, cabling, etc.) to ensure compatibility with the FAST and TxDOT/DPS eGo technology windshield tags in use at BOTA. Various other vendors (B&B Electronics, Verizon Wireless, Digi International, etc.) were selected for the other, more generic, items required to construct the field detection stations.
Each field detection site back panel was assembled, configured, and tested in a project facility. Figure 20 shows an example of the back panel, which holds all the equipment for the station and is designed to be installed in the actual field cabinet as a single item. This method allowed the full suite of equipment for each detection site to be tested before it was permanently installed.
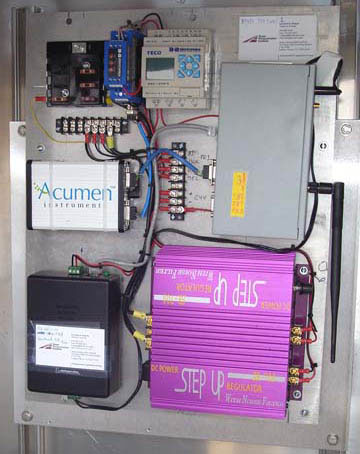
Each detection site was fully bench tested which included (but was not limited to):
- RFID reader testing using sample tags to insure proper operation.
- Wireless communication link characteristics (bandwidth, addressing, stability, etc.).
- System watchdog (auto rebooting of wireless router) operation.
- Manual rebooting of the wireless system via web commands.
- Time-stamping and logging of sample tag data.
- Remote access to logged data.
- Timely wireless transmission of tag read data to a remote facility.
- RFID reader shutdown during a defined period of time (turn off when bridge operation is closed to reduce energy consumption).
Each detection site cabinet was subject to a 48-hour burn-in process in an attempt to uncover any design flaws or product defects prior to installation in the field. The two detection sites were specified to be solar powered which required the purchase of solar modules (solar panels), storage batteries, and power regulation equipment. This equipment was purchased and delivered to a project office in El Paso, Texas. The solar products were transferred to the construction contractor for field installation.
Equipment Installation
In February 2009, approval to break ground at the BSIF was granted by the TxDOT El Paso District, and approval to break ground at the Ciudad Juárez site was granted by IMIP, as the cognizant agencies. The detection site equipment was assembled and tested at another project facility and shipped to El Paso for final installation by the designated construction contractors. Contracts for the installation were signed in April 2009. Installation on the US side began on April 15, 2009 and completed on May 13, 2009. Installation on the Mexico side began on May 10, 2009 and completed on July 7, 2009. The contractors were tasked with providing all field hardware needed to install an RFID tag detection station similar to ones previously installed by TxDOT at the BSIF. The contractors installed a traffic signal style steel pole and cantilever arm, ground boxes to house solar storage batteries, solar panels, and a pole cabinet large enough to house the equipment back panels. The contractors also installed the RFID antennas over the lanes as directed. Figure 21 shows antennas being installed on the US side just past where the trucks depart from the BSIF.
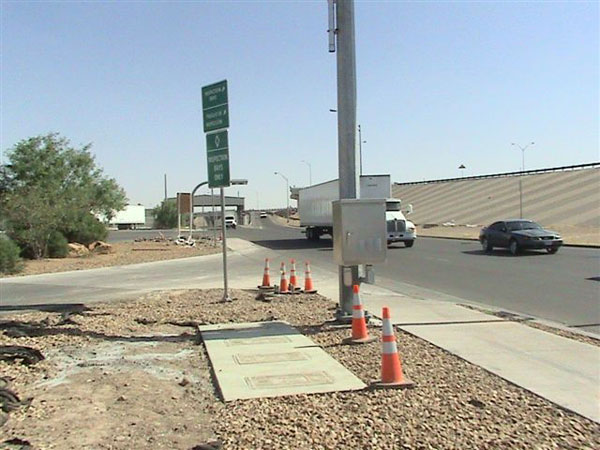
Figures 22 through 25 show different aspects of hardware installed on the Ciudad Juárez side. Note that in figure 22, roadway construction is in progress at the site of the RFID station.
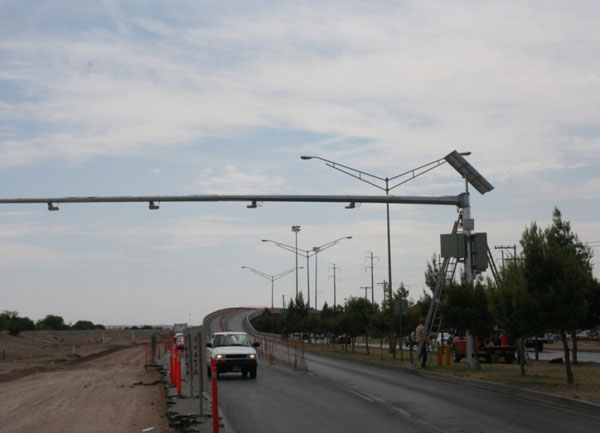
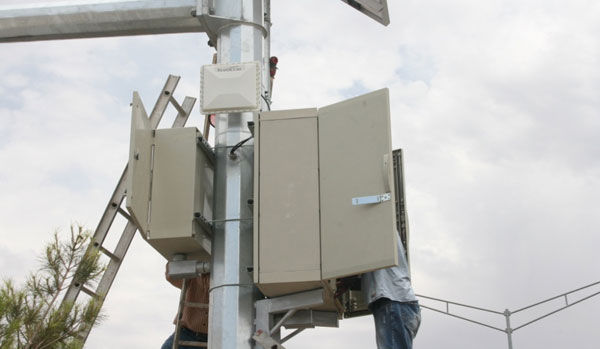
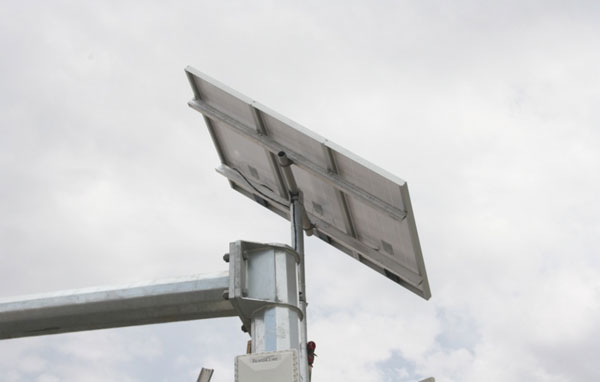
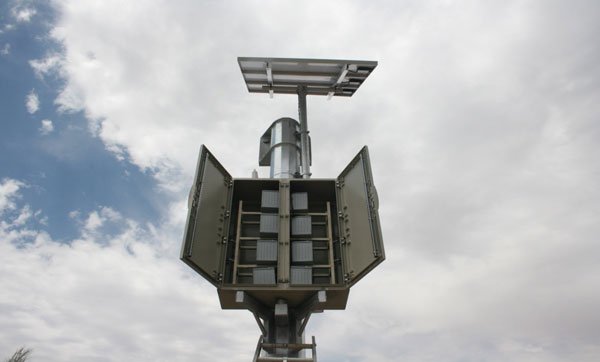
Figure 26 and figure 27 show hardware installed on the El Paso side. Trucks are northbound on Gateway Boulevard North, which after a short distance intersects with East Paisano Drive providing access to the El Paso roadway system.
Before performing the installation at the CBP primary inspection booths, a compatibility test was conducted on August 17, 2010 at the Pharr-Reynosa POE that successfully demonstrated the planned RFID configuration at CBP primary inspection booths does not interfere electronically with CBP systems at both POEs. In January 2011, CBP recommended approval of—and the GSA approved—the permit for RFID installation at primary inspection booths at the BOTA and Pharr-Reynosa POEs.
System Test and Evaluation
The system went online for its first full day of tag data matching on July 8, 2009. Northbound commercial freight crossing time data started to be received, measured, and archived by the central server at a project office in El Paso, several miles away. The Test & Evaluation Plan was then executed. The resulting Test and Evaluation Report describes various system level (i.e., field subsystem, central subsystem, and full system) tests performed to verify the proper operation of the RFID system and its hardware and software components. The tests were intended to establish the high-level working nature of the system and not to test individual system components for specification compliance. Tests were performed for each subsystem and its hardware and software components. All the tests were successful, and no errors were found in the way individual components of various subsystems were operating.
The system evaluation consisted of comparing average crossing times measured by the RFID and license plate data collected in the field to evaluate the efficiency and accuracy of the system. Evaluation of crossing time data and later wait time data is described in detail in Chapter 8.
Relocation of RFID Reader Station in Mexico
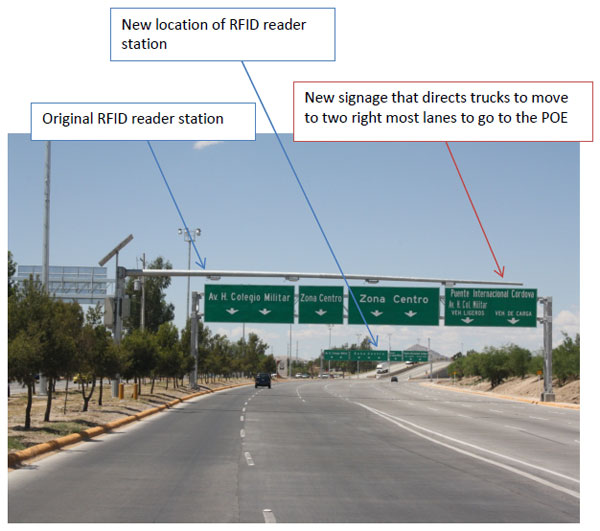
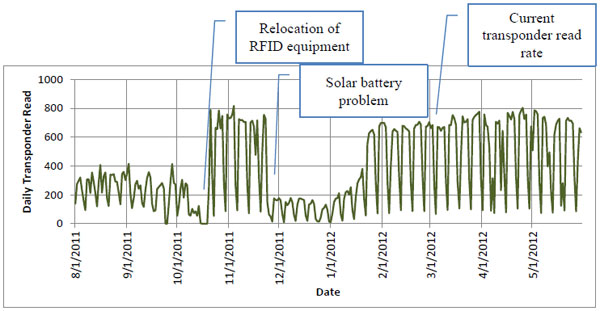
When the RFID reader station in Mexico was originally deployed there were four northbound lanes. Months later, after re-construction of the roadway by the Mexican government, the number of lanes was expanded to seven. In addition, a new display sign was put in place that directed trucks to move to the right-most lanes to proceed to the BOTA POE. This diverted trucks from passing under the RFID antennas and eventually resulted in the RFID reader station identifying a less-than-desirable number of transponders. Eventually a decision was made to remove the RFID reader station and mount the antenna on to a new sign gantry farther downstream as shown in figure 28.
Figure 28 shows a photograph from the site with the original RFID reader station, additional lanes, the new signage that directs truck to stay on right most lane, and the new location of the RFID reader station. Figure 29 shows a photograph of relocated RFID equipment into the new signage.
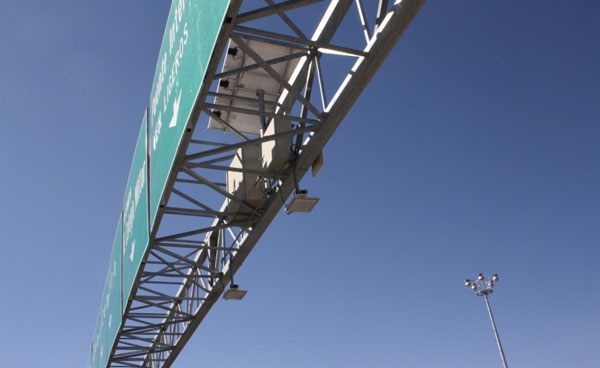
The relocation of the RFID equipment was conducted on October 15-20, 2011. Subsequent to the relocation, the number of transponder reads from the station and the sample size increased substantially, as shown in figure 30.
Installation of RFID Readers at CBP
In addition to crossing times, wait times are also important factors for shippers, carriers, and other stakeholders. Consequently, in November 2009 FHWA initiated discussions with CBP about the feasibility of RFID installations at its primary inspection facilities at international land border crossings on the US–Mexico border. Such an installation where there is already a crossing time measurement system enables the same system to also measure wait time of US-bound commercial vehicles. That discussion resulted in CBP approval of RFID installations at the primary inspection facility locations at two Texas POEs: BOTA and the Pharr-Reynosa International Bridge.
Installation of RFID readers at the CBP primary inspection lanes started on April 11, 2011. At BOTA, there are six lanes for primary inspection of trucks. Out of six lanes, two are designated for FAST trucks. However, depending on wait time and truck volume, FAST and regular lanes are interchanged since all lanes can process FAST as well as non-FAST trucks. Coordination with GSA and CBP was conducted to determine details such as installation procedure, timing, and running conduits.
Installation in all six lanes was completed on April 13, 2011. Panel antennas were mounted over each lane and a reader for every two lanes was installed in between the two lanes. Figure 31 shows RFID equipment being installed at CBP primary inspection booths at BOTA. The control cable from each reader to the control panel was run inside the conduit. The antennas were mounted slightly to the driver’s side of the middle of the lane to increase the probability of detection for worn, damaged, or improperly applied tags.
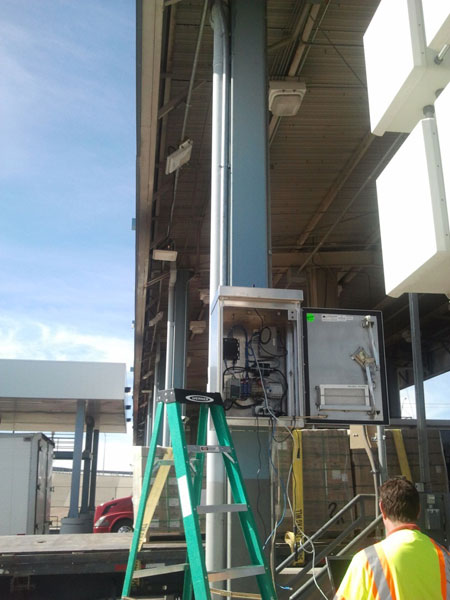
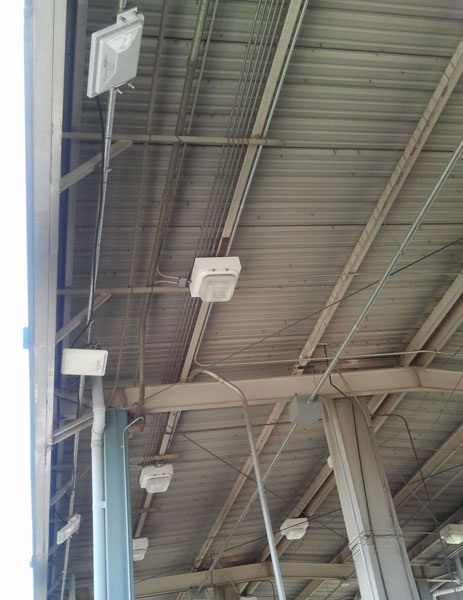
Figure 32 shows installed RFID antennas and readers on the canopy of CBP inspection booth at BOTA. The RFID equipment was installed at the exit side of the canopy rather than at the entry side to avoid interference with the existing RFID equipment used by CBP.
Following installation of RFID equipment, a tests of the installed equipment was performed. The most significant test was the lane-by-lane measurements of vehicle windshield tag acquisition. The test was conducted by connecting and collecting data from one RFID reader at a time. A single reader gathers tag IDs from two lanes. For instance, Reader R3A collects tag IDs from lanes one and two, Reader R3B collects tag IDs from lanes three and four, and Reader R3C collects tag IDs from lanes five and size. Both the incoming data and the vehicles in the two corresponding lanes were monitored while test equipment was connected to a reader. Each vehicle that passed through either of the two lanes was classified as one of the following:
- Had a tag and was read by the reader.
- Had what appeared to be a valid, readable tag but was not read.
- Did not have a tag, or had an improperly applied or physically damaged tag.
Table 4 displays the test results for each lane.
| Lane Number | Trucks with Readable Tags | Trucks With Unidentifiable Tags | Read Rate (in percent) |
|---|---|---|---|
| 1 | 24 | 1 | 96 |
| 2 | 15 | 4 | 79 |
| 3 | 19 | 3 | 86 |
| 4 | 22 | 2 | 92 |
| 5 | 23 | 1 | 96 |
| 6 | 17 | 0 | 100 |
Note: Read rate =
![]()
Each reader and associated lanes were monitored for a period of approximately 1.5 hours. The number of vehicles without tags had no influence on the test results and was included strictly for completeness. The “no tag data” do indicate that a large percentage of the vehicles had some type of tag applied.
The determination of a readable tag was done by remote visual inspection. There will almost assuredly be errors made as this is strictly a judgment call made by a team member inspecting a vehicle. Most vehicles have some type of windshield sticker, but many are not RFID tags and some are difficult to tell with a high degree of accuracy. Additionally, sometimes tags have been removed and reapplied which negatively affects their performance.
Finally, a significant number of trucks in the El Paso region have the RFID windshield tag applied in the curved portion of the truck’s windshield. This bending of the windshield tag also impacts its performance. Many of the vehicles catalogued as a “miss” were trucks with the tag in the sharp radius area of the windshield.
When looking at the read percentage results, only lane 2 fell short of the target number of 85 percent. A single mistake in visually identifying an RFID tag or defining a misapplied tag was enough to make a 3 percent point difference. Both lane 1 and lane 2 are connected to Reader R3A. If an overall, calculation is made on all the lanes using the same methodology, the resulting all lanes read percentage is 92 percent, which is well above 85 percent.
Completed Installation of RFID Stations at BOTA
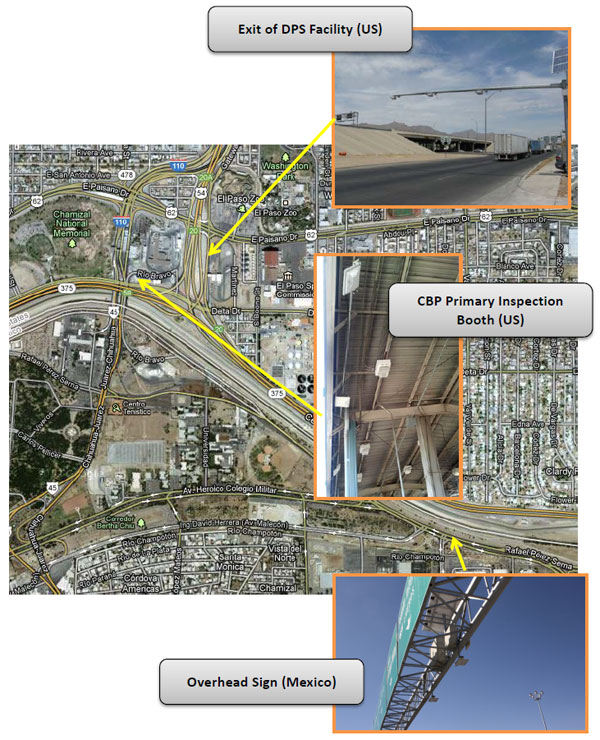
To date, the border wait time measurement system at BOTA includes three RFID reader stations – one on the Mexican side on the approach leading to Mexican Customs, one at the CBP primary inspection booth, and one at the exit of the State’s inspection facility. Figure 33 shows locations of RFID reader stations installed at BOTA.
Part II – Implementation at Pharr-Reynosa Border Crossing
Site Characterization and Identification of RFID Reader Locations
This section covers the work performed for FHWA only, which included the system development and deployment of RFID readers at CBP to allow measurement of wait times of US-bound trucks. Deployment of RFID reader stations in Mexico and at the exit of the State facility was performed as a separate initiative with TxDOT.
The system installed at Pharr-Reynosa is similar in design to BOTA. However, there is one difference: at the Pharr-Reynosa International Bridge POE there are two RFID reader stations in Mexico (R1 and R2) whereas there is only one RFID reader station in Mexico at BOTA. Through the TxDOT initiative, two RFID reader stations were installed in Mexico, one at the end of the Bridge on the US side of the border before the entrance to the CBP compound (R3), and one at the exit of the State inspection facility (R4). Because of the long length of the border crossing, a decision was made early on to add a RFID reader station at CAPUFE just north of Aduana (R2). The reader station before the entrance to CBP was uninstalled and a new set of readers were installed at CBP. Figure 34 shows the location of the RFID reader stations at the Pharr Reynosa International Bridge.

Installation of RFID Readers at CBP
In January 2011, CBP recommended approval of—and the GSA approved—the permit for RFID installation at the Pharr-Reynosa POE based on their implementation plans. RFID equipment was subsequently installed and tested at the Pharr-Reynosa CBP primary inspection booths, and measurement of wait time was confirmed at Pharr-Reynosa.
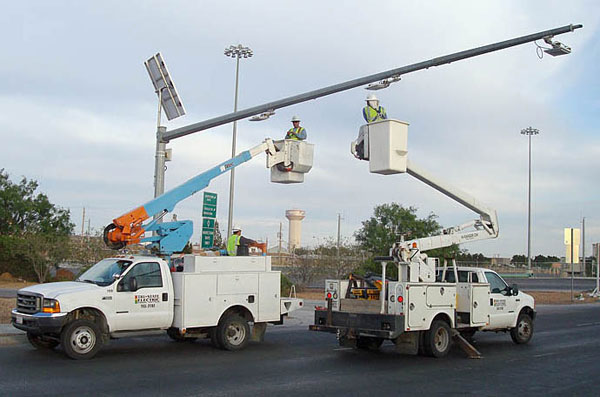
Installation of RFID reader stations at the Pharr-Reynosa POE primary inspection booths began on March 22, 2011 and completed on March 25, 2011. CBP has six inspection lanes at primary inspection facility. During installation, coordination with CBP operations staff was able to close one lane at a time to allow for the overhead installation work. Figure 35 shows installation of the RFID equipment at the primary inspection facility. The installation used a combination of a scissors lift and a bucket truck to quickly install in each lane. Adjacent lanes remained active and operation continued smoothly throughout the day.
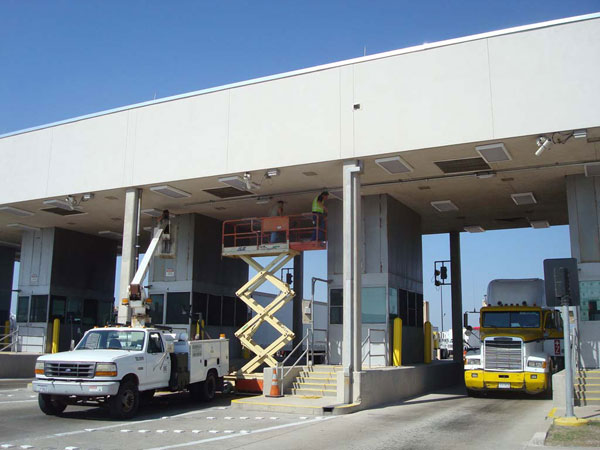
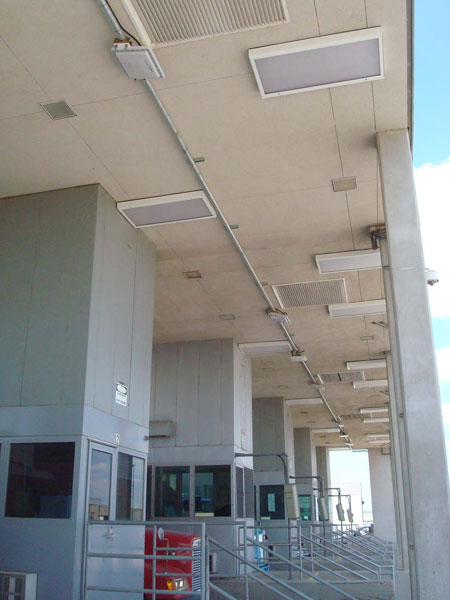
Figure 36 shows completed installation of RFID equipment at the primary inspection booths. A panel antenna was mounted over each lane and a reader was installed in between two lanes. Radio frequency coaxial cable was run from the antenna to reader. The control cable from the reader to the control panel was run inside the conduit. The antennas were mounted slightly to the driver’s side of the middle of the lane to increase the probability of detection for worn, damaged, or improperly applied tags. The antennas are slightly canted toward the driver’s windshield as per manufacturer’s recommendations.
System Test and Evaluation
The final day onsite at Pharr-Reynosa was used for system configuration, testing and any final adjustments and cleanup. On test day CBP had lane 6 closed. This meant that the third reader installed over (lanes 5 and 6) would only sense tags from lane 5. A test established the read reliability of a single lane, lane 5. During the test time interval, 36 vehicles passed under the lane five antenna. Table 5 shows the test results.
| Test Parameter | Number Observed |
|---|---|
| Total Vehicles | 36 |
| Vehicles with a visible tag | 30 |
| Vehicles with an improper tag (application) | 1 |
| Vehicles read | 28 |
| Vehicles missed (assuming the tag was readable) | 1 |
| Percentage of read tags from readable tags | 96.6% |
Similar testing was desired for the other lanes but this would have required CBP to close lanes which was not desired. There was an attempt to measure tag reads from the other lanes, but it became clear that there was no precise way of doing a test without impacting CBP operations. Vehicles pull up and wait at the booths and tags can be read anytime during the arrival or departure. Vehicles arrive and depart independently in adjacent lanes and there is no way of determining which antenna (vehicle) the tag was read from.
An alternate option was chosen. The total tag reads would be compared from each of the three readers to determine whether there was a significant trend of lower readings from a reader. Since the queues at each lane are essentially the same (assuming no lane closures), the tag read counts should be similar given a long enough time interval.
The following data are from a test interval beginning at opening time for the Pharr facility to 12:12 p.m. on the same day. The tag read volumes as shown in table 6.
| Test Parameter | Number Observed |
|---|---|
| Total tags read lanes 1 and 2 | 337 |
| Total tags read lanes 3 and 4 | 440 |
| Total tags read lanes 5 and 6 | 334 |
The volume on the outermost lanes (1 and 2, 5 and 6) are nearly identical with a greater volume in the middle lanes (3 and 4). The results are reasonable in that the middle lanes do not require trucks to veer into an alternate lane as they approach the primary booths. During times of minimal queuing, the middle lanes would be expected to handle more volume than the outer lanes. The relative closeness of the total tag reads from the outer lanes indicates a similar read rate (for a similar vehicle volume, which could not be verified cannot absolutely verify). It should be noted that most of the vehicles carry multiple readable tags, thus the tag volume in Table 6 does not reflect vehicle volume.
For the last measure, CBP officers working the booths were asked whether their FAST/Automated Commercial Environment (ACE) system was still operational and whether they were seeing any issues with its operation. Each officer reported the FAST/ACE system in their booth was operational and they were not seeing any service quality degradation. This indicates that the new travel time readers were not impacting the read reliability of the legacy system in operation at the inspection booths.
The system evaluation was performed by comparing average border wait times measured by the RFID and by GPS attached with a small sample of trucks. Results of evaluation of wait time data are described in detail in Chapter 8.
previous | next