Getting Started with Congestion Pricing: A Web-Based Workshop for Local Partners
Part 1
Slide 1
Getting Started with Congestion Pricing
A Web-Based Workshop for Local Partners
Part 1
Federal Highway Administration
Office of Operations
Slide 2
Workshop Objectives
- Develop an understanding of congestion pricing alternatives
- Communicate why congestion pricing can be beneficial
- Gain an understanding of federal programs related to pricing
- Learn which pertinent challenges come with implementing pricing programs and how to overcome them
Slide 3
Agenda
- Part 1 – Overview and Introduction to Six Challenges
- What is Congestion Pricing?
- The Case for Congestion Pricing
- Six Implementation Challenges
- 1 – Political Support and Public Acceptance
- 2 – Funding and Financing
- Part 2 – Continuation of Six Challenges
- 3 – Equity
- 4 – Technology
- 5 – Enforcement
- 6 – Long-Range Planning Integration
- Wrap-up and Summary
Slide 4
What is Congestion Pricing?
Slide 5
What is Congestion Pricing?
- Many terms used:
- “road pricing”
- “tolling”
- “value pricing”
- “congestion pricing”
- Tolling typically refers to a direct fee for using a highway facility
- Pricing has goals besides generating revenue
Slide 6
Congestion Pricing Defined…
… a way of harnessing the power of the market to reduce the waste associated with traffic congestion.
Congestion pricing is the use of increased prices during peak usage to shift rush hour highway travel to more efficient modes or to off-peak periods.
Slide 7
Four types of pricing strategies…
- Priced lanes
- Priced roadways
- Priced zones
- Priced networks
Slide 8
Priced Lanes
- HOT Lanes
- HOT-2+ or HOT-3+
- HOVs, buses, emergency vehicles free or reduced rate
- Lower occupant vehicles charged toll
- Express lanes - various possibilities:
- All vehicles charged
- HOVs receive discount
- Truck-only toll lanes
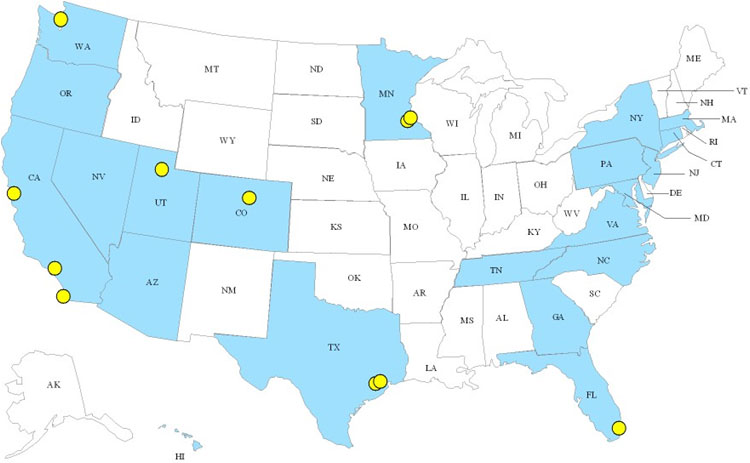
Slide 9
Priced Lane Projects
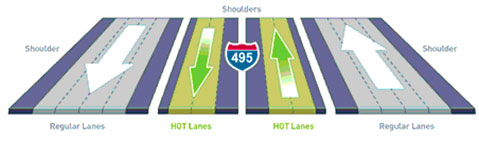
Slide 10
Priced Lane Concept
- Improve efficiency by balancing supply and demand
- Supply: Improve efficiency by maintaining optimal flow
- Demand: Dynamically adjust the price in relation to the current conditions
Slide 11
Supply: What is the Capacity for a Priced or Managed Lane?
- The inherent nature of managed lanes is to provide a level of flow that is reliable and consistently free flowing
- Thus, these lanes are managed to a level of free flow capacity, not the same as the HCM maximum capacity
- Free flow capacity of a single lane managed lane is typically in the 1500 – 1700 VPH range.
Slide 12
Managing the Demand Side with Pricing
- HOT Lanes are designed to serve their primary customer first – the baseline of transit and carpool vehicles
- Then dynamic or variable pricing is used to “meter” the number of toll payers, consistent with the capacity that is available
Slide 13
Priced Roadways
- Flat toll rates changed to variable
- tolls higher during peak travel periods
- tolls lower during off-peak travel periods
- Toll-free facilities changed to variably priced
- tolls charged on congested highway segments
- tolls vary by time of day
Slide 14
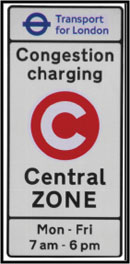
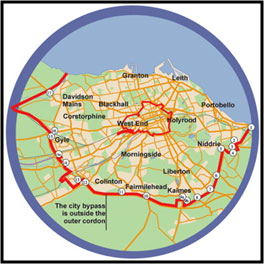
Priced Zones
- Fee charged to enter a congested zone
- Usually a city center, but could be a defined geographic area
- Fees may vary by time of day
Slide 15
Priced Networks
- Priced limited access network
- Distance-based pricing (VMT fees)
- Mileage-based user fees or time-distance-place pricing (TDP)
Slide 16
The Case for Congestion Pricing
Slide 17
Federal Setting
- SAFETEA-LU provided more authority to toll and price motor vehicles:
- To finance construction/reconstruction
- To promote efficient use of highways
- To reduce traffic congestion
- To improve air quality
- Six programs are now available
Slide 18
Six Federal Programs
Slide 19
Multiple Beneficiaries of Pricing
- Drivers and Businesses
- Transit & Carpoolers
- Proponents for Innovative Financing
Slide 20
Benefits to Drivers and Businesses
- SOV Drivers
- Congestion-free SOV travel option
- Improve reliability
- Reduced fuel use
- Businesses
- Increase predictability of trip times for deliveries
- Reduce costs, such as fuel use
- Benefits to Society
- Reduce fuel use and emissions
Slide 21
Benefits to Transit Riders and Carpoolers
- Transit Riders
- Preserves or improves vehicle speeds and trip reliability
- Funds for transit improvements
- Carpoolers
- Preserve or provide incentives for ridesharing through time savings and trip reliability
Slide 22
Benefits for Agency Revenues
Concepts generating higher revenues:
- Traditional tolling with variable toll rate
- Cordon pricing
Concepts generating less revenues:
- HOT lanes
- Express toll lanes
Cross-subsidizing multimodal investments
- Pool funding sources
- Helps with public acceptance and equity concerns
Slide 23
Use of Revenues
- Operate toll collection and traffic management systems
- Expansion of roadway facilities
- Support public transit
- Toll discounts to low income individuals
- Reduction of other taxes
Slide 24
Six Implementation Challenges
Slide 25
Overcoming Challenges of…
- Political support and public acceptance
- Funding and financing
- Equity
- Technology
- Enforcement
- Long-range planning integration
Slide 26
Political Support and Public Acceptance
Arguments against congestion pricing:
- It is double taxation
- It is not fair – “Lexus Lane” concern
- It costs too much; raise taxes instead, they are cheaper to collect than tolls
- It won’t work
- It represents social engineering by elites
- The government can’t be trusted to use the revenue properly
- The value of time savings won’t be worth the price
- Alternative modes will become crowded
- Alternative modes will be underutilized
Slide 27
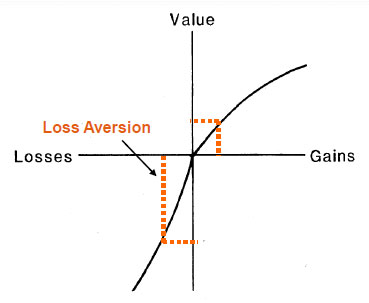
Loss Aversion
- In behavioral economics and decision theory, loss aversion refers to people's tendency to strongly prefer avoiding losses to acquiring gains.
- Behavioral studies suggest that losses are twice as powerful, psychologically, as gains.
Source: Amos Tversky & Daniel Kahneman. “The Framing of Decisions and the Psychology of Choice” Science, New Series, Vol. 211, No. 4481. (Jan. 30, 1981), pp. 453-458.
Slide 28
Funding and Financing
Challenges:
- Current and future funding situation is dire
- Not enough funding to address all the needs
- Motor fuel taxes unable to fully fund the system
- Fuel taxes unsustainable in the long run
- There is a need to manage congestion and stretch the dollars
- Pricing represents a fundamental shift in funding approach
- Innovative funding and financing methods require legislative authority
Slide 29
Equity
Types of equity concerns:
- Income-based – “This will be a regressive tax on those who can least afford it.”
- Modal – “Congestion relief will encourage choice transit riders to abandon transit and go back to their cars.”
- Geographic – “Why do I have to pay for my road, when my tax dollars went to pay for the other guy’s road?
- Fairness (paying twice) – “Why impose tolls on existing free roads already paid for with taxes?”
Slide 30
Technology
Challenges:
- Start-up costs
- Interoperability with neighboring systems
- Balance of operating costs versus customer service level
- Obsolescence – evolution of technology
Slide 31
Enforcement
Challenges:
- Related to technology challenges
- Start-up costs, both technology and adjudication process
- Interoperability/reciprocity with adjoining states
- Balance in cost to pursue violators, revenue lost, and public perception of system integrity
- Obsolescence – evolving technology
- Carpool discounts
- Enforcement becomes more challenging and more resource-intensive
- HOV legacy systems play a significant role in policy discussions
Slide 32
Long-Range Planning Integration
- How can pricing be implemented in a coherent, system approach?
- How can a region promote consistency in the application of pricing and in the allocation of revenues?
- How can design elements and technology applications across projects be consistent and coordinated?
- How can analytical tools be adapted to support public policy decisions?
Slide 33
Six Implementation Challenges
Part 1
- Political support and public acceptance
- Funding and financing
Part 2
- Equity
- Technology
- Enforcement
- Long-range planning integration
Slide 34
Political Support and Public Acceptance
Slide 35
Political Support and Public Acceptance
Start with a comprehensive public education program
- Most people will be unfamiliar with concept
- Gather perception data through market research methods
- Need clear message and communication
- Provide examples of successful projects
- How they operate
- Helps with public support
- Cultivate project champions
https://www.fhwa.dot.gov/ipd/revenue/road_pricing/resources/webinars/
Slide 36
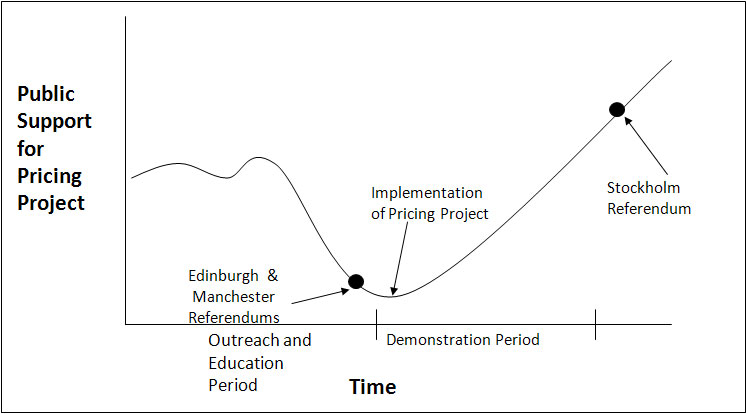
Public Support for Congestion Pricing
Source: CURACAO State of the Art Interim Report, April 26, 2008. p. 94,
http://www.curacaoproject.eu/state-of-the-art-report.php
Slide 37
Public Response to HOT Lanes
- Negative Reactions
- Lexus lanes
- Double taxation
- Won’t impact traffic congestion
- “Band-Aid” solution
- Positive Reactions
- Choice
- Encourages ride-sharing and/or transit use
- Provides funding
Slide 38
Citizens Jury – Minneapolis (1995)
- The University of Minnesota Humphrey Institute conducted a week-long Citizens Jury with 24-randomly selected citizens from the Twin Cities area.
- Although the Citizens Jury voted 17-7 against congestion pricing as a way to manage congestion and fund transportation, the exit survey was quite enlightening.
- While 16 opposed congestion pricing, 18 of the 24 were open to considering congestion pricing as an effective solution in the future. Their primary concerns were
- Congestion not bad enough yet,
- Congestion pricing not fair – Lexus Lane concern,
- Congestion pricing costs too much – raise gas tax instead; and
- Congestion pricing won’t work.
Slide 39
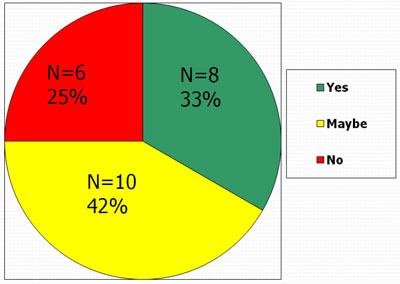
Should Minnesota consider congestion pricing in the future?
Citizens Jury Results
- 25% were solidly against congestion pricing
- 33% were in favor of congestion pricing
- 42% were opposed to congestion pricing but open to consideration if their concerns were addressed
Source: Twin Cities Congestion Pricing Citizens Jury, May 1995
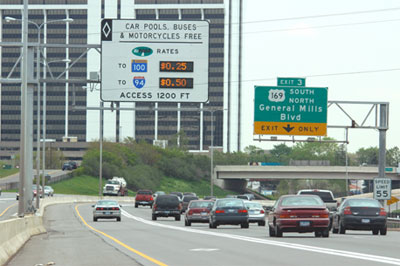
Slide 40
Case Study: MnPASS I-394
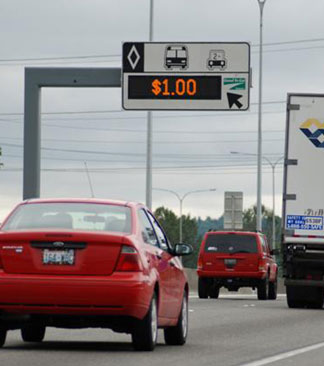
Minneapolis, MN - HOV to HOT Conversion Project
Pricing Parameters
- Prices set dynamically based on HOT Lane congestion level
- Toll free for HOV 2+/transit/motorcycles
- Toll rate for SOVs - $0.25 to $8.00
- Peak hour tolls average toll between $1.00 and $4.00
- Must have MnPASS transponder if solo driver ($1.50/month leasing fee)
Slide 41
MnPASS I-394
Minneapolis, MN - HOV to HOT Conversion Project
Project Features
- Implemented as a public-private partnership
- First tolling of lanes without a physical separation
- Lanes with multiple access and egress points
- Dynamic pricing applications on two zones
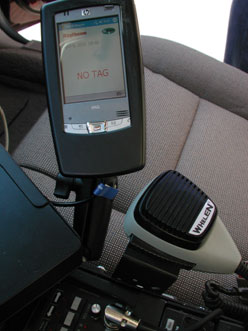
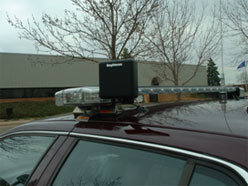
- Technology applications to assist enforcement
www.mnpass.org
Slide 42
HOT Lanes – Public Reaction
Public acceptance has been high on early projects
I-394 MnPass
- 95% satisfaction with all electronic tolling
- 85% satisfaction with traffic speed in lane
- 76% satisfaction with dynamic pricing
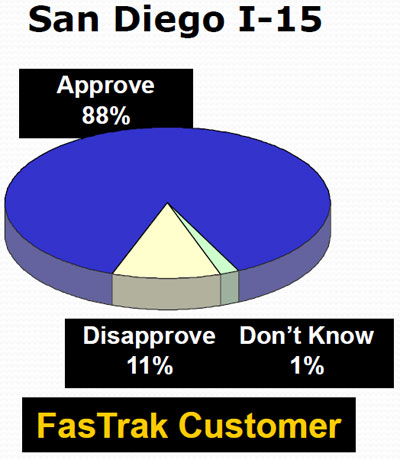
Source: www.mnpass.org
Source: fastrak.sandag.org
Slide 43
Themes in Public Opinion Results
- The public wants to see the value
- The public wants to react to tangible and specific examples
- The public cares about the use of the revenues
- The public learns from experience
- The public uses knowledge and information available
- The public believes in equity but wants fairness
- The public wants simplicity
- The public favors tolls over taxes
Slide 44
Funding and Financing
Slide 45
Funding and Financing
- Available funding only covers a fraction of needed transportation projects
- Congestion pricing may offer innovative financing techniques
- Key to successful project is matching desires and needs of community with specific project goals
Slide 46
Terminology
Funding
- Money available to implement a project in development
- Needed by all projects
- grants
- taxes
- special assessments
- toll revenues
Financing
- Method used to secure funding
- Project can be developed to match financing type
- Innovative methods
- offer more flexibility
- can spur infusion of non-traditional funding
- can accelerate projects
Slide 47
How Much Revenue?
- Tolling and pricing concepts vary in revenue generation
- Concepts generating higher revenues
- Traditional tolling with variable rate
- Traditional tolling with flat rate
- Cordon pricing
- Concepts generating less revenues
- Cross-subsidizing multimodal investments
- Helps with public acceptance and equity issue
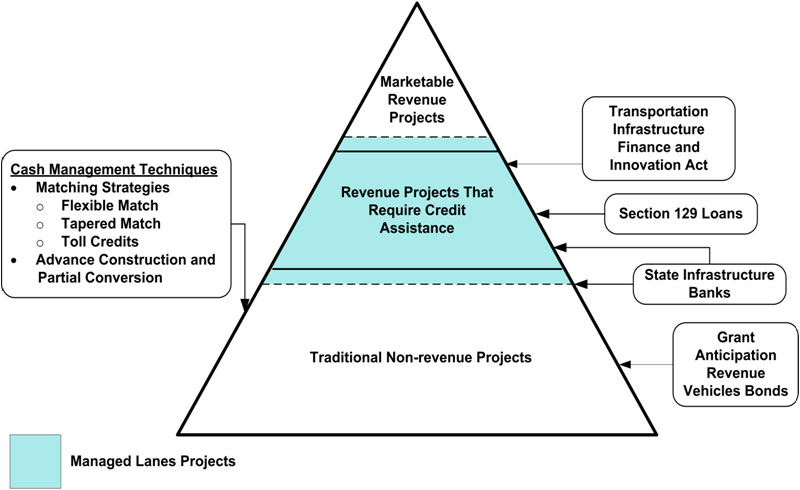
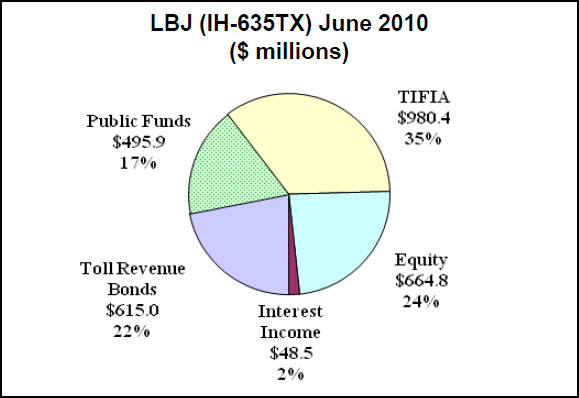
Slide 48
From TxDOT Managed Lanes Handbook, 2005
Slide 49
Gap Funding Options
- Toll Revenue Bonds
- TIFIA Loan
- GARVEE Bonds
- State Infrastructure Bank
- Private Activity Bonds (PABs)
- Build America Bonds
- Special Tax Districts
- Alternative Dedicated Revenue Streams
- Public-Private Partnership
- Private partner providing equity upfront
- Risk transfer
- Tradeoffs (pros and cons)
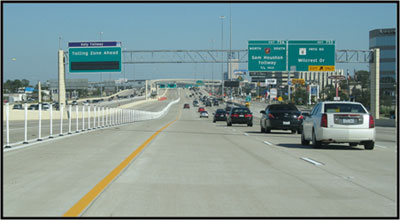
Slide 50
Case Study: I-10 Katy
Houston, TX – Managed Lane
Project Features
- Opened April 2009; replaced single reversible HOV lane
- 2 lanes each direction
- Flexible plastic pole separation
- Multiple access with direct connects at transit centers
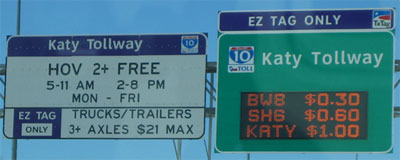
Slide 51
I-10 Katy
Houston, TX – Managed Lane
Pricing Parameters
- Express Toll Lane base operation – all vehicles pay
- Variably-priced based on time of day, multiple zones
- Toll free for HOV 2+/transit/motorcycles during peak periods
Slide 52
I-10 Katy
Houston, TX – Managed Lane
Project Funding
- Public-public partnership:
- TxDOT
- Harris County Toll Road Authority (HCTRA)
(in coordination with FHWA and METRO, the regional transit authority)
Slide 53
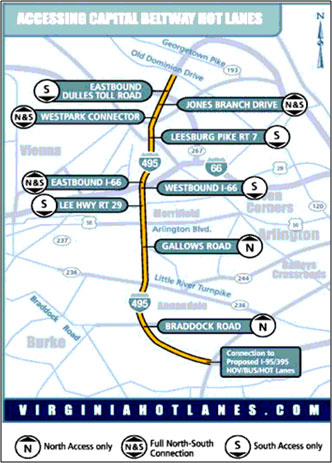
Case Study: Capital Beltway HOT Lanes
I-495, Virginia
Project Description
- 14 miles
- 2 new lanes each direction
- Flexible plastic pole separation
- Direct access at major interchanges with no at-grade access
Slide 54
Capital Beltway HOT Lanes
I-495, Virginia
Pricing Parameters
- Dynamically priced - based on demand
- Toll free for HOV 3+/transit/motorcycles
- Toll rate – undecided
- Must have E-ZPass transponder
Slide 55
Capital Beltway HOT Lanes
I-495, Virginia
Project Funding
- Public-private partnership (PPP or P3)
- Virginia Department of Transportation (VDOT)
- Fluor-Transurban
- Funding
- Commonwealth of Virginia ~ $409 million
- Private equity ~ $349 million
- Private activity bonds - $589 million
- FHWA TIFIA loan - $589 million
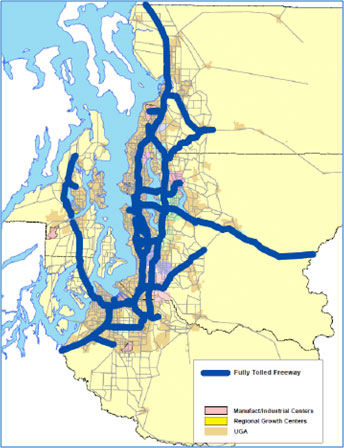
Slide 56
Case Study: SR 520 Bridge
Seattle, WA – Bridge Replacement
Project Description
- Project under development
- Pre-construction tolling applied to existing bridge lanes
- Generate funding to support bridge replacement
- Variable tolling by time of day
- Multiple methods for paying tolls
- Transponders options
- Pre-pay and late-pay video tolling
Slide 57
SR 520 Bridge
Seattle, WA – Bridge Replacement
Project Features
- New buses and park and ride facilities
- Active traffic management systems
- Expansion of existing TDM programs
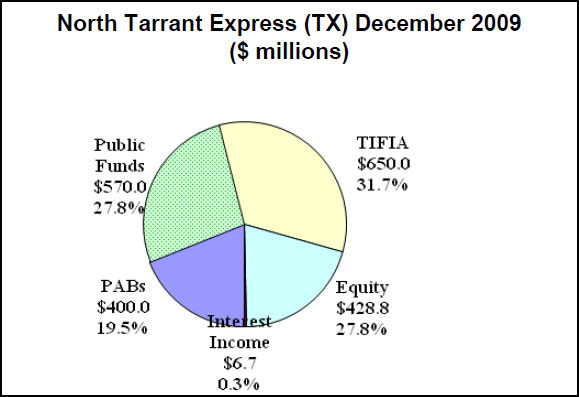
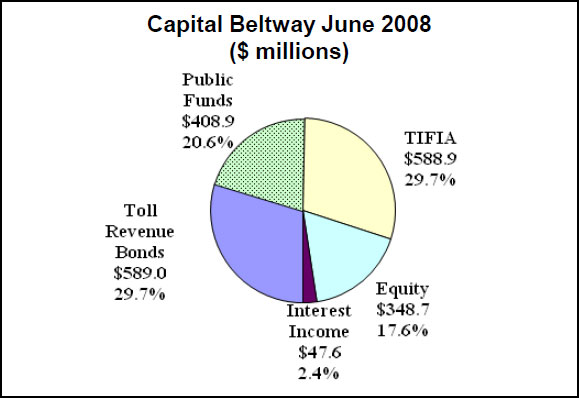
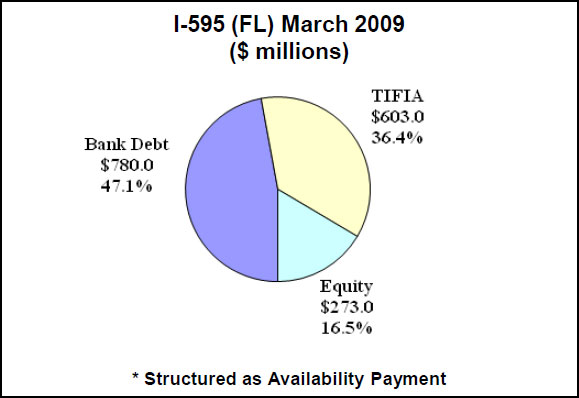
Slide 58
Four Managed Lane Projects Have Reached Financial Close since 2008
Source: I-405/SR 167 Corridor Tolling Study: Expert Review Panel Final Report, December 2010 http://www.wsdot.wa.gov/Tolling/EastsideCorridor/Report.htm
Slide 59
Financing Summary
- Traditional non-revenue financing is typical for most projects
- Few are marketable revenue projects
- Sell sufficient debt to fully finance a project
- High-volume corridors
- User fees support maintenance and operations and debt service
- Managed lanes projects fall in the middle
- Require leveraging monies from all available sources
- Project costs and congestion level play critical roles
- Agency cooperation critical
- Trend toward funding “mosaics” using non-traditional gap funding options
Slide 60
Recap of Today’s Workshop
- Congestion pricing comes in various forms, with lane pricing the most common application in the U.S.
- Congestion pricing can provide benefits to a variety of users and stakeholders
- Federal programs are available to support pricing projects
- There are a number of unique implementation challenges associated with lane pricing; today we covered
- Public and political acceptance
- Funding and financing
Slide 61
Next Web-Based Workshop
- (date and other pertinent information)
- Part 1 – Overview and Introduction to Six Challenges
- What is Congestion Pricing?
- The Case for Congestion Pricing
- Six Implementation Challenges
- 1 – Political Support and Public Acceptance
- 2 – Funding and Financing
- Part 2 – Continuation of Six Challenges
- 3 – Equity
- 4 – Technology
- 5 – Enforcement
- 6 – Long-Range Planning Integration
- Wrap-up and Summary
Slide 62
Questions and Discussion