An Agency Guide on Overcoming Unique Challenges to Localized Congestion Reduction Projects
1.0 Introduction
1.1 Purpose of the Guidance Document
This guidance document provides guidelines that can be used by state departments of transportation (DOTs) and local transportation agencies. The guidance document was developed based on best practices used by state and local agencies during the planning, design and implementation of localized congestion (a.k.a. bottleneck) relief programs and projects.
1.2 How to Use this Document
Target Audience
Target Audience:
- Transportation
- Consultants
- Planners
- Designers
- Operations and maintenance
This document is designed for state, regional, and local transportation agencies and private consultants that are focused on mitigating operational causes of bottlenecks. These bottleneck locations include a wide variety of causes from poorly functioning merges/diverges to poor ramp spacing throughout an entire freeway corridor. This document targets planners as well as traffic, safety, and design engineers, because bottlenecks need to be addressed in all phases of the project development process. Operations and maintenance staff will also find this document useful because it highlights innovative thinking and action by agencies on implementing projects to relieve localized congestion caused by bottlenecks. The document includes a series of case studies and some high-level guidance on developing and implementing successful projects.
Document Structure and Content
This guidance document includes the following sections:
- Section 1.0 – Introduction. This section contains background information on traffic bottlenecks and describes how the FHWA is addressing bottlenecks through their LBR Program.
- Section 2.0 – Common Barriers and Challenges to Localized Congestion Projects. This section provides information on common barriers and challenges associated with implementing localized congestion relief projects. The barriers and challenges are divided into four primary categories, including: institutional, design, funding and safety.
- Section 3.0 – Case Studies of Successful Programs and Projects. This section summarizes case study examples of successful bottleneck programs and projects across the United States, focusing on ten that provide valuable lessons on overcoming common barriers and challenges.
- Section 4.0 – High-Level Guidance on Implementing Successful Projects. This section includes some high-level guidance on developing and implementing successful bottleneck and localized congestion relief projects.
1.3 Background
Bottlenecks: A Definition
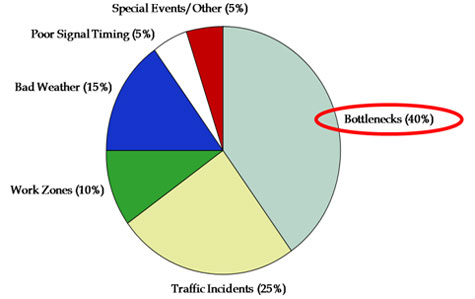
The FHWA estimates that 40 percent of all congestion nationwide can be attributed to recurring congestion (see Figure 1); some of it “mega” where entire regions or large facilities (e.g., interchanges or corridors) are overwhelmed by seemingly unceasing traffic demand and some of it “subordinate” – locations on the highway system where periodic volume surges temporarily overwhelm the physical capacity of the roadway. Of this 40 percent, there has never been research to determine how much is attributable to subordinate locations. During off-peak hours, the subordinate locations operate sufficiently and safely for the conditions. These recurring “localized” bottlenecks are those encountered in our everyday commutes, and are characterized as being relatively predictable in cause, location, time of day, and approximate duration. Nonrecurring congestion, on the other hand, is caused by random events such as crashes, inclement weather, and even “planned” events such as work zones and special events.
Traffic Bottlenecks:
Localized sections of highway where traffic experiences reduced speeds and delays due to recurring operational conditions or nonrecurring traffic-influencing events.
Localized Bottlenecks
Localized Bottlenecks:
- Usually exist in one direction (e.g., underserved movement)
- Predictable:
- Cause
- Location
- Time of day
- Duration
- Point-specific or short corridor
- Solutions to fix are:
- Small geometric changes
- Relatively low-cost
- Delivery is reasonably quick (1 construction season or less)
This guidance document focuses on “localized” recurring bottlenecks (i.e., point-specific or short corridors of congestion). Mega-bottlenecks or those occurring due to systemic congestion are not meant to be covered by this guidance. It is understood that transportation agencies have different thresholds (financial and otherwise) of what it means to be a localized versus mega—bottleneck project.
For a bottleneck to be “localized,” the factors causing the bottleneck ideally should not exert influence upon, or be influenced by, any other part of the transportation system. As a practical measure, the LBR program recommends considering the closest upstream and downstream decision points as either impacting “to” or impacting “from” the subject location, respectively. Anything much beyond that reach might be considered more than “localized.” One exception might be collector-distributor lanes that would almost certainly run through two or more on- or off-ramps. Such a “system” can be considered as a larger, localized condition. Otherwise, recurring, localized bottlenecks generally occur at the areas described in Table 1.
Table 1. Common Locations for Localized Bottlenecks.
| Location |
Symbol |
Description |
| Lane drops |
 |
Bottlenecks can occur at lane drops, particularly mid-segment where one or more traffic lanes ends or at a low-volume exit ramp. They might occur at jurisdictional boundaries, just outside the metropolitan area, or at the project limits of the last mega project. Ideally, lane drops should be located at exit ramps where there is a sufficient volume of exiting traffic. |
| Weaving areas |
 |
Bottlenecks can occur at weaving areas, where traffic must merge across one or more lanes to access entry or exit ramps or enter the freeway main lanes. Bottleneck conditions are exacerbated by complex or insufficient weaving design and distance. |
| Freeway on-ramps |
 |
Bottlenecks can occur at freeway on-ramps, where traffic from local streets or frontage roads merges onto a freeway. Bottleneck conditions are worsened on freeway on-ramps without auxiliary lanes, short acceleration ramps, where there are multiple on-ramps in close proximity and when peak volumes are high or large platoons of vehicles enter at the same time. |
| Freeway exit ramps |
 |
Freeway exit ramps, which are diverging areas where traffic leaves a freeway, can cause localized congestion. Bottlenecks are exacerbated on freeway exit ramps that have a short ramp length, traffic signal deficiencies at the ramp terminal intersection, or other conditions (e.g., insufficient storage length) that may cause ramp queues to back up onto freeway main lanes. Bottlenecks could also occur when a freeway exit ramp shares an auxiliary lane with an upstream on-ramp, particularly when there are large volumes of entering and exiting traffic. |
| Freeway-to-freeway interchanges |
 |
Freeway-to-freeway interchanges, which are special cases on on-ramps where flow from one freeway is directed to another. These are typically the most severe form of physical bottlenecks because of the high traffic volumes involved. |
| Changes in highway alignment |
 |
Changes in highway alignment, which occur at sharp curves and hills and cause drivers to slow down either because of safety concerns or because their vehicles cannot maintain speed on upgrades. Another example of this type of bottleneck is in work zones where lanes may be shifted or narrowed during construction. |
| Tunnels/underpasses |
 |
Bottlenecks can occur at low clearance structures, such as tunnels and underpasses. Drivers slow to use extra caution, or to use overload bypass routes. Even sufficiently tall clearances could cause bottlenecks if an optical illusion causes a structure to appear lower than it really is, causing drivers to slow down. |
| Narrow lanes/ lack of shoulders |
 |
Bottlenecks can be caused by either narrow lanes or narrow or a lack of roadway shoulders. This is particularly true in locations with high volumes of oversize vehicles and large trucks. |
| Traffic control devices |
 |
Bottlenecks can be caused by traffic control devices that are necessary to manage overall system operations. Traffic signals, freeway ramp meters, and tollbooths can all contribute to disruptions in traffic flow. |
Table 2 describes five of the most common causes or reasons why localized bottlenecks exist.
Table 2. Common Causes for Localized Bottlenecks.
| Causal Factor |
Symbol |
Description |
| Traffic patterns change |
 |
Bottlenecks exist in freeway and arterial street systems because traffic patterns change, due to new development, changes in roadway characteristics (especially new roadways), employment, or other factors. |
| Traffic forecasting is inexact |
 |
Bottlenecks can exist because of the difficultly with forecasting growth in traffic volumes. Traffic forecasting is inexact, particularly when trying to look at peak hour and peak period travel characteristics. |
| Disconnect between disciplines |
 |
Bottlenecks can result from a disconnect between disciplines within the project development process, where communication among planners, design and operations personnel does not adequately address localized congestion concerns. |
| Lack of knowledge |
 |
Sometimes agencies simply do not know where bottlenecks are located on their system. This lack of knowledge of localized congestion is often the result of a lack of available data to support good congestion mapping. |
| Misinterpretation: localized vs. systemic |
 |
Sometimes agencies misinterpret that the situation is not localized but systemic – characterizing the entire interchange or corridor as over capacity. |
A detailed discussion on bottleneck characteristics is provided in FHWA Publication FHWA-HOP-09-037, Recurring Traffic Bottlenecks: A Primer – Focus on Low-Cost Operational Improvements, available on FHWA’s web site at http://www.ops.fhwa.dot.gov/publications/fhwahop09037/fhwahop09037.pdf.
Bottlenecks: A History
Timeline of National Bottleneck Activities
Over the past decade, transportation professionals have come to realize that highway bottlenecks demand special attention. Several national studies have highlighted bottlenecks as a major congestion problem in urban areas. These studies have raised the level of awareness about bottlenecks as a problem, warranting that they be treated as a significant part of the congestion problem.
One of the LBR tenets is “a bottleneck is congestion, but congestion is not always just a bottleneck.” This means that a bottleneck (or chokepoint) is merely a subset of the larger congestion pie. However, that “subset” is now realized to be a uniquely impacting (and increasingly growing) genre of congestion; namely, that it is subordinate locations along a highway that need to be fixed, and not necessarily the knee-jerk expectation to rebuild the entire facility. Granted, in some cases, an aging or clearly capacity-deficient facility may need to be replaced. But in this age of budget constraints and economizing, one or two corrections to inefficient subordinate locations on a facility may be all that is needed to improve the condition. Figure 2 takes a satirical approach to the argument that we can build our way out of congestion by continued major expansion of freeway facilities.
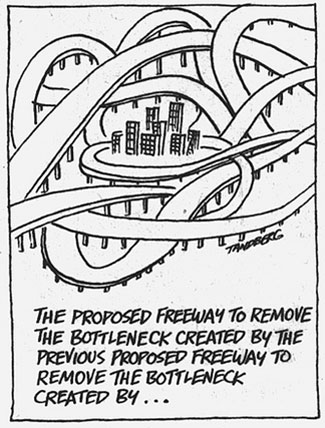 Figure 2. Graphic. The Endless Pursuit of Congestion Relief.
1.4 Localized Bottleneck Reduction Program
FHWA’s Localized Bottleneck Reduction Program promotes operational and low-cost bottleneck mitigation strategies to improve mobility. Managed by the Office of Operations, the program serves to bring attention to the root causes, impacts, and potential solutions to recurring traffic chokepoints; ones that are wholly the result of operational influences. This is “good and bad” news in the sense that design influences can always be corrected, but some corrections may be cost-prohibitive in terms of direct construction costs or indirect right-of-way impacts. Regardless, many locations have the potential to be corrected for relatively low-cost and with relatively low physical impact. In any case, the goal of the program is to raise awareness of bottlenecks at the state level and promote low-cost, quick-to-implement geometric and operational improvements. The LBR Program has several activities either completed or underway, including:
- This guidance document, which provides guiding principles and concepts common to knowing and overcoming the barriers and challenges to implementing low-cost operational improvement programs and projects.
- A companion guidance document, An Agency Guide on How to Establish Localized Congestion Mitigation Programs, developed to provide guidance to state and local personnel who wish to develop a formal program for mitigating congestion using localized and low-cost treatments. It presents templates for developing a localized congestion mitigation program, including documenting alternative templates in use by state DOTs and Metropolitan Planning Organizations (MPO).
- Traffic Analysis Toolbox Volume X: Localized Bottleneck Congestion Analysis – Focusing on What Analysis Tools are Available, Necessary, and Productive for Localized Congestion Remediation. This document provides guidance on tools required to analyze the specific genre of localized congestion problems.
- Recurring Traffic Bottlenecks: A Primer – Focus on Low-Cost Operational Improvements. This Primer is the “face” of the program. It provides an overview of the wide range of operational and low-cost strategies available to reduce congestion at bottlenecks.
- Localized Bottleneck Reduction Regional Workshops. Regional workshops for state and local agencies to learn and share information on localized bottleneck reduction strategies and how they can be incorporated into state and local planning processes.
- Many of the items listed above can be found at the FHWA bottleneck web site (http://ops.fhwa.dot.gov/bn/index.htm), which can be found at the FHWA Office of Operations web site.
Additional guidance documents are forthcoming that are aimed at agencies and personnel who have first responsibility to address bottleneck congestion locations.
September 2011
FHWA-HOP-11-034