Efficient Use of Highway Capacity Summary
Report to Congress
Chapter 4: Case Studies
Case Study: The Netherlands—Temporary Shoulder Use and Speed Harmonization
Overview
Facility
- Various throughout The Netherlands.
Operator
- NTCC and regional control centers.
Years of Operation
- 1981–current
Operating Strategy Overview
- Advanced queue warning systems that utilize flashing lights and variable speed limit signs alert drivers of recurrent congestion, lane closures, and incidents.
- Requires extensive technological investment and monitoring activities.
- Deployment is automated based on field data and is initiated automatically based on an assessment algorithm, requiring no intervention by an operator.
- Only operates during time periods of congestion or when incidents occur along instrumented roadways.
Number of Lanes
- Applied to an entire corridor, encompassing all lanes.
Length
- 1,000 km (620 mi) of roadway.
Project Description
The Area
The Netherlands is home to over 16.2 million residents and 6.9 million cars, with 155 million vehicle miles traveled each day across its network. It covers an area of roughly 16,000 mi2. Traffic operations are controlled by a series of five regional traffic control centers, which are in turn coordinated by NTCC. (1)
Temporary Shoulder Use
The Netherlands implemented temporary right shoulder use—also known as hard shoulder running or the rush hour lane—in 2003 as part of a larger program to improve use of the existing infrastructure. As Figure 24 shows, a gantry with lane control signals indicates when the shoulder is available for use. Where a shoulder lane passes through a junction and at the end of a hard shoulder running section, guidance information will change according to lane use. (14)
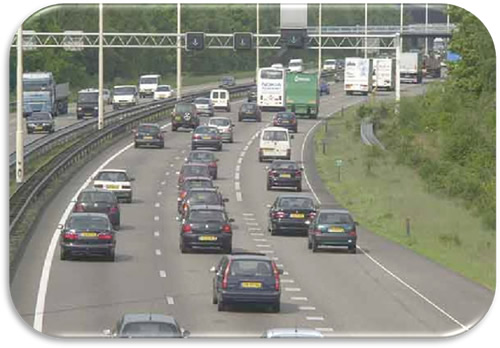
Figure 24. Photo. Temporary Right Shoulder Use—The Netherlands. (36)
In addition to allowing temporary use of the right shoulder, the Dutch also deploy the use of traveling on a dynamic lane on the median side of the roadway. As Figure 25 shows, the left lane—also known as the plus lane—or a narrowed extra lane provided by reconstructing the existing roadway while keeping the hard shoulder is opened for travel use when traffic volumes reach levels that indicate congestion is growing.
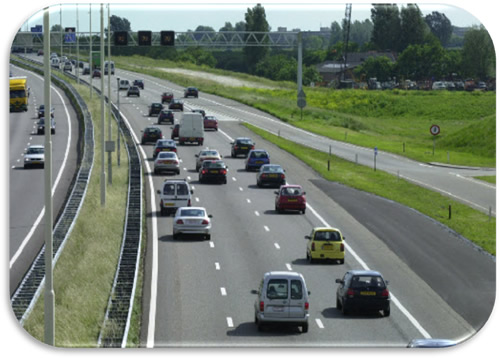
Figure 25. Photo. Plus Lane in The Netherlands. (36)
Temporary shoulder use in The Netherlands is only deployed in conjunction with speed harmonization. This strategy works to reduce speeds in congested conditions in order to improve traffic flows and reduce the likelihood of traffic incidents. Such systems require significant technological development, as traffic speeds must be continually monitored and information must be continually transmitted throughout the entire corridor. The Netherlands' speed harmonization system works through the motor control and signaling system (MCSS), an advance queue warning system that utilizes flashing lights and variable speed signs to alert drivers of congestion and lane closures. (1)
The entire system monitors traffic speeds in the corridors it is implemented in. Should the system detect large drops in overall speed within a certain area, it notifies other travelers of the impending slow down and lowers the speed limit in incremental stages as displayed on variable speed signs for traffic approaching the congested area, as shown in Figure 26. This alleviates the "shock" that can be caused by a sudden reduction in speed, improves traffic flow, and reduces the number of traffic incidents as a result of congested conditions. Speed harmonization is often employed during severe weather conditions and in environmentally sensitive areas to reduce pollutants.
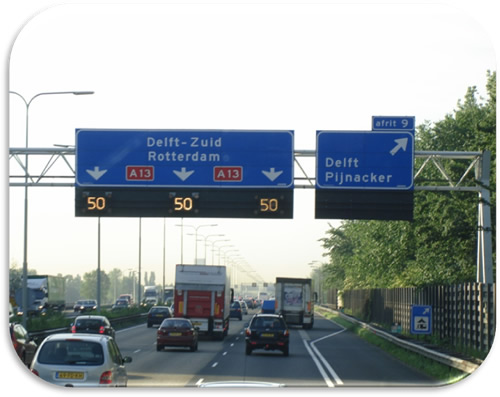
Figure 26. Photo. Speed Harmonization—The Netherlands.
The standard speed limit is 120 km/h (75 mph) on the motorways, but posted speeds can drop to 90 km/h (55 mph), 70 km/h (44 mph), or as low as 50 km/h (31 mph) if a shock wave or speed-drop is detected. These conditions are normally due to high volumes or incidents occurring on the facility. As of 2007, the MCSS system has been implemented on over 1,000 km (620 mi) of roadway in The Netherlands, and 61 km (38 mi) more are planned. The MCSS was first deployed in 1981.
Project Conceptualization
Speed harmonization is only one element of the overall transportation system for The Netherlands. The Ministry of Transport, Public Works and Water Management (Rijkswaterstaat) manages over 2,000 mi of The Netherlands' mainline roadways and operates the country's numerous regional traffic control centers in addition to the NTCC. (36) The primary focus for Rijkswaterstaat is on maintaining high levels of customer service and ensuring trip reliability, which has led the agency to establish the following benchmarks:
- Ninety-five percent of trips are completed on time.
- Trips in urban areas do not take more than twice as long in congested conditions as they do in normal conditions.
- Trips on all other roads do not take more than 1.5 times as long in congested conditions as they do in normal conditions. (37)
Speed harmonization works toward both goals of customer service and trip reliability, as it keeps travelers informed of current conditions and manages roadway conditions so as to maximize throughput and reduce travel time variability. Temporary shoulder use complements speed harmonization to better utilize roadways and improve trip reliability.
Facility Management
In the Dutch national approach to congestion management, information is a primary resource in the overall traffic management architecture, including speed harmonization. Information is the backbone behind all traffic and demand management strategies in the control scheme. The NTCC coordinates the activities of and gathers traffic-related data from the five regional traffic control centers that center on major cities and operate 24 hours a day, 7 days a week. The regional traffic control centers are responsible for the daily operation of the congestion warning and speed harmonization systems. (38) The NTCC, which also operates 24-7, is the focal point for national traffic operations. It establishes national guidelines and procedures on traffic management, coordinates emergencies, communicates with other European national centers, and collects management information from around the country. The NTCC fosters cooperation between the national and regional governments to direct road users for optimal roadway performance. (1)
Technologies Deployed
The Netherlands has used speed harmonization for many years. Some deployments have been implemented to promote safer driving during adverse weather conditions (such as fog), while others have been used to create more uniform speeds. Most recently, The Netherlands' MCSS has been used to reduce speed in a densely populated and environmentally sensitive area to reduce polluting elements. The posted speed limit of 80 km/h (50 mph) is further effectuated by an automated speed enforcement system, which measures average speed over a section of the highway, normally 2 to 3 km long. Temporary shoulder use is a more recent implementation of ATM, having been first implemented in 2003. Additional technologies and facilities are always implemented along with temporary shoulder use to help mitigate any adverse safety consequences the operational strategy may create, including the following:
- Overhead lane signs and full matrix signs.
- Emergency refuge areas with automatic vehicle detection.
- Variable route signs at junctions.
- Advanced incident detection.
- CCTV surveillance.
- Intensified incident management.
- Public lighting. (1)
Performance of System
Highway System Performance
It is estimated that facilities under the MCSS system have seen throughput increase between 4 and 5 percent. Primary accidents decreased by 15 to 25 percent, and secondary incidents decreased by 40 to 50 percent between 1983 and 1996. It is estimated that speed harmonization has reduced collisions by about 16 percent and increased throughput by 3 to 5 percent, and has reduced the cost of work zone traffic control. Regarding temporary shoulder use, assessment of this strategy reveals that its implementation has increased overall capacity 7 to 22 percent (depending on usage levels) by decreasing travel times from 1 to 3 minutes and increasing traffic volumes up to 7 percent during congested periods. (39)
Safety and Incidents
The Dutch have seen a reduction in incidents on facilities with temporary shoulder use, as shown in Figure 27. Additional safety benefits may include fewer queues and shockwaves, lower travel speeds with harmonization, better monitoring, and swifter incident response. Temporary shoulder use is allowed only when speed harmonization is in effect.
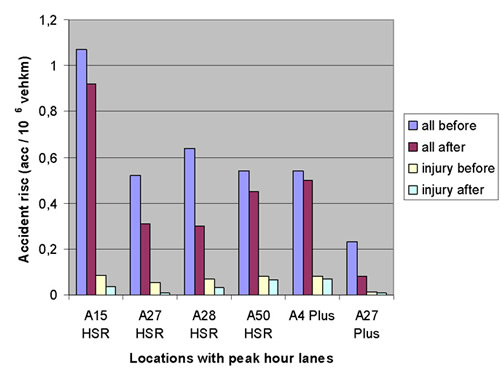
Figure 27. Graph. Incident Reductions with Temporary Shoulder Use—The Netherlands. (14)
Case Study: Germany—Temporary Hard Shoulder Use and Speed Harmonization
Overview
Facility
- Various.
Operator
- Federal Ministry of Transport and regional traffic management centers.
Years of Operation
- 1996–current
Operating Strategy Overview
- Variable speed limit signs alert drivers to reduce speeds as a result of recurrent congestion, lane closures, and incidents to address bottlenecks on the freeway network caused by these conditions.
- Temporary shoulder use designated by sign gantries with variable message signs and shoulder-mounted diagrammatic signs to indicate availability for use; operational when traffic volumes are high and the hard shoulder is strong and wide enough for use.
- Temporary hard shoulder use only deployed with speed harmonization (line control) when the maximum allowable speed limit is 100 km/h (62 mph) and if dynamic message signs are used for lane control.
- Deployment of variable speed limits is automated based on field data and is initiated automatically based on an assessment algorithm, requiring no intervention by an operator.
- Operates both between junctions and through junctions.
Number of Lanes
- Applied to an entire corridor, encompassing all lanes.
Length
- Over 200 km of roadway currently in congested corridors across the country.
Project Description
The Area
Germany is home to an estimated 82 million inhabitants and covers an area of about 138,000 mi2. Its federal motorway network is about 7,500 mi spread across 10 states. Most of these major highways are four- to six-lane facilities that carry average daily traffic volumes of about 49,000 vehicles. Overall demand on the German transportation network is expected to increase by 16 percent for passenger transport and 58 percent for freight transport by 2015. Officials hope to accommodate this growth with the construction of over 1,000 mi of new roadways, widening 1,300 mi of existing roadway and constructing 717 bypasses. (16)
Temporary Shoulder Use
Temporary shoulder use in Germany, also known as hard shoulder use, is only deployed in conjunction with speed harmonization to address capacity bottlenecks on the freeway network. In Germany, it provides additional capacity during times of congestion and reduced travel speeds. The use of the right shoulder during peak travel periods has been used in Germany since the 1990s, with the first deployment on the A4 near Cologne in December 1996. (12) Today, nearly 125 mi of temporary hard shoulders are in operation around the country. This temporary shoulder use is one of several traffic control systems developed by the Federal Ministry of Transport and is used in various locations in the country. (29) When travel speeds are reduced, signs indicate that travel on the shoulder is permitted, as Figure 28 shows. This installation is located on the Autobahndirektion Südbayern (South Bavaria) and has had the official signs added digitally for illustrative purposes. Figure 29 shows the complete series of signs indicating operations related to temporary shoulder use, including one with a supplemental speed limit indication (used when overhead gantries are not present). These signs and the overhead lane messages are blank when travel on the shoulder is not permitted. Temporary shoulder use is permitted only when speed harmonization is active and speed limits are reduced.
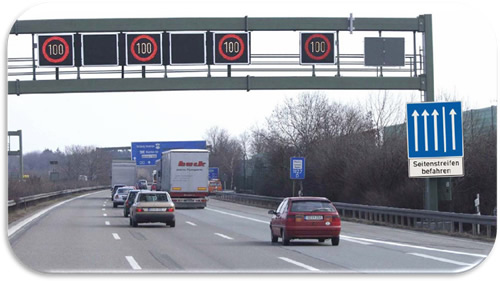
Figure 28. Photo. Right Shoulder Use with Speed Harmonization—Germany. (13)
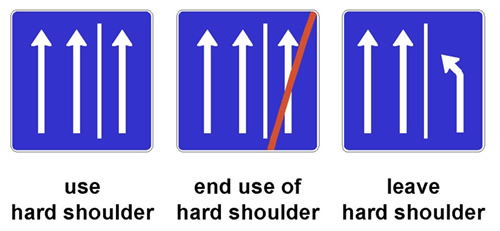
Figure 29. Illustration. Temporary Hard Shoulder Use Signs—Germany. (13)
Temporary shoulder use in Germany can either end or continue through interchanges depending on the bottleneck locations and overall characteristics of the corridor. Figure 30 and Figure 31 illustrate the signing and marking used when temporary hard shoulder use continues through an interchange. Figure 32 and Figure 33 illustrate those signs and markings used when temporary hard shoulder use terminates at an interchange.
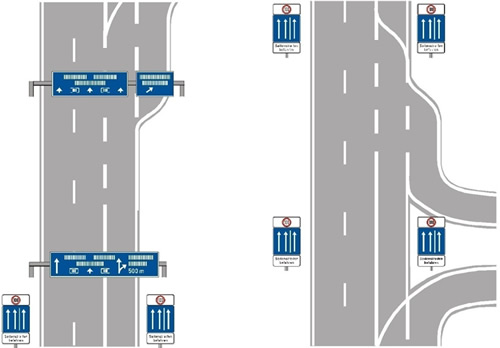
Figure 30. Illustration. Signs and Markings for Temporary Hard Shoulder Use Continuation through Interchange—Germany. (13)
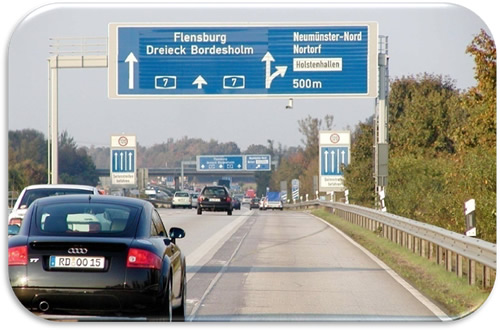
Figure 31. Photo. Continuation of Temporary Hard Shoulder Use through an Interchange—Germany. (13)
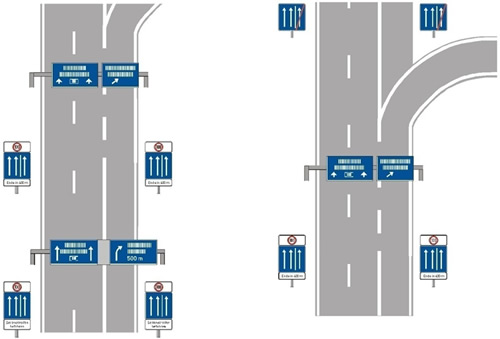
Figure 32. Illustration. Signs and Markings for Temporary Hard Shoulder Use Termination at Interchange—Germany. (13)
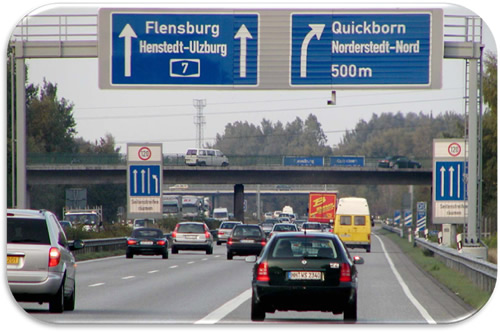
Figure 33. Photo. Termination of Temporary Hard Shoulder Use at Interchange—Germany. (13)
Project Conceptualization
In response to the growing demand on its roadways, the Federal Ministry of Transport, Building, and Urban Affairs established a Federal Transport Infrastructure Plan to upgrade the road network by 2015 through major construction projects. This plan includes constructing 1,074 mi of new motorways, widening 1,340 mi of existing motorways, and constructing 717 bypasses across the country. (16) In addition, the ministry has a comprehensive 5-year Programme for Traffic Control on Federal Motorways, which is oriented toward overall management of the federal motorway network. This program's objectives are to (1) increase by 745 mi the length of motorways equipped with traffic control systems, (2) increase by 1,500 mi the length of motorways with dynamic diversion possibilities, and (3) increase by 15 the number of traffic control centers across the country. Both federal initiatives illustrate a national movement to upgrade and actively manage the motorway network for efficient operations and to enhance the mobility of the country's citizens. Temporary hard shoulder use and speed harmonization are critical components of this management program.
The German federal government also has a policy on telematics and transport, with a primary emphasis on public-private cooperation. The intent is to define specific responsibilities that are best handled by the public sector, those that are best handled by the private sector, and those that can best be accomplished by public-private partnerships. This policy recognizes the strengths of the private sector in some arenas and acknowledges that some activities can be undertaken only by governmental agencies and should remain under public control. The federal government owns the federal motorways and highways and finances their construction, maintenance, and telematic infrastructure deployment, while the individual states are responsible for maintenance, operations, traffic safety, traffic regulations, and financing of the planning and operational activities for the network.
Facility Management
At the regional level, German states establish freeway operation programs for their motorway networks with two primary objectives. The first objective is to maintain or increase safety by harmonizing traffic flow, providing hazard warnings to motorists, and providing dynamic in-vehicle information on traffic conditions to users. The second objective is to maintain and improve mobility, which is achieved through the optimal use of the existing network capacity and the use of various operational strategies to temporarily increase road capacity. (40)
Regional traffic management centers, like the Traffic Center Hessen, have established a proactive traffic management approach. This approach is a comprehensive framework that encompasses benchmarking of network performance; deploys and maintains various traffic management strategies to meet the aforementioned objectives; incorporates data management, traffic analysis, and forecasting to evaluate and assess the impacts of those strategies; and facilitates the implementation of innovations to enhance mobility. Temporary use of hard shoulders and line control are two tools in this proactive congestion management toolbox.
Technologies Deployed
Components typically installed with the required regulatory signs include:
- Overhead gantries.
- Dynamic speed limit displays.
- Dynamic message signs.
- Roadway sensors.
- CCTV cameras.
Performance of System
Highway System Performance
Overall, Germany has seen considerable benefits from the deployment of temporary hard shoulder running and speed harmonization. These benefits include a travel time reduction of up to 20 percent, a temporary increase of up to 25 percent in freeway capacity, and a high motorist acceptance of variable traffic signs given reasonable speed limits are displayed for speed harmonization. Temporary shoulder use affords congested motorways with higher throughput, as shown in Figure 34. The addition of the third lane in the form of temporary shoulder use, while slightly decreasing speed and initially reducing volumes on the motorway, actually delays the onset of congestion and breakdown and increases the overall throughput on the facility. Similar operational improvements are realized as a result of speed harmonization, with breakdown flow under breakdown conditions being reduced, as shown in Figure 35.
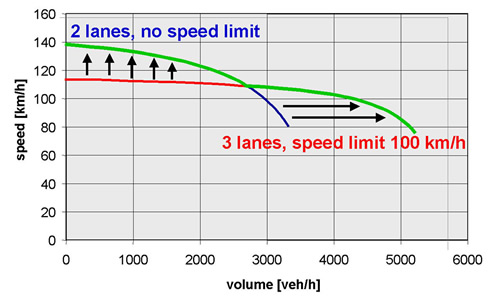
Figure 34. Graph. Speed–Volume Relationship of Temporary Shoulder Use—Germany. (13)
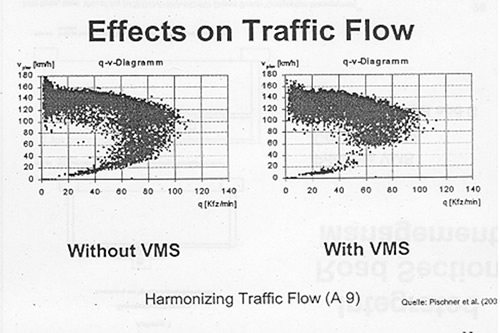
Figure 35. Graph. Flow Impacts of Speed Harmonization—Germany. (41)
Safety and Incidents
The safety benefits realized through the use of speed harmonization are significant. Facilities with speed harmonization have seen a reduction of up to 29 percent in accidents with personal damage, a reduction of up to 27 percent in accidents with heavy material damage, and a reduction of up to 3 percent in accidents with light material damage, as shown in Figure 36.
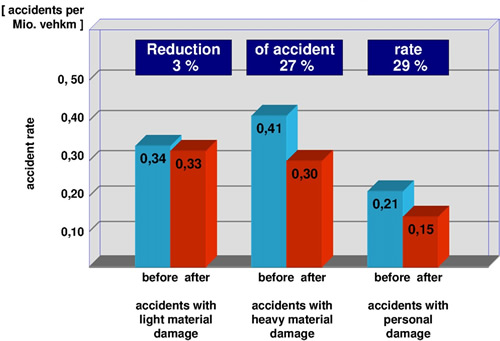
Figure 36. Graph. Safety Benefits of Speed Harmonization—Germany. (40)
Case Study: Great Britain—Temporary Shoulder Use System
Overview
Facility
- M42 Motorway (J3A to J7).
Operator
- Highways Agency.
Years of Operation
- 2006–current
Operating Strategy Overview
- Variable speed limit signs alert drivers to reduce speeds as a result of recurrent congestion, lane closures, and incidents.
- Temporary shoulder use designated by sign gantries with dynamic message signs to indicate availability for use.
- Temporary shoulder use deployed only when speed limits are reduced (initially to 50 mph).
- Deployment of variable speed limits is automated based on field data and is initiated automatically based on an assessment algorithm, requiring no intervention by an operator.
- Only operates (1) during time periods of congestion or when incidents occur along instrumented roadways, and (2) between junctions, requiring users to exit at each junction and reenter the roadway beyond.
- Emergency refuge areas provided for use when vehicles break down.
Number of Lanes
- Applied to an entire corridor, encompassing all lanes.
Length
- 11 mi of roadway currently with plans to expand to other congested corridors.
Project Description
The Area
As with other countries across Europe, the United Kingdom (UK) now faces a number of new challenges regarding transportation and mobility. Trends in traffic growth predict that volumes will increase by 29 percent by the year 2010, and with increased volumes comes increased congestion on the transportation network. Estimates are that non-recurrent congestion in the form of incidents (25 percent) and construction (10 percent) account for 35 percent of congestion. (42)
Active Traffic Management (ATM)
Introduced in 2001 by the Minister of Transport, the M42 ATM pilot is an operational strategy intended to provide reliable journeys, reduced recurring and non-recurring congestion, and enhanced information to drivers. (43) It is a direct response to the road users' demands for better service within the realistic limitations of widening and expanding the roadway network. Building on advancements in technology and experience from across the globe, this pilot project works to make the best use of the existing capacity on the segment of M42 between junctions 3A and 7. The ATM pilot also provides additional capacity during periods of congestion or incidents. The pilot project combines the strategies of speed harmonization and temporary shoulder use. To ensure safe operations of the temporary shoulder use, emergency refuge areas are spaced at 1,640-ft intervals along the shoulder (as shown in Figure 37), and emergency call boxes are provided at each refuge area (as shown in Figure 38).
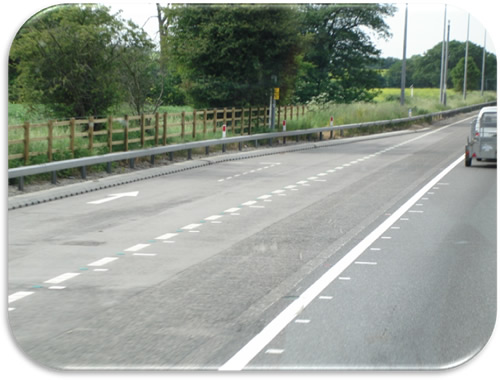
Figure 37. Photo. Emergency Refuge Area on Facility with Active Traffic Management—England.
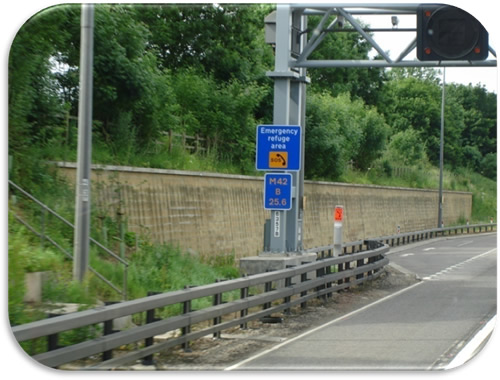
Figure 38. Photo. Emergency Call Box on Facility with Active Traffic Management—England.
The roadway provides traditional information to travelers as seen on other motorways across the region. Under such conditions, all normal rules apply. However, information provided to travelers changes during periods of recurring congestion or incidents depending on whether or not the hard shoulder is open for travel. In both cases, gantries with lane control signals and dynamic message signs indicate reduced speed limits and the availability of the hard shoulder for travel use rather than for emergency refuge only. Overall benefits include increased capacity; enhanced journey reliability; reduced driver stress, number and severity of crashes, traffic noise, emissions, and fuel consumption; and improved driver behavior. (44)
Project Conceptualization
In 2004, the Department for Transport established a long-term strategy for a modern, efficient, and sustainable transport system that is supported by a high level of investment. Acknowledging that transportation is vital to the economy and quality of life, the strategy focuses on providing a 2030 transportation network that can meet the challenges of a growing economy and an increasing demand for travel while achieving environmental objectives. Three themes support this strategy: (1) a sustained investment in the transportation network over the long term; (2) continued improvements in transportation management to maximize the benefits of public spending; and (3) planning for the future and considering new and innovative approaches to improving transportation. Underlining these themes is the objective to balance the need to travel with the need to improve quality of life. The ATM is a key component of the agency's approach to meeting its long-term strategy for its transportation network. (45)
A primary goal for improving transportation across the UK is related to safety—which is an acknowledged contributor to roadway congestion. The national goal, which has been in place since 2000, is to maintain the network in a safe and serviceable condition. A continuous review of measures to improve roadway and work zone personnel safety through engineering and design improvements are key activities related to this goal. Specific numbers that the Highways Agency is working to meet include a 33 percent reduction in the number of deaths or severe injuries in motor-vehicle related accidents, a 10 percent reduction in the number of minor injuries – both of which will contribute to a 50 percent reduction in child casualties. (46)
Facility Management
The national focal point for congestion management in the UK is the NTCC. At this information hub, NTCC staff monitor a network of over 1,730 CCTV cameras and 4,450 traffic sensors 24 hours a day, 365 days a year. Staff members review the network and deliver vital information to the news media and other operational partners including the police and the Highways Agency traffic officer service. They also display real-time messages on the 350 DMS placed at strategic points on the motorway network.
The NTCC coordinates and is interconnected with seven regional control centers across the country. These centers monitor and maintain the roadway network within their jurisdiction and are the first line of control regarding congestion management. If minor incidents occur, the regional centers initiate appropriate responses related to incident and congestion management and report information to the NTCC regarding the incident. For major incidents, actions are coordinated with the NTCC as needed to optimize the remaining capacity and to minimize the duration and impact of the incident on the entire motorway network and the adjacent local road system. The West Midlands Traffic Control Center in Birmingham is responsible for operating the ATM system on the M42 as part of its overall duties.
Technologies Deployed
The ATM project on the M42 has numerous technological components that ensure its successful operation. In addition to the traffic sensors, CCTV cameras, and DMS deployed on the roadway network as part of the regional traffic control center, the completed system includes the installation of the following:
- Lightweight gantries.
- Lane control signals.
- Dynamic speed limit signals.
- Dynamic message signs.
- Digital enforcement technology.
- Closed-circuit television cameras.
- Enhanced lighting.
- Roadway sensors.
- Emergency roadside telephones.
- Emergency refuge areas. (43)
Performance of System
Highway System Performance
Overall, traffic conditions on the M42 have become smoother and more consistent since the implementation of ATM. Weekday travel times have reduced in variability by 27 percent, and capacity has increased by an average of 7 to 9 percent when hard shoulder running is in effect. Travel times have improved by 24 percent in the northbound direction and 9 percent in the southbound direction during peak periods as a result of the speed harmonization deployment. (47) Moreover, the travel time variability has been reduced by 22 percent to 32 percent since deployment, allowing drivers to more accurately predict their journey times. These trends are shown for both winter and summer seasons despite the increase in demand experienced during the summer season. Additionally, the ATM on the M42 improved the distribution of traffic across the travel lanes and has not had an adverse effect on traffic in the surrounding areas.
Safety and Incidents
Overall, traffic operations on the M42 have improved, with traffic congestion and the speed differential between lanes being reduced. Furthermore, there is a higher occurrence of free-flow conditions with headways greater than 5 seconds. During the first year of operation, a limited crash analysis indicated that accidents along the corridor in the ATM section decreased from 5.08 per month to 1.83 per month. (48)
Other Impacts
Initial vehicle emission and air quality measurements indicate that vehicle emissions for carbon-monoxide, particulate matter, carbon-dioxide, and oxides of nitrogen have dropped between 4 and 10 percent and fuel consumption has dropped by 4 percent since deployment. Noise reduction along the corridor has also been measured between 1.8 dB(A) and 2.4 dB(A). (48)
Case Study: Virginia—I-66 Temporary Shoulder and HOV Lanes
Overview
Facility
- I-66 (U.S. 50 to I-495).
Operator
- Virginia Department of Transportation.
Years of Operation
- 1992–current
Operating Strategy Overview
- Use of rightmost shoulders by general purpose traffic only during peak periods Monday–Friday (eastbound, 5:30 a.m.–11:00 a.m.; westbound, 2:00 p.m.–8:00 p.m.).
- Installation was as a result of the adaptation of leftmost general purpose lane to HOV-2 lane concurrent with opening of shoulder lane (eastbound, 5:30 a.m.–9:00 a.m.; westbound, 3:00 p.m.–7:00 p.m.).
- Advance signage and traffic control signaling provide travelers information of operations, including large signs alerting drivers to nine emergency refuge areas.
- Opening of the shoulder lane during traffic incidents/construction.
Number of Lanes
- One HOV-2 lane, captured from interior-most general purpose lane, operational concurrent with opening of exterior shoulder for use by general purpose traffic.
Length
- 6.5 mi of dual HOV/Shoulder Lane operations.
Project Description
The Area
As the primary highway connecting Washington, D.C. (population 600,000), and Northern Virginia (population 2,400,000), I-66 suffers heavy traffic throughout the Fairfax County section. Although the corridor features concurrent metro-rail service (Washington Metro Orange Line, operating between Vienna and western Arlington County), the freeway's three lanes in each direction are often overtaxed.
Temporary Shoulder Use
Built in 1964, the segment of I-66 between U.S. 50 and I-495, where the case study HOV/shoulder lane combination is operational, includes three main lanes in each direction. Starting in 1992, the shoulder was opened to peak-period, peak-direction general purpose traffic, allowing the leftmost lane to operate as an HOV lane (illustrated in Figure 39). This lane provides continuity to HOV lanes that continue on I-66 west of U.S. 50 for an additional 15 mi to VA-234 (49). The cross-section west of U.S. 50 includes a static HOV lane (interior) and three general purpose lanes (exterior), as shown in Figure 40.
In the combined HOV/shoulder lane segment (hereafter referred to as HOV/SL), three travel lanes and one shoulder are present for the entire segment with a posted speed limit of 55 mph. When shoulder lanes are active, four emergency refuge areas (eastbound) and five refuge areas (westbound) provide accommodation for breakdowns and enforcement activities. Additionally, collector/distributor roads (barrier separated from main lanes) provide access to and from the corridor's three ingress/egress ramps (eastbound) and four ingress/egress ramps (westbound). The shoulder lanes and C/D roads can be seen in Figure 41. As shown in the cross-section in Figure 42 and Figure 43, the general purpose lanes are 12-ft wide, the interior shoulders are 8- to 12-ft wide, and the exterior shoulders are 11-ft wide.
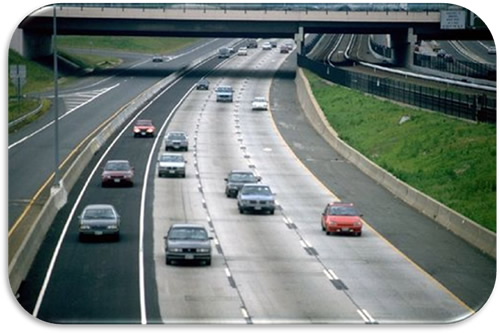
Figure 39. Photo. I-66 Peak Period Shoulder Use—Virginia (50).
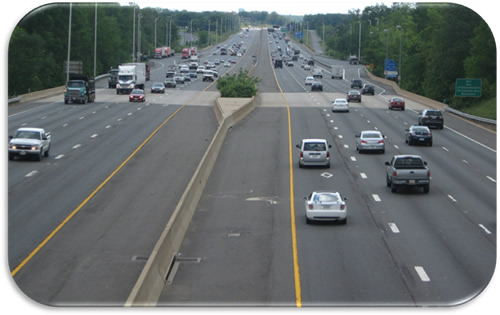
Figure 40. Photo. I-66 HOV Lanes, West of HOV/SL Portion—Virginia (50).
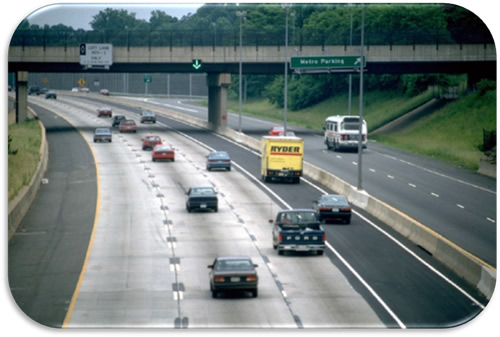
Figure 41. Photo. I-66 HOV/SL Portion—Virginia (50).
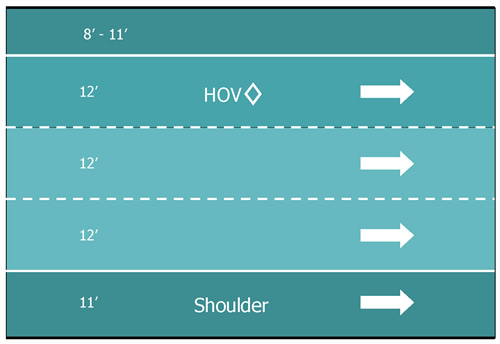
Figure 42. Illustration. I-66 HOV/SL Lane Plan View—Virginia (50).
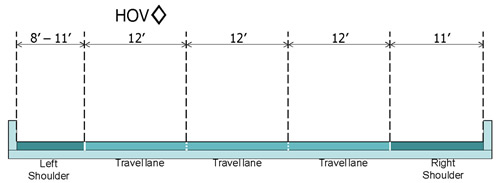
Figure 43. Illustration. I-66 HOV/SL Typical Cross-Section—Virginia (50).
Project Conceptualization
I-66 has a storied history. Originally conceived in 1956 and designed in the 1960s, I-66 was one of the initial highway construction projects to be successfully sued on the grounds of lacking an environmental impact statement (despite the approval and design occurring prior to the enactment of the National Environmental Policy Act). The HOV/SL was constructed prior to this lawsuit, but in 1972, the U.S. Court of Appeals required the U.S. Department of Transportation to halt construction and conduct an environmental impact statement specifically for the portion east of I-495. The end result was a four-lane freeway (two in each direction) between Washington, D.C., and I-495, with HOV-2+ required for the peak period/peak-direction portion of the freeway between I-495 and Rosslyn (although single occupant vehicle (SOV) travel to/from Dulles airport is permitted) (51). This cross-section allows the HOV/SL portion to have an interesting design-two separate ramps to I-495 from I-66 directly accessible from both the HOV lane and the shoulder lane, as shown in Figure 44. Lane balancing is not an issue, given the constrained design within the beltway.
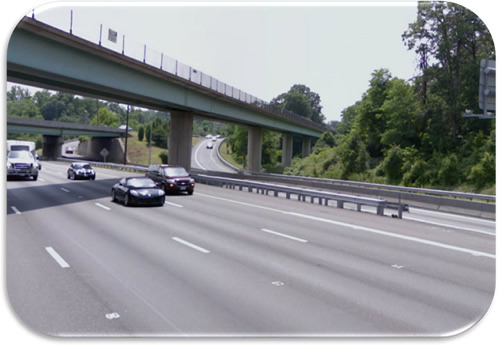
Figure 44. Photo. I-495, Viewing Dual Entrance Ramps from I-66-Virginia.
Facility Management
Whereas the shoulder lanes are open to general purpose traffic, the HOV lane is open to all vehicles meeting either two-person restrictions or permitted hybrid vehicles. An overhead sign enables a downward pointing green arrow when the SL is active, and a red X appears when the shoulder has been recovered, as seen in Figure 16. To respond to the need for incidents and breakdowns, emergency refuge areas have been constructed since the implementation of the facility. (52) Furthermore, the operational hours of the shoulder lanes have changed since 1995 to respond to changing traffic conditions. Peak period conditions often extended beyond the original 10:00 a.m. eastbound threshold, and prior to the 3:00 p.m. westbound initialization. As a result, VDOT extended the operational times to 11:00 a.m. and 2:00 p.m., respectively. (53), (54)
Performance of System
Highway System Performance
In 2007, typical traffic volumes during the eastbound HOV/SL hours ranged from 19,500 to 27,000 vehicles, with 21,000 to 25,000 vehicles westbound. These volumes compare with 190,000 average annual daily traffic (AADT) for the corridor in this segment. Truck volumes are low (approximately 2-3 percent), as are bus volumes (1 percent) within the HOV/SL portion of I-66. Within the HOV/SL segment, morning volume-to-capacity (V/C) ratios fell between 0.90 and 1.00 (eastbound), indicating at capacity, heavy volume usage. In the westbound direction, LOS F conditions typically resulted, with V/C ratios between 0.83 and 1.01 (suggesting the backward-bending portion of the V/C curve, whereby saturated conditions depress both volumes and speeds). (33)
Safety and Incidents
Based on a safety analysis using negative binomial regression models and crash data from 2002 to 2004, researchers concluded that there was no evidence that the HOV/SL managed-lane strategy had a statistically significant effect on crash frequency during peak hours. As the authors of the study commented, "A typical factor, high AADT volume, and a natural causal factor, light conditions, especially combined with motorists' aggressive lane change behaviors in merging and diverging areas, are presumably major factors influencing crashes in the study area," and not the effect of the SL operations directly. (33)
Case Study: Minnesota—Priced Dynamic Shoulder Lanes
Overview
Facility
- I-35W, north of 42nd Street to Downtown Minneapolis.
Operator
- Minnesota Department of Transportation.
Years of Operation
- 2009–current
Operating Strategy Overview
- Use of leftmost shoulder provides MnPASS Express Lane service during certain times when traffic along the general purpose lanes is congested.
- Transit vehicles, carpools, and MnPASS customers (SOV) are able to use the converted shoulder lane when operational.
- Transit vehicles and high-occupancy vehicles operate at no charge in the PDSLs. MnPASS customers (SOV) pay the displayed fee for shoulder access to the PDSL.
- Prices for MnPASS customers are set to ensure free-flow travel.
- Installation was a conversion of a right shoulder bus-only-shoulder operation to a left PDSL and was included as part of a larger Urban Partnership Agreement project for Mn/DOT.
Number of Lanes
- One left shoulder lane.
Length
- Approximately 2.5 mi of PDSL.
Project Description
The Area
IH-35W is a major north-south corridor that connects the southern suburbs and downtown Minneapolis, Minnesota. Congestion is extensive along the corridor and increases with proximity to downtown. Until the deployment of PDSLs and high-occupancy toll lanes on the facility, the right shoulder was used for BOS operations to provide reliable transit trips into the city.
Priced Dynamic Shoulder Lanes
The Mn/DOT incorporated priced dynamic shoulder lanes along I-35W to improve traffic flow along the corridor using transit and tolling. The PDSLs connect with approximately 10 mi of additional new MnPASS lanes along the corridor. This project, along with the addition of two new transit stations, is part of a partnership between the local, State, and Federal Government funded through the U.S. Department of Transportation's Urban Partnership Agreement. The MnPASS lanes provide a new option on I-35W during peak periods.
The PDSLs are deployed along with variable speed limits across the general purpose lanes on I-35W. As shown in Figure 45, sign gantries are located approximately every ½ mi along the section of freeway. These gantries incorporate traditional guide signs along with dynamic speed limit panels over the general purpose lanes. Over the PDSL, regulatory signs provide information on the hours of operation and the MnPASS restrictions and toll rates for access. The width of the PDSL varies from 17 ft to 19 ft between the left median barrier and the edgeline striping for the leftmost general purpose lane.
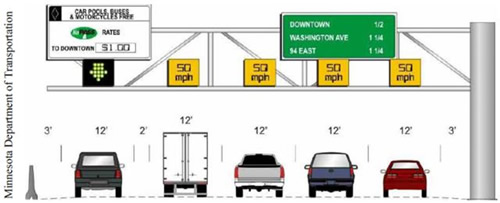
Figure 45. Illustration. PDSL on I-35W—Minneapolis, Minnesota. (27)
Project Conceptualization
The PDSLs are part of a larger congestion relief program along I-35W. In addition to the PDSLs, additional MnPASS lanes were installed along with two new park-and-ride lots in the corridor. New electronic signs were installed every ½ mi between 42nd Street and downtown Minneapolis to provide real-time information to help motorists make informed decisions about their commute and the availability of the PDSLs. Lane control signals located over the PDSLs indicate whether or not the lane is open to users, and DMS panels on the regulatory signs display the MnPASS toll for SOV access to the lanes. As part of this project, emergency refuge areas were also installed off the right shoulder to facilitate breakdowns and incident management. The entire facility, including the general purposes lanes, was resurfaced as part of this project. The PDSL portion of the project cost 13 million dollars, including the resurfacing. Unlike BOS elsewhere in the region, speeds on the PDSL can remain at free-flow freeway speeds to optimize travel time savings.
Facility Management
When operational, the left shoulder is available to all transit vehicles, carpools, and MnPASS customers. Transit and carpools are able to use the PDSL for free, while MnPASS vehicles with only one occupant are required to pay a fee to access the PDSL. All tolls are collected electronically, and there are no tollbooths on the facility. Incident response along the facility is primarily handled by Minnesota State Police and FIRST.
Technologies Deployed
In addition to the traditional ITS components of cameras and loop detection, Mn/DOT added sign gantries spanning the entire facility, with variable speed limit panels, lane control signals, and DMS panels for toll display.
Performance of System
Highway System Performance
Since the deployment of the PDSLs is very recent, extensive performance statistics are not available. Mn/DOT personnel state that the lane is working very well and is operating as planned. The full impact of the shoulder lane will occur during 2010 when the Crosstown Project is completed.
Safety and Incidents
As with system performance, safety statistics are not available at this time. However, Mn/DOT personnel believe that the facility is operating safely and as planned.
Case Study: Massachusetts—Shoulder Lane Use
Overview
Facility
- I-93: Exit 41 to Exit 47 from Wilmington to Methuen.
- SR 3: Exit 15 to Exit 12.
- I-95: Exit 12 to Exit 20.
- I-93: Exit 1 to Exit 4 (12 mi).
Operator
- Massachusetts Department of Transportation (MassDOT), Massachusetts State Police, and Commerce Insurance Courtesy Patrol.
Years of Operation
- 2002–current
Operating Strategy Overview
- Use of rightmost breakdown lane (shoulder) by general purpose traffic only during peak periods Monday-Friday. Hours of operation vary from 5:00 a.m.–10:00 a.m. in the morning and 3:00 p.m.–7:00 p.m. in the evening depending on the facility.
- Post-mounted signs in yellow and white provide information to drivers on breakdown lane availability. The DMS are being installed along I-93 in the northern section that will also be used to provide breakdown lane availability.
- Rumble strips, scored concrete, and block pavers were removed during installation.
- Emergency pull-out areas are located approximately every ½ mi along deployment locations.
- Heavy trucks are prohibited from using the breakdown lane as a travel lane during operational periods.
Number of Lanes
- One right shoulder.
Length
- 45 mi of breakdown lane use on four facilities.
Project Description
The Area
The facilities where breakdown lane use is operational during the peak travel periods are roadways in the Boston area that provide critical access to the region. Congestion on these facilities was to the point where traffic was at a standstill and drivers were taking the initiative to use the shoulder as a travel lane despite restrictions.
Breakdown Lane Use
The objective of opening the breakdown lanes to general purpose traffic during peak periods was to increase capacity. The maximum allowed speed on the shoulder is 65 mph (60 mph on SR 3), which is the posted speed for the general purpose lanes. A minimum of 10-ft shoulder width is required for the breakdown use operations, with 12 ft being the desired shoulder width. For each of the projects listed, MassDOT treated the deployment as a traditional widening project. To that end, drainage features were moved to the new edge of pavement, and guardrails and fixed object shielding were moved accordingly. Emergency pull-off areas were installed approximately every ½ mi along the facilities where breakdown lane use was deployed to facilitate incident management and response. The shoulders were resurfaced as part of these projects as well. Figure 46 shows the start of the breakdown lane use along I-93. A regulatory sign indicates the hours of operation and user restrictions.
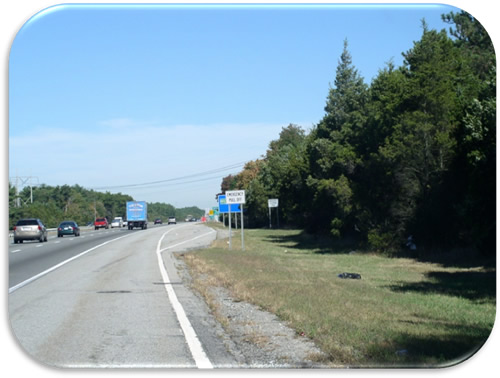
Figure 46. Photo. Breakdown Shoulder Use on I-93—Massachusetts. (23)
Project Conceptualization
With each deployment, MassDOT has to seek approval from FHWA to implement the strategy as a temporary measure until funding and approval are obtained for widening. The intent is for these facilities to be temporary in nature and not a permanent fixture for long-term capacity provision. The portion of I-95 with the breakdown lane use is currently in the construction phase of a project that will add a general purpose lane, at which time the shoulder use will be terminated. Bridges along that roadway that are being widened will have enough width to add another lane at a later date and still provide a shoulder for breakdown use. SR 3 is at the preliminary and environmental state of project approval for widening, which when completed will add a general purpose lane and terminate the temporary use of the breakdown lane as a travel lane.
Facility Management
The MassDOT oversees the general operation of the breakdown lane use in the Boston area. The Massachusetts State Police enforces the operational strategy, and the Commerce Insurance Courtesy Patrol provides roadside assistance in the corridors. Incident response along the facilities is typical of that across the region, with a unified response manual guiding procedures. Agencies involved include MassDOT, local fire departments, local police departments, environmental services, and other agencies with varying responsibilities for incident management.
Technologies Deployed
Some sensors are located within the I-93 corridor, along with cameras and overhead DMS. Most of these technologies existed prior to the deployment of the breakdown lane use. The DMS are currently being installed on the northern section of I-93 to facilitate user information.
Performance of System
Highway System Performance
The MassDOT does not maintain any specific measures of effectiveness for the breakdown shoulder use. In general, there has been a definite improvement in travel speeds along these corridors, though specific improvements are difficult to track because of the lack of complete deployment of devices in the field for data collection purposes.
Safety and Incidents
In general, MassDOT has seen no significant change in crash rates along these facilities with breakdown lane use operational. However, crash statistics are difficult to assess since crash data and crash locations do not really indicate whether a crash is in the breakdown lane or not.
Case Study: Washington—State Route 2, Temporary Shoulder Use
Overview
Facility
- US 2, eastbound direction of trestle.
Operator
- Washington State Department of Transportation.
Years of Operation
- 2009–current
Operating Strategy Overview
- Use of rightmost shoulder deployed during evening peak period to alleviate congestion on the trestle.
- All vehicles allowed to use the facility during operational hours.
Number of Lanes
- One right shoulder.
Length
- Approximately 1.55 mi.
Project Description
The Area
This particular facility is a congested location, as the trestle serves as a merge point for eastbound traffic coming from the Everett city center and high volumes from northbound I-5. While the capacity of I-5 was recently improved and HOV lanes were added to the facility, the previous I-5 bottleneck shifted from 526 to the Snohomish River Bridge—the US 2 trestle. Even the addition of an auxiliary lane on I-5 did not reduce congestion in the area.
Temporary Shoulder Use
The WSDOT saw the potential to alleviate congestion on the trestle by opening up the right shoulder during the evening peak. The objective of the project was to improve travel times, reduce the impacts of the bottleneck at the trestle, and relieve the congestion at a critical interchange in the region. All vehicles are allowed to use the right shoulder of the US 2 trestle in the eastbound direction during the evening peak. As shown in Figure 47, the skip striping indicates to the user that the shoulder is open for travel. Hours of operation are Monday–Friday, 3:00 p.m.–7:00 p.m., with a maximum allowable speed of 60 mph on the trestle.
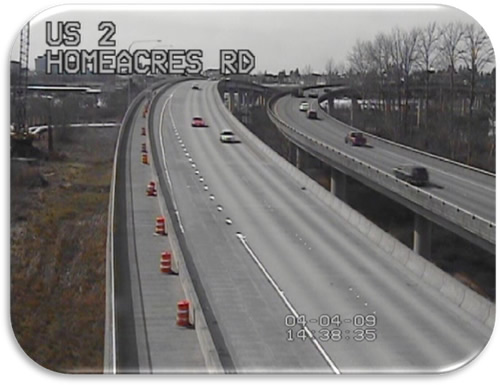
Figure 47. Photo. US 2 Shoulder Use—Everett, Washington. (55)
Project Conceptualization
The US 2 trestle is a highly congested corridor in the Seattle region. The WSDOT provides temporary use of the right shoulder in the evening peak to alleviate some of the congestion. The restriping deployed allows for three different movements on the trestle to remain in their own lanes when shoulder use is allowed. Each destination off the bridge (SR 204, 20th Street SE, and US 2 EB) can be reached from a separate lane when the shoulder use is allowed, eliminating the need for weaving and shared lane use. The intent of WSDOT is for this treatment to be a permanent one for the near future.
Facility Management
The WSDOT restriped the trestle to provide adequate space for the shoulder use. Figure 48 and Figure 49 show the cross-sections before and after the restriping, respectively. During the restriping project, one barrier had to be minimized to allow for a wider shoulder on the trestle. Regarding traffic control devices, a typical skip strip and solid edgeline strip were used, and one overhead sign was added to mark the Homeacre Road exit. No lane control signals are used on the trestle. Shoulder-mounted or barrier-mounted regulatory signs, which are manual flip signs, are posted every 1,200 ft. One display reads "SHOULDER OPEN TO TRAFFIC," while the closed version reads "SHOULDER CLOSED." The WSDOT personnel can flip these signs in the event of an incident on the trestle or when it is closed for log removal in the river. The DMS signs on I-5 can be used to provide traveler information to those drivers destined for the US 2 trestle.
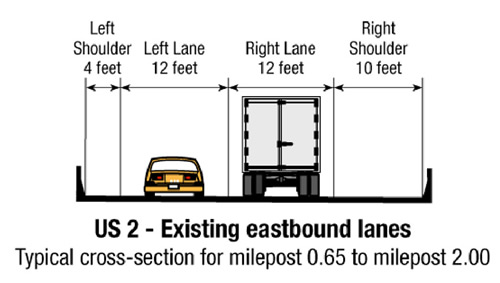
Figure 48. Illustration. US 2 Trestle Original Cross-Section—Everett, Washington. (55)
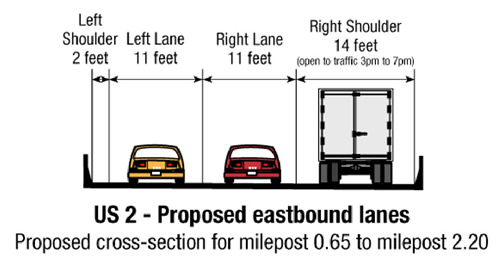
Figure 49. Illustration. US 2 Cross-Section for Shoulder Use—Everett, Washington. (55)
Technologies Deployed
No unique ITS technologies were deployed as part of this shoulder use project.
Performance of System
Highway System Performance
The primary performance measure for the trestle is travel time. After deployment, delay in this area was reduced from 8-10 minutes to 1-2 minutes on the facility. Travel times are much more reliable for this commute, and throughput on the access ramps has increased. The average speed on US 2 after implementation of the shoulder use and ramp metering on I-5 has increased from 10 mph to 37 mph, which is close to the maximum feasible of 42 mph because of ramp curvature.
Safety and Incidents
It is too early to confidently assess the safety improvements along the trestle. Anecdotal evidence provided by WSDOT personnel indicate that collisions at the conflict point where the roads merge on the trestle have been reduced. It is difficult to measure the true impact of the shoulder use since its deployment coincided with ramp metering on I-5, which feeds the US 2 trestle.
(36) Middelham, F. Dynamic Traffic Management. AVV Transport Research Centre, Rotterdam, The Netherlands: Ministry of Transport, Public Works, and Water Management, Directorate–General of Public Works and Water Management, June 2006. Presentation to Planning for Congestion Management Scan Team. Return to footnote 36.
(37) Wormgoor, F. The Netherlands Director–General for Public Works and Water Management. AVV Transport Research Centre, Rotterdam, The Netherlands: Rikswaterstaat, June 2006. Presentation to Planning for Congestion Management Scan Team. Return to footnote 37.
(38) Koot, A. Operational Aspects of Traffic Information. AVV Transport Research Centre, Rotterdam, The Netherlands: Ministry of Transport, Public Works, and Water Management, Directorate–General of Public Works and Water Management, June 2006. Presentation to Planning for Congestion Management Scan Team. Return to footnote 38.
(39) Taale, H. Regional Traffic Management Method and Tool. AVV Transport Research Centre, Rotterdam, The Netherlands: Ministry of Transport, Public Works, and Water Management, Directorate–General of Public Works and Water Management, June 2006. Presentation to Planning for Congestion Management Scan Team. Return to footnote 39.
(40) Sparmann, J. Freeway Operation in Germany: Experiences in Hessen. Athens, Greece: Hessian Ministry of Economy and Transport, June 2006. Presentation to 1st International Symposium on Freeway and Tollway Operations. Return to footnote 40.
(41) Pilz, A. Presentation of the Traffic Centre Hessen. Frankfurt, Germany: Jessian Ministry of Economy and Transport, June 2006. Presentation to Planning for Congestion Management Scan Team. Return to footnote 41.
(42) Grant, D. M42 Active Traffic Management Pilot Project. London, England: Highwas Agency, Department for Transport, June 2006. Presentation to Planning for Congestion Management Team. Return to footnote 42.
(43) Highways Agency, Department for Transport. Active Traffic Management (ATM) Project M42 Junctions 3A-7. [Online] http://www.highways.gov.uk/knowledge/tcc/atm/index.htm. Return to footnote 43.
(44) —. M25 Controlled Motorways Summary Report, Issue 1. London, England: Highways Agency, Department for Transport, 2004. Return to footnote 44.
(45) Department for Transport. About DfT. [Online] http://www.dft.gov.uk/stellent/groups/dft_about/documents/divisionhomepage/031259.hscp. Return to footnote 45.
(46) Tailor, P. Journey Time Reliability and Network Monitoring. London, England: Highways Agency, Department for Transport, June 2006. Presentation to Planning to Congestion Management Scan Team. Return to footnote 46.
(47) Highways Agency, Department for Transport. M42 Active Traffic Management Results — First Six Months. London, England: Highways Agency, Department for Transport, 2007. Return to footnote 47.
(48) —. 4-Lane Variable Mandatory Speed Limits - 12 Month Report. London England: Highways Agency, Department for Transport, 2008. Return to footnote 48.
(49) 12th International HOV Systems Conference: Improving Mobility and Accessibility with Managed Lanes, Pricing, and BRT. Federal Highway Administration. Houston, TX: U.S. Department of Transportation, 1995. https://ops.fhwa.dot.gov/publications/12hovsysconf/. Return to footnote 49.
(50) Ungemah, D., Kuhn, B. Special Use of Shoulders for Managed Lanes: Review of Practice and Research. Texas Transportation Institute. College Station, TX: s.n., 2009. Technical Report for Mn/DOT. Return to footnote 50.
(51) Virginia Department of Transportation. I-66 Multimodal Transportation and Environmental Study. Fairfax, VA: Virginia Department of Transportation, 2003. Return to footnote 51.
(52) Schintler, L. ITS Center Project: I-66 Integration Model. Arlington, VA: Virginia Department of Transportation, Federal Highway Administration, Partners in Motion Evaluation Subcommittee, 2001. http://www.gmupolicy.net/its/papers3/66/paper-Schintler-I-66.htm. Return to footnote 52.
(53) Virginia Department of Transportation. I-66 Spot Improvements Citizen Information Meeting. Fairfax, VA: Virginia Department of Transportation, 2007. http://www.virginiadot.org/info/resources/I-66_Spot_Improvements-CIM-9-26_2007.pdf. Return to footnote 53.
(54) —. High Occupancy Vehicle (HOV) Systems: Wehn and Where. Fairfax, VA: Virginia Department of Transportation, 2009. http://www.virginiadot.org/travel/hov-novasched.asp. Return to footnote 54.
(55) Swires, M., et al. US 2 - Hard Shoulder Running Case STudy. Washington State Department of Transportation. Vancouver, WA : s.n., 1009. Presentation. Return to footnote 55.