9. Evacuation Operations
Before iFlorida, access to real-time traffic data to support evacuation decision making was limited. On a statewide level, Florida Department of Transportation (FDOT) supported a network of 54 traffic monitoring stations that, during a hurricane evacuation, uploaded hourly data and made that data available via the Web. Staff at the State Emergency Operations Center (SEOC) monitored this information and alerted evacuation managers at the SEOC when observed volumes significantly exceeded historical values. The Florida Highway Patrol (FHP) also reported on congestion observed by its personnel in the field. Individual counties would sometimes report on traffic problems during regularly scheduled conference calls between the SEOC and all FDOT counties.
The iFlorida Model Deployment improved evacuation operations in several ways. It deployed 25 traffic monitoring stations across the State, stations that provided both real-time traffic measurements and traffic video. It deployed traffic monitoring devices on SR 520 and SR 528, key evacuation routes between the east coast and Orlando. Additional traffic monitoring was deployed on I-4 and I-95. The Central Florida 511 system was expanded and a new statewide 511 system was deployed. It also established network connectivity between a number of Transportation Management Centers (TMC) and Emergency Operations Centers (EOC) in the Orlando area as well as the SEOC. Taken together, these modifications had the potential to change evacuation operations by providing evacuation decision makers with new sources of real-time traffic information to guide their decision making processes.
This section of the report describes the iFlorida systems that were expected to impact evacuation operations, the types of impacts that occurred, and observations made during Florida hurricane evacuations.
9.1. Florida Evacuation Operations
Emergency management in Florida, and evacuation management in particular, is performed at the county (or regional) level, with State activities designed primarily to support county needs and to ensure coordination between counties and between Florida and neighboring States. Chapter 252 of the Florida statutes identifies the following key elements of Florida emergency management:
- The Florida Division of Emergency Management (FDEM) oversees regional emergency management organizations and authorizes cooperation with the Federal government and other states.
- FDEM prepares a State comprehensive emergency management plan that includes an evacuation component ensuring coordination for evacuees crossing county lines.
- The Governor specifies routes, modes of transportation, and destinations for evacuations and controls ingress and egress to and from an emergency area, and executes plans and rules for traffic control during evacuations. However, the Governor is expected to "utilize the services and facilities of existing officers and agencies of the State and of the political subdivisions thereof ... as the primary emergency management forces of the state."
- Each county develops a county emergency management plan. Two or more adjoining counties may, instead, develop a joint emergency management plan.
- Municipalities create municipal emergency management programs.
- All emergency management orders and rules are expected to take into consideration the orders, rules, actions, recommendations, and the requests of Federal authorities.
The result of this statutory background is an emergency management process in which most of the transportation-related issues are managed locally, with local officials appealing to State officials for support, when needed.1 For example, each county is responsible for determining when and if a county evacuation is required, though the State may encourage counties to do so. Similarly, evacuating counties work directly with surrounding counties to coordinate evacuation times and help ensure that sufficient shelters will be available to accommodate evacuees.
During an evacuation, State officials at the SEOC gather information about evacuation activities in each county, monitor statewide traffic patterns, and organize statewide conference calls to share emergency response information between the counties. For example, State officials monitor traffic on key evacuation routes and work with local transportation organizations, FDOT, and FHP to address transportation problems that arise. State officials also, at the request of local emergency response officials, address certain evacuation-related issues, such as organizing fuel shipments to counties running short on fuel, removing tolls on toll roads, and authorizing contraflow on evacuation routes. State officials also host conference calls with adjacent States to help the adjacent States prepare for an influx of Florida evacuees.
In summary, county (or regional) emergency response officials are the primary decision-makers regarding emergency evacuations in Florida, while State personnel at the SEOC are responsible for helping to coordinate the county emergency response decisions, providing requested support to the counties and regions, monitoring and responding to statewide issues, and coordinating with nearby States.
9.2. iFlorida Activities to Support Evacuations
As a result of iFlorida and other projects that occurred in parallel, FDOT's ability to monitor evacuation traffic and the resources available for distributing traveler information during an evacuation increased significantly. The following list describes the most important of these changes:
- Deployment of loop detectors and video surveillance on SR 528 and SR 520. SR 528 is a key evacuation route between the east coast and Orlando, and SR 520 is an alternate route from the coast. A dense network of loop detectors was deployed on SR 528, and a limited number of detectors were also placed on SR 520.
- Traffic monitoring on Orlando toll roads. The Orlando-Orange County Expressway Authority (OOCEA) deployed a network of toll tag readers and software to estimate travel times on OOCEA toll roads and provided this data to the iFlorida systems. As part of iFlorida, FDOT D5 deployed additional devices to monitor traffic on Orlando toll roads not managed by OOCEA. Closed Circuit Television (CCTV) and Dynamic Message Signs (DMS) were also deployed on these toll roads.
- Traffic monitoring on Orlando arterials. As part of iFlorida, FDOT D5 deployed toll tag readers on Orlando arterials to estimate travel times and CCTV to monitor traffic.
- Traffic monitoring on I-4 and I-95. As part of other projects, the loop detector and CCTV network on I-4 was extended east of Orlando to I-95. A similar network was deployed on I 95. This traffic monitoring data was integrated into iFlorida systems. DMS were also deployed in these areas.
- Weather monitoring. A set of Road Weather Information System (RWIS) stations were deployed, including wind speed monitoring stations on bridges. A contractor also provided road-specific weather data and forecasts.
- Statewide traffic monitoring. A collection of 25 traffic monitoring stations with CCTV and radar-based traffic monitoring were deployed across the State.
- Traveler information. A statewide 511 system was deployed, and the I-4 511 system was extended to include all of the roads for which traffic monitoring was available (i.e., I-4, I-95, Orlando toll roads, and key Orlando arterials).
The combination of these changes enhanced FDOT's ability to monitor evacuation traffic in the Orlando area and to provide traveler information to the public. The changes also somewhat enhanced evacuation traffic monitoring capabilities across the state and created a statewide 511 system that could be used to provide traveler information during an evacuation.
9.3. Impacts of iFlorida Activities on Florida Evacuations
Several factors limited the impacts that iFlorida had on Florida evacuations. First and foremost were the problems experienced with the Condition Reporting System (CRS). This software was designed to support operations at the Regional Traffic Management Center (RTMC) by gathering data from the traffic monitoring devices on roads near Orlando and statewide, presenting the data to RTMC operators to support traffic management decision making, and managing traveler information resources. The CRS was also a key part of the plans for sharing traffic data with regional transportation agencies, including those responsible for evacuation decision making. The intention was for agencies interested in accessing iFlorida or other FDOT traffic data to install a copy of the CRS and use it to view the data.
| Difficulties with the iFlorida deployment limited the impacts on Florida evacuations that occurred. |
Initially, a number of agencies expressed an interest in installing copies of the CRS from FDOT. Most were hoping to use the CRS both to access iFlorida data and manage their own ITS resources. When the CRS did not perform as expected (see section 2 for more information), these agencies chose not to install copies of the CRS, limiting access to iFlorida data to FDOT. Thus, most evacuation decision makers in the Orlando area did not have direct access to the iFlorida data on evacuation routes. One important exception was the video from the Statewide Monitoring System, which was available at the SEOC in the 2006 and 2007 hurricane seasons.
A second limitation had to do with the reliability of the traffic monitoring equipment on evacuation routes. One result of the large increase in the amount of field equipment deployed and maintained by FDOT D5 that occurred from 2003 to 2005 was that FDOT had trouble achieving high levels of reliability with this equipment. Figure 70 depicts the availability2 of the Statewide Monitoring System field equipment, indicating that camera video was available from less than half the cameras on most days. (Section 5 provides more information on the challenges FDOT faced in maintaining the iFlorida field equipment.)
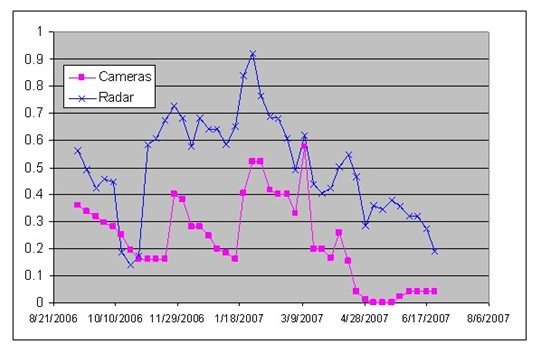
Figure 70. Availability of the Statewide Monitoring Field Equipment
Figure 71 depicts the availability of the Hurricane Evacuation System (HES) field equipment.
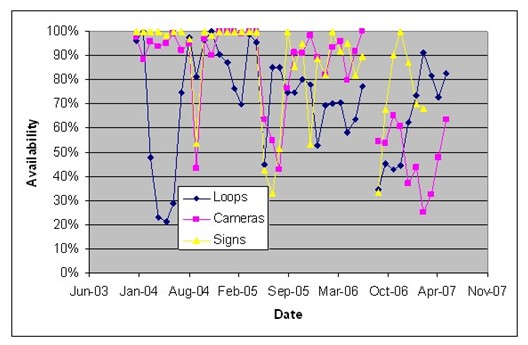
Figure 71. Availability of the HES Field Equipment
The last limitation was simply that no significant hurricane evacuations occurred in Florida during the 2006 and 2007 hurricane seasons, the time when the iFlorida equipment and systems were available.
9.4. Evacuation Observations during Florida Hurricanes
Despite the fact that no significant hurricane evacuations occurred while the iFlorida systems were operational, observations by the Evaluation Team during hurricanes that occurred in the 2005 hurricane season did lead to some lessons learned with regard to hurricane evacuations.
9.4.1. Hurricane Charley
Hurricane Charley began as Tropical Depression Three on August 9, 2004. By August 11, it had been upgraded to a hurricane. Before making landfall near Charlotte Harbor on August 13, Charley strengthened rapidly from category 2 to category 4 and gusts of up to 180 mph were reported. From there, Charley swept quickly through the State of Florida, passing directly through Orlando, and crossed over a small section of the Atlantic before making a second landfall in South Carolina. The storm track through Florida for Hurricane Charley is depicted in Figure 72 below, along with the counties that issued evacuation orders in response to the hurricane. The 17 counties that issued mandatory evacuation orders are highlighted in red. The 16 that suggested voluntary evacuations are highlighted in yellow.
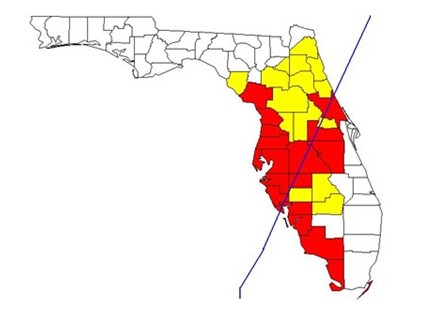
Figure 72. Storm Track and Evacuating Counties for Hurricane Charley
Estimates were that more than 1 million Floridians evacuated due to Hurricane Charley, resulting in significant increases in traffic volumes on some Florida roads (see Figure 73).
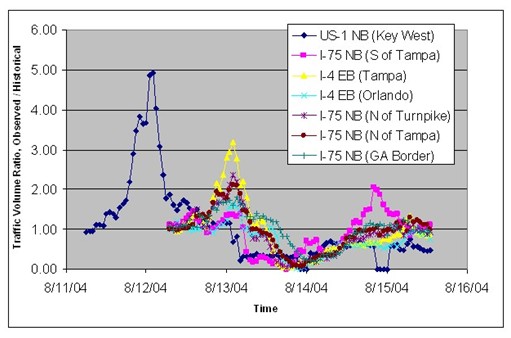
Figure 73. Traffic Volumes During the Hurricane Charley Evacuation,
South and Central Florida
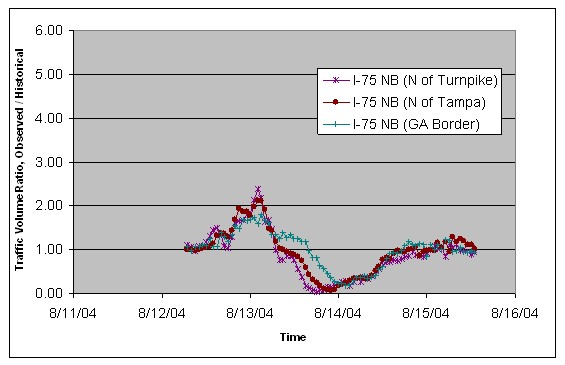
Figure 74. Traffic Volumes During the Hurricane Charley Evacuation, Central and North Florida
In Figure 73, the charted values are the ratio of the observed hourly traffic volumes to the historical hourly traffic volumes for that day and hour taken from FDOT's Telemetered Traffic Monitoring Site (TTMS) system.

A value above 1 indicates more traffic than the historical average would suggest for that day and time, likely due to evacuating vehicles. The largest values tended to occur during the late-night or early-morning hours, when the historical volumes were low. The date values on the x-axis indicate midnight at the start of the particular day. The flows are listed in the approximate order in which the hurricane traffic impacted the indicated roads, starting with US 1 in Key West, then proceeding to roads north of the landfall point and south of Tampa and following traffic flows north and east.
Note that very little evacuation traffic flowed north from Charlotte Harbor on I-75 northbound, South of Tampa. This is likely because news reports at the time emphasized the potential for Hurricane Charley to make landfall near Tampa. The traffic peaks were localized, with only a small increase in traffic crossing the Georgia border. A separate review of traffic speeds indicated few prolonged drops in traffic speeds during this evacuation.
During Hurricane Charley, the Evacuation Team observed operations at the D5 RTMC. These observations indicated that the primary role of the RTMC at that time was to monitor and respond to traffic conditions on I-4. The RTMC operators recorded 511 messages, set DMS messages, managed Road Ranger activities on I-4, and coordinated with FHP. The main tool used to monitor I-4 traffic was the traffic video. Speed and volume data from the I-4 loop detectors were rarely consulted. The RTMC did not have access to traffic data from across the state, so had trouble anticipating whether future traffic conditions would worsen because of incoming evacuation traffic. On one occasion, a D5 RTMC operator phoned the RTMC in Tampa to obtain information on the traffic volumes leaving Tampa heading towards Orlando.
The iFlorida Model Deployment changed many of these characteristics. After iFlorida, the D5 RTMC was able to monitor traffic on all limited access roads in the Orlando area, including all key evacuation routes. The RTMC also had access to traffic conditions at locations across the state. Automated traffic monitoring systems produced travel time estimates for these roads. The RTMC was responsible for managing both the Central Florida and Statewide 511 systems.
9.4.2. Hurricane Frances
Hurricane Frances (see Figure 75) began as Tropical Depression Six on August 24, 2004. On August 26, Frances was classified as a hurricane and continued intensification was forecast. By September 3, Frances had begun to weaken and had slowed to 6 mph. The National Hurricane Center (NHC) expressed concerns that a large, slow Frances could bring torrential rains and flooding to Florida. NHC reports on the evening of September 4 indicated that Frances was "nearly stationary." Frances made landfall around 10:00 a.m. on September 5 near Sewall's Point, and passed slowly across central Florida into the Gulf of Mexico. Frances later turned north and hit the Florida panhandle on the afternoon of September 6. In response to this storm, 28 counties issued mandatory evacuation orders and 17 counties suggested voluntary evacuations.
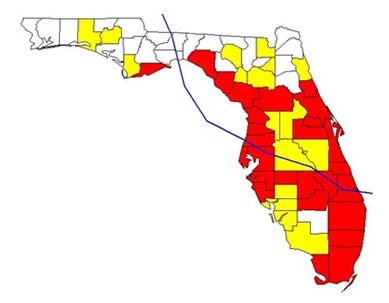
Figure 75. Storm Track and Evacuating Counties for Hurricane Frances
The traffic peaks (see Figure 75) resulting from Hurricane Frances were significantly larger than for Hurricane Charley and extended over a larger area, with significant traffic flows reaching all the way to the Florida-Georgia border.
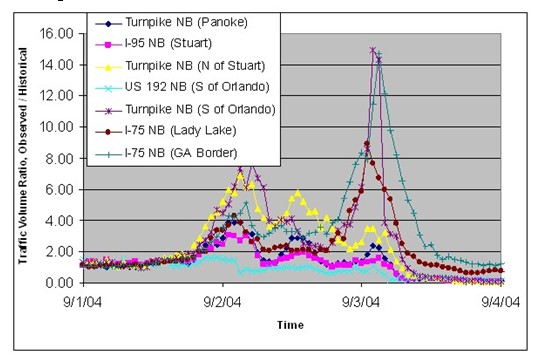
Figure 76. Traffic Volumes During the Hurricane Frances Evacuation
The extreme peaks shown on September 3 reflect the fact that high traffic volumes occurred in the early morning hours when historical volumes were small. This was indicative of high demand that continued throughout the night, which was likely caused by bottlenecks on I-75. A number of reports from the SEOC identified traffic problems around the state. FHP reported significant congestion on the Florida Turnpike. Calls to local TMCs indicated that traffic was at a crawl on I-95 north of Daytona, on I-75 in Ocala, and on I-4 in Marion County. Georgia reported that a 20-mile backup existed on I-75 in Georgia. It is interesting to note that speed data from the TTMS sites (see Figure 76) did not reveal the extent of the congestion across the State.
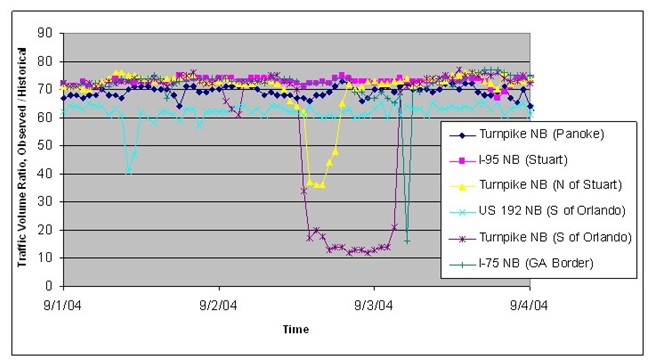
Figure 77. Traffic Speeds During the Hurricane Frances Evacuation
| Point speed measurements did not produce an accurate picture of the amount of congestion across the State. |
The TTMS data identified significantly reduced speeds on the Florida Turnpike, but indicated that traffic was flowing at normal speed on other roads across the state. This was likely because the TTMS sites happened to be at points away from the bottlenecks where congestion was occurring on I-75. The high traffic volumes shown in Figure 75 made it clear that a large number of evacuating vehicles were on the road, so congestion was likely. But, confirmation of that came from the local TMCs and the FHP rather than from the TTMS data.
During Hurricane Frances, the evaluation team observed traffic management operations at the SEOC in Tallahassee. The following list describes the main activities that were observed:
- Monitoring traffic conditions at the TTMS sites. One person stationed at the SEOC spent most of his time reviewing the TTMS Web site and reporting any unusually high traffic volumes to evacuation decision makers.
- Hosting evacuation status report meetings with all Florida counties. The SEOC hosted conference calls twice per day that were attended by representatives from each Florida county. These meetings allowed the SEOC to help coordinate evacuation activities, such as ensuring that receiving counties had opened sufficient shelters to handle the number of evacuees expected from evacuating counties. They also allowed counties to report any problems that they wanted the SEOC to address, such as arranging for gasoline shipments to arrive in counties where shortages were expected.
- Hosting evacuation coordination meetings with regional emergency managers of the regions directly impacted by the hurricane. These calls addressed concerns specific to evacuating counties, such as the need for shelters and the potential for contraflow operations.
- Hosting evacuation coordination meetings with adjacent states. These calls helped ensure that adjacent states were prepared to receive people evacuating from Florida.
- Addressing issues identified during the status and coordination meetings. One issue that was addressed was gasoline shortages. The evacuation increased the demand for gasoline as people prepared to evacuate just as ports closed and fuel shippers moved transport vehicles out of the area to avoid the hurricane. Because gasoline supply lines were likely to remain disrupted for several days after the hurricane passed, counties in the hurricane's path also wanted to establish gasoline reserves so they could operate response vehicles after the hurricane. The SEOC staff worked with the ports and gasoline suppliers to arrange for gasoline shipments to counties where shortages were reported.
Twice during Hurricane Frances, the SEOC was involved in contraflow decision making. The first occurred on September 2, when the Governor granted approval to use contraflow on SR 528, if it was needed. A conference call was held with the FDEM Region Coordinator for Region 5, which includes Orlando and SR 528. The Region 5 Coordinator reported that evacuees were being encouraged to go to nearby shelters and that contraflow on SR 528 was not expected to be necessary. The coordinator also noted that several cruise ships were docked in Port Canaveral and that up to 10,000 people might be making the trip from Orlando to Port Canaveral on SR 528 to board those ships. The coordinator warned that instituting contraflow on SR 528 would prevent those passengers from reaching the port, stranding them in the path of the hurricane. After considering these factors, the plan for contraflow was abandoned. The observed traffic flows on SR 528, shown in Figure 77, seem to support this decision.
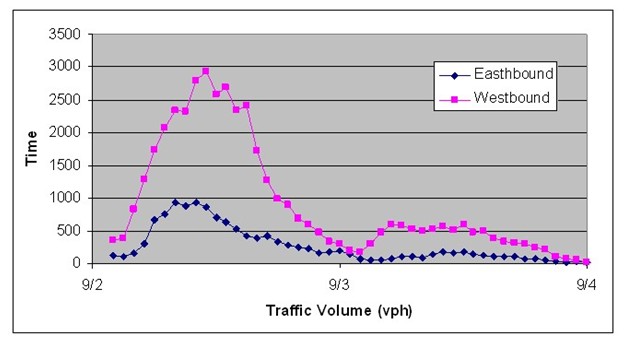
Figure 78. Traffic Volumes on SR 528 Near the Georgia Border During
Hurricane Frances
The second contraflow decision related to reports that the State of Georgia was considering instituting contraflow on I-75 at the Florida-Georgia border. As shown in Figure 78, high traffic volumes occurred on I-75 northbound through most of the day on September 2 carrying over through the night into the morning of September 3. Georgia also reported that significant delays were occurring on I-75 in south Georgia. The State of Georgia was concerned that, if higher demand occurred on September 3, then a significant bottleneck might develop and evacuees could be trapped on the highway.
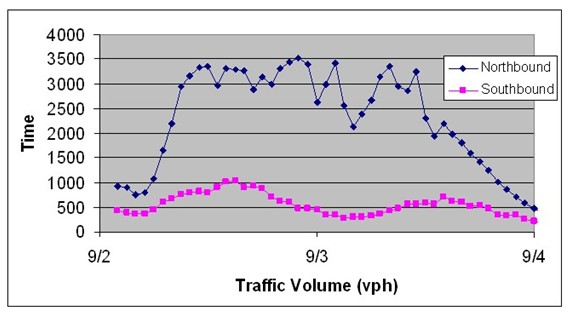
Figure 79. Traffic Volumes on I-75 Near the Georgia Border During Hurricane Frances
The SEOC responded by consulting the TTMS Web site to estimate demand that was likely to occur on I-75 entering Georgia. Although traffic levels were high, demand on most roads was lower than the previous day and was leveling off or dropping. This seemed to indicate that demand at the Georgia line was probably peaking. FDOT also deployed signs at the I-75 / I-10 interchange encouraging evacuees to take I-10 rather than I-75. The State of Georgia was briefed on these results and on other traffic observations from around Florida and chose not to use contraflow on I-75.
| The determination of whether to use contraflow depends on estimates of future demand. Real-time traffic data is of limited use in making this estimate. |
In these two instances, the determination of whether to use contraflow depended primarily on estimates of future demand. (This was because of the long preparation time required to set up contraflow operations.) In the case of SR 528, the estimates of future demand depended primarily on local knowledge of the regional emergency managers, who were encouraging evacuees to use local shelters and knew of future demand in the eastbound direction. In the case of I-75, the estimates of future demand relied on comparisons of current and previous-day demand to determine if demand was likely to be greater or less than the previous day.
The evaluation team noted that in neither case were current traffic conditions key in the decision-making process. In the case of SR 528, current traffic conditions were not discussed during the decision-making process. In the case of I-75, current traffic conditions were used only to verify that volumes were lower than during the previous day. It is also worth noting that, during the Hurricane Charley and Hurricane Frances evacuations, the period of high demand only lasted about 24 hours. Given the length of time required to set up contraflow operations, it might have been too late to do so if decision makers had waited for real-time traffic volumes to indicate that a need was developing.
| A tool that integrated current traffic condition data would be a valuable tool for supporting SEOC traffic management decision making. |
Even though current traffic condition data was not key in the contraflow decision making process, an understanding of current traffic conditions was important for other decisions. SEOC staff felt that this data was important enough that one person spent a majority of his time monitoring the traffic data on the TTMS Web site and summarizing the information that was contained there. As already indicated above, the TTMS data gave an incomplete view of traffic conditions across the State, and reports from local TMCs and FHP were necessary to provide more detail. Yet, the SEOC had no tools available to integrate the traffic data from these different sources to create a consolidated view of statewide traffic conditions. The evaluation team felt that a tool that automatically integrated available data and used it to estimate potential problem points would save time and, potentially, improve evacuation decision making.
The evaluation team also noted that Florida's basic approach to emergency management in the areas observed by this evaluation team was to distribute the decision-making responsibility to the county (or regional) emergency managers. The primary responsibilities of the State were to provide support requested by the counties and regions and to coordinate with other States and the Federal government. For example, each county (or region) developed its own emergency management plan, determined its emergency activation level, and decided whether and when to declare an evacuation. The State addressed issues that extended beyond the jurisdiction of the counties and regions, such as coordinating with the Federal Emergency Management Agency (FEMA), arranging for shipments of fuel and other key goods, lifting tolls on toll roads, and managing contraflow operations.
The State also provided oversight of county and regional activities, ensuring that local officials took appropriate steps to safeguard their citizens and support surrounding counties. For example, the Governor had the authority to declare an evacuation if county officials did not do so. Although this authority was not used, the existence of this dual authority helped ensure that county and State officials consulted with each other and reached a consensus on key emergency management decisions.
| The distributed model for emergency management used in Florida worked very well. |
This division of responsibility appeared to work very well. The State ensured that the counties had access to up-to-date information on the hurricane and statewide traffic conditions. The counties, then, had necessary information to make decisions on whether and when to evacuate. By organizing coordination conference calls, the State helped ensure that these decisions were coordinated between the counties. Many of the evacuating Counties coordinated directly with neighboring Counties to ensure that their evacuees could find shelter, while the State gathered statewide information about the number of expected evacuees and the available sheltering capacity to look for discrepancies. This combination of local control of the emergency response for each County and State support for and oversight of emergency response activities proved very effective.
As the evacuation was ending and traffic flows began to drop around the state, the SEOC staff began to discuss problems related to re-entry after the hurricane had passed. A number of challenges and potential concerns for future evacuations were noted during these discussions:
- Disseminating information to returning evacuees. SEOC staff identified
information needs of returning evacuees, including advising evacuees of
the availability of food, water, and gas along return routes and the accessibility
of electricity, food, and water at their homes when the evacuees return.
Experience has shown that it is difficult for most evacuees to gain access
to this type of information before deciding to return.
- It was difficult to communicate with Floridians who had evacuated the State. Mechanisms existed for communicating with Floridians before the evacuation-information provided to Florida commercial media went out on Florida TV, radio, and newspapers, FDOT could provide information via 511 systems, message signs, and highway advisory radio, etc. Most of these methods could not reach evacuees outside of the State.
- Managing the return of evacuees before services are restored. Many evacuees, concerned about the security of their possessions and anxious to repair damages that may have occurred may be tempted to return before vital services, such as water or electricity, are restored in their areas.
- Preparing for possible congestion during re-entry. During the evacuation, Florida counties spread out evacuation orders over time to help reduce the peak traffic demand. During re-entry, no mechanism existed to directly impact the time at which evacuees choose to return. If most evacuees chose to return at or about the same time, the peak demand during re-entry would be higher than the peak demand during the evacuation.
These discussions made it clear that managing the outgoing evacuation traffic was only half of the evacuation traffic management challenge.
9.4.3. Hurricane Jeanne
Hurricane Jeanne began as Tropical Depression Eleven on September 13, 2004, reaching hurricane strength on September 16. Jeanne made landfall as a category 3 hurricane on September 25 near Stuart, Florida, very close to the place Hurricane Frances came ashore. Jeanne turned north near Lake Okeechobee and passed through the Florida peninsula. The storm track through Florida for Hurricane Jeanne is depicted in Figure 79, with the 28 counties that issued mandatory evacuation orders highlighted.
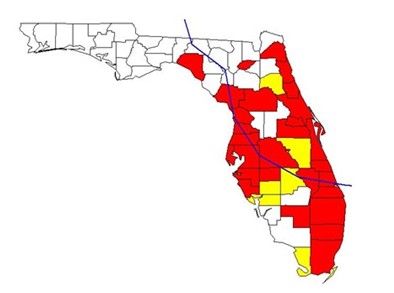
Figure 80. Storm Track and Evacuating Counties for Hurricane Jeanne
The traffic volumes that occurred during the Hurricane Jeanne evacuation are depicted in Figure 80.
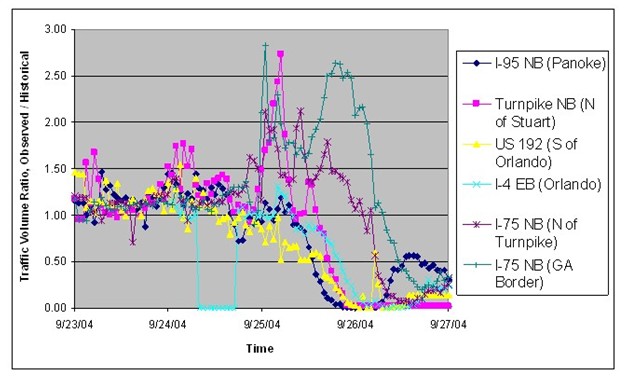
Figure 81. Traffic Volumes during the Hurricane Jeanne Evacuation
The evacuating traffic showed similar patterns to those observed during Hurricane Frances, but with lower overall demand.
9.5. Summary and Conclusions
The observed impact of the iFlorida Model Deployment on Florida evacuations was small. One cause for this was that the problems experienced with the CRS prevented its use at locations other than FDOT, limiting evacuation decision makers' access to iFlorida data. There were also problems with maintaining the field equipment that monitored evacuation routes. The fact that no significant hurricane evacuations occurred in Florida limited the possibility of observing any changes in evacuation operations that might have occurred.
Observations of evacuation operations that occurred while the iFlorida systems were being deployed did point to some of the potential impacts iFlorida might have on evacuation operations as well as some potential limitations. These observations also identified successful evacuation management practices other States might consider. The following list summarizes the potential impacts, limitations, and lessons learned:
- Access to statewide traffic data is important. SEOC staff spent
a considerable amount of time gathering information about statewide traffic
conditions: consulting the TTMS Web site, calling local TMCs, and holding
discussions with FHP officers. One SEOC staff member specifically noted
that having access to video from the iFlorida traffic cameras would
"be invaluable for this coming hurricane season." The operations center
staff's understanding of traffic conditions was important in making a number
of evacuation decisions, such as setting up signs to encourage evacuees
to use less congested routes and whether to use contraflow.
- The data from the sparse network of TTMS sites did not accurately represent traffic conditions on some roads. During Hurricane Frances, reports from local TMCs and the FHP indicated that significant congestion was occurring on a number of roads across the State. The TTMS data identified high traffic volumes on these roads, but did not indicate low travel speeds on most of them. The iFlorida Statewide Monitoring System may have similar limitations.
- The D5 RTMC did not have ready access to information about evacuating traffic that might be entering the district. During Hurricane Charley, the D5 RTMC did not have access to data indicating how much evacuation traffic to expect on I-4 from Tampa. This made it difficult for the agency to decide whether it needed to take actions to prepare for high traffic volumes. A call to the Tampa TMC provided FDOT D5 with the information it needed.
- A tool to consolidate statewide traffic data might be beneficial. The SEOC relied on traffic information from numerous sources, including the TTMS Web site and reports from local TMCs and the FHP, to provide them with an understanding of traffic conditions across the state. But, it did not have a tool to consolidate all of this information. Charts from the TTMS Web site were printed and hand written notes were taken for other traffic reports. A tool that consolidated this information might simplify the process of collecting the traffic data and improve the overall understanding of statewide traffic conditions.
- Estimates of future traffic demand were needed to support contraflow
decision-making. During Hurricane Frances, it was estimated that it
would require 3 hours to set up contraflow on SR 528. The long setup time
and the fact that contraflow operations are not allowed at night in Florida
effectively requires that a contraflow decision be made a day before contraflow
is implemented. So, the contraflow decision must be based on estimates of
traffic demand for the following day.
- For coastal areas, knowledge of the number of people expected to evacuate and their expected destinations was key to estimating future traffic demand. When contraflow was considered on SR 528 during Hurricane Frances, regional emergency management personnel were encouraging people to use local shelters and believed that this would prevent excess traffic demand on SR 528.
- For inland areas, knowledge of the amount of upstream evacuation traffic was key to estimating future traffic demand. When contraflow was considered on I-75 in south Georgia during Hurricane Frances, the SEOC reviewed traffic counts from across the state to estimate whether this traffic was likely to create excess demand on I-75 as the evacuating traffic continued its migration northwards. Indications that traffic demand was decreasing throughout much of the state provided evidence that traffic demand on I-75 would soon be decreasing.
- A distributed approach to evacuation management is very effective.
In Florida, many of the responsibilities for evacuation management are delegated
to the counties, with the State arranging coordination between the counties,
responding to requests from them, and coordinating with adjacent States.
This approach was very effective.
- Coordination is key. One of the most important roles of the SEOC during the evacuation was to arrange conference calls that helped improve coordination. SEOC hosted conferences calls attended by all Florida counties twice per day, with additional calls with the Regional Emergency Managers for areas directly impacted by the hurricane. The counties also had access to a software application that allowed them to submit requests to the SEOC. To coordinate with adjacent States, the SEOC hosted daily conference calls with them.
- Co-location of personnel in the SEOC improved coordination. It often required a number of different people with knowledge and expertise in many different areas to address the problems that arose during an evacuation. For example, providing gasoline to counties with shortages required the Port of Tampa to postpone closing to allow gasoline shipments to arrive, gasoline tankers off shore to head to port, and gasoline shippers within the state to deliver the fuel to the counties with shortages. The co-location at the SEOC of staff spanning these different functional areas allowed for quickly locating people with the proper knowledge and expertise to address the problems that arose.
While the impacts of the iFlorida Model Deployment on evacuation operations during the 2006 and 2007 hurricane seasons were limited, there are reasons to believe the impacts may be larger in the future. First, the CRS software was replaced with SunGuide software, and this software appeared to be providing more reliable access to traffic monitoring data and more flexible tools for using that data for traffic management and traveler information. A number of traffic and emergency management organizations in the Orlando area had expressed an interest in obtaining licenses to install the SunGuide software, which will provide them with access to iFlorida data. Once evacuation managers have access to the iFlorida data, they may begin to integrate it into their evacuation decision-making processes.
FDOT D5 had also begun negotiating with other FDOT district offices to take over responsibility for maintaining Statewide Monitoring System equipment located in their districts. While FDOT D5 was maintaining this equipment, the high cost of traveling to those locations limited the amount of maintenance that was performed. With the local FDOT districts performing the maintenance, the equipment reliability will likely increase.
With more reliable equipment and wider access to the traffic monitoring data generated by this equipment, the next several years may provide more insights into the potential for enhanced traffic management capabilities to improve evacuation management.
1 State emergency management officials do have the authority to overrule local officials on some issues, though this authority is seldom exercised.
2 The availability refers to the percentage of the equipment reported by FDOT as being in-service each day, averaged over each month.