8. Statewide Operations
Before iFlorida, statewide traffic management activities were mostly limited to support for hurricane evacuations. During a hurricane, the Florida Department of Transportation (FDOT) Transportation Statistics Office would activate real-time data collection for its Telemetered Traffic Monitoring Site (TTMS) network, which would provide volume and speed information from a subset of 54 stations scattered across the state. Most other traffic management activities were handled regionally by the seven FDOT districts and by FDOT staff stationed at the State Emergency Operations Center (SEOC).
The main objective of iFlorida statewide operations was to establish statewide traffic management by deploying new traffic monitoring devices and consolidating those devices with existing sources of statewide traffic data, then disseminating this data to the public as traveler information and to decision makers in need of statewide traffic information-primarily those involved in hurricane evacuation decision making.
8.1. iFlorida Statewide Activities
The iFlorida statewide activities established methods for monitoring traffic conditions statewide, a 511 system, and a Web site for disseminating this traffic information. Specifically, the iFlorida statewide operations included the following activities:
Statewide Monitoring. Twenty-five traffic monitoring stations, including radar for traffic detection and video, were deployed at existing microwave communication towers. These stations used available bandwidth in the microwave network to transmit these data back to the District 5 Regional Traffic Management Center (D5 RTMC). The locations of these stations are depicted in Figure 67 below.
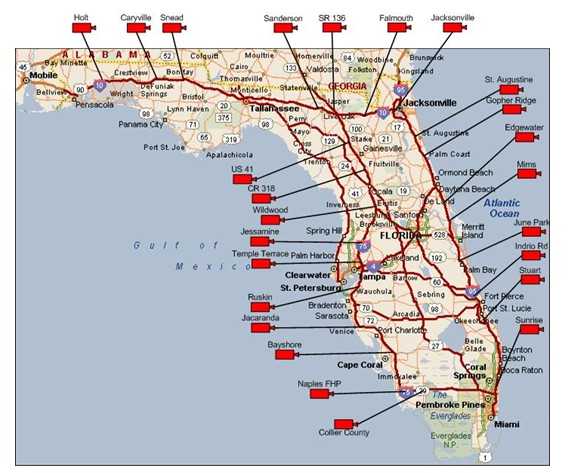
Figure 67. Locations of iFlorida Statewide Traffic Monitoring Stations
Florida Highway Patrol (FHP) Incident Data. An interface was established between the FHP Computer-Aided Dispatch (CAD) system and FDOT to transmit FHP CAD data to the D5 RTMC. These data included information about incidents that occurred across the State.
Weather data. FDOT contracted out for weather data and forecasts for each Florida Intrastate road segment. The supplier used software to fuse weather data from multiple sources and generate weather forecasts for each road segment at various time intervals, and then providing these data and forecasts to the D5 RTMC. The weather data provider also provided severe weather alerts that covered entire counties and individual roads. FDOT received additional data from a network of Road Weather Information System (RWIS) stations that were deployed at locations across the State.
Statewide Traveler Information. As part of the iFlorida deployment, FDOT established a statewide 511 system. The traveler information provided by the system was managed by the D5 RTMC, based on the statewide data sources listed above. A Web site also provided travelers with access to statewide traveler information.
iFlorida Condition Reporting System. The iFlorida Condition Reporting System (CRS) is a software system that was intended to consolidate the traffic, incident, and weather information and help the D5 RTMC staff manage the traveler information resources and other tools used to manage traffic. Different versions of the CRS were applied to the Orlando and statewide road networks. This system did not work as intended and was eventually abandoned and replaced with software developed by a different vendor.
8.2. Using Microwave Communications to Transmit Statewide Monitoring Data
The Statewide Microwave System (SMS) was originally deployed in the 1980s to support emergency call boxes that are available at regular intervals on Florida Interstate Highways. The combination of Road Rangers (motorist assistance patrols), cameras monitoring roads, and the availability of E911 service and cell phones have made the call boxes less important in helping travelers report incidents that do occur. Consequently, FDOT is in the process of removing call boxes from many FIHS roads.
Starting in 2002, the SMS was upgraded from an analog, non-integrated system to a digital backbone to create a seamless and homogenous statewide network. The SMS upgrade was performed in three phases. The first phase involved the construction of towers and shelters at various locations. The second phase involved changes to the microwave radios, re-channelization of the system, reconfiguration of the motorist aid call box system, and installation of a statewide network management system. The third, and final phase, involved a data network overlay to facilitate data and video transport across the state.
The network consists of a set of hub sites with fiber connection and remote sites using microwave to communicate with the hub sites. The remote sites are daisy-chained, so that bandwidth usage at the remote site nearest the hub is the sum of the bandwidth required for that site and for all other remote sites directly or indirectly connected to it. This network is capable of transmitting up to 33 megabits per second (Mbps) between hub sites and up to 3 Mbps from remote sites to hub sites. The SMS can also support the transmission of multiple streams of IP-based traffic information from remote field devices to Regional Traffic Management Centers (RTMC) that are connected to the microwave system data network.
Designing Around Limited Bandwidth. One of the challenges faced in designing the Statewide Monitoring System to use the SMS was the limited bandwidth available and the relatively high bandwidth requirements of traffic video. Table 13 lists the approximate bandwidth required for different types of video using different types of compression.1
| Resolution | MPEG-2 | MPEG-4 | ||||
|---|---|---|---|---|---|---|
| Low | Medium | High | Low | Medium | High | |
| QCIF | 0.34 | 0.24 | 0.14 | 0.17 | 0.12 | 0.07 |
| CIF | 1.01 | 0.62 | 0.38 | 0.50 | 0.31 | 0.19 |
| 4CIF | 2.88 | 1.92 | 1.10 | 1.44 | 0.96 | 0.55 |
| Mbps = Megabits per second. QCIF = Quarter Common Intermediate
Format (176 pixels by 144 lines, 30 frames per second; 1.22:1). CIF = Common Intermediate Format (352 pixels by 288 lines, 30 frames per second; 1.22:1). 4CIF = 4 times Common Intermediate Format (704x576 pixels). |
||||||
Given that the bandwidth available from remote sites to hub sites was limited to 3 Mbps and part of this bandwidth was reserved for other applications, FDOT determined that it could deploy, at most, three monitoring sites along a single "spoke" of remote microwave towers. The first step taken by FDOT in designing this system was to review the network topology for the microwave network to identify the remote towers that shared a single spoke. This allowed FDOT to select Statewide Monitoring System sites so that no more than three sites lay along the same spoke before reaching a hub site.
| A key to making use of a microwave network is accommodating its bandwidth limitations. |
FDOT also required that each site include video compression hardware that was remotely configurable. This allowed FDOT to easily vary the video type and compression after the system was deployed in order to find the combination that worked best with the limited bandwidth available through the SMS. At the time of this report, FDOT was using MPEG-4 with CIF resolution and low compression for an expected bandwidth usage of about 500 kilobits per second per camera. The resulting video appears slightly grainy on a full screen and slightly choppy. FDOT felt that the video was definitely of high enough quality to support traffic management decision making, though the quality was noticeably lower than most other video that FDOT D5 has available.
Impact on Site Selection. The original plans for the Statewide Monitoring System called for an upgrade to existing TTMS stations to support real-time communications. The remote location of these sites made it difficult to establish the high-bandwidth communications needed to support transmission of traffic and traffic video data in a cost-effective manner. As a solution to this communication problem, FDOT decided to deploy Statewide Monitoring System stations at existing microwave tower locations. This choice significantly reduced costs by allowing FDOT to take advantage of existing buildings and enclosures, existing utility connections, and existing communications.
The downside of this approach was that it restricted the choice of sites to the locations of microwave towers. Since these sites did not coincide with existing TTMS locations, the data from the Statewide Monitoring System was not integrated with pre-existing statewide traffic data collection activities of the FDOT Transportation Statistics Office. This resulted in two independent systems for monitoring statewide traffic, with separate costs for maintaining each. Since these sites did not necessarily coincide with the best locations for monitoring traffic, the resulting stations were sometimes located at less than ideal positions.
As an explicit example, FDOT pointed out that the I-10/I-75 interchange was often a key junction during a hurricane evacuation, and that a camera positioned to view that interchange would be helpful for evacuation decision-making. Because no microwave towers were located at that interchange, a Statewide Monitoring System station was not deployed there. Instead, a station was deployed a few miles west of the interchange, with another deployed a few miles north of it (Figure 67). In effect, FDOT designed its Statewide Monitoring network around the locations of microwave towers. This resulted in significant cost savings that allowed FDOT to deploy more stations for the same cost compared to deploying stations at other locations that could not take advantage of the microwave communications. In retrospect, FDOT suggested that it would have been better to select locations for statewide traffic monitoring stations based primarily on their ability to support traffic management activities, using microwave tower infrastructure to reduce costs, when possible.
| Microwave tower locations should not be the primary factor in selecting locations for traffic monitoring stations. |
SMS Performance. Information on the performance of the microwave system is limited by the fact that FDOT experienced difficulties in maintaining the Statewide Monitoring System field equipment (see Section 8.3). FDOT reported that the microwave network itself was quite reliable, though it did note that communications were sometimes disrupted during severe thunderstorms.
8.3. Maintaining a Statewide Traffic Monitoring System
One challenge faced by designers of the Statewide Monitoring System was related to the maintenance of field devices distributed across the state-some of the stations were located more than 400 miles from the FDOT D5 offices in Deland. The cost of traveling to each site from Orlando made maintenance visits expensive. FDOT took this into consideration in the system design, deploying network-addressable Uninterruptible Power Supply (UPS) at each station so that equipment could be rebooted remotely. It was hoped that being able to reboot equipment remotely would reduce the need for expensive onsite maintenance.
| Travel costs can make the costs of maintaining a statewide traffic monitoring system high. |
After it was deployed, the system did not develop a regular set of users. FDOT had anticipated that the data from this system would be useful for traveler information and to support hurricane evacuation decision making. RTMC operators found that the stations were too widely spaced to consistently provide statewide traveler information (see Section 8.6 for more information). While the SEOC was very interested in using video from the Statewide Monitoring System during hurricane evacuations (see Section 8.5), SEOC's actual use of the video was irregular, only occurring during hurricane evacuations. The combination of high maintenance costs and no regular users meant that FDOT D5 placed a lower priority on maintaining this field equipment than the equipment that was less costly to maintain and used more frequently. The result was low availability of the Statewide Monitoring System, as reflected in FDOT's maintenance logs. Figure 68 depicts the average daily number of Statewide Monitoring System cameras and detectors working each week. The average length of time a device was inoperable was almost 50 days, much longer than for devices FDOT D5 maintained within its district.
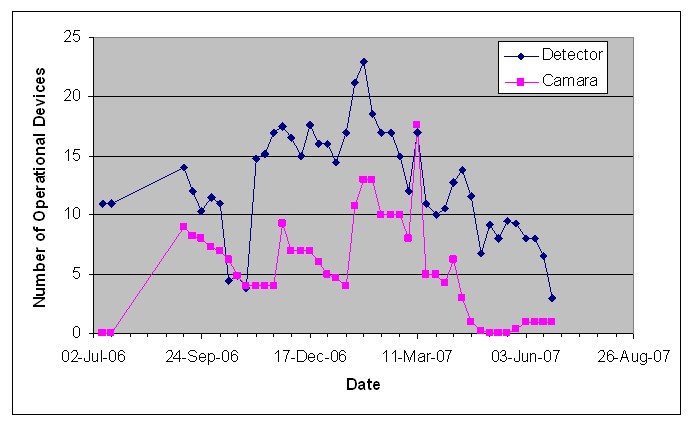
Figure 68. Statewide Monitoring System Operational Devices
FDOT believed that one cause of maintenance problems was the power supplies, noting that the power transformer was deployed in the equipment room and a 25 V line made a long run to the field equipment. FDOT also noted that the software it used to interface with the Statewide Monitoring System field equipment caused some of the problems it observed. At times, FDOT personnel could view video if they accessed the video controller directly, but could not view the video through the software the agency used to manage the video at the RMTC.
| Involving all other DOT districts in the design of a Statewide Monitoring System may make it easier to distribute maintenance responsibility for these stations across the districts. |
FDOT D5 also anticipated that the districts in which the Statewide Monitoring System equipment was located would take over responsibility for maintaining the equipment (each district was already responsible for maintaining the microwave tower equipment in its boundary). This did not occur during the iFlorida operational period. This may have been caused, in part, by the fact that the other FDOT districts were not involved in the design of the Statewide Monitoring System. FDOT D5 received push-back from some districts when deploying the Statewide Monitoring System equipment because the districts had not been given the opportunity to verify that the new equipment was compatible with existing equipment.
In August 2007, FDOT D5 took over maintenance responsibility for the Statewide Monitoring System (prior to that, the equipment was under warranty with maintenance performed by the vendor, who was contracted to deploy the equipment). At that time, FDOT D5 requested that the other FDOT districts take over maintenance of the equipment in their district. Districts that had an active ITS program were willing to take over this responsibility. Some districts had little or no ITS equipment deployed and no staff or maintenance contracts for maintaining ITS equipment. These districts were not interested in maintaining this equipment.
8.4. Interfacing Between the FHP CAD System and the D5 RTMC
A second source of statewide traffic-related information developed by iFlorida was an interface to the FHP CAD system. Prior to iFlorida, the FHP maintained a Web site that included selected incident information extracted from its CAD systems across the state.2 Because D5 RTMC activities prior to iFlorida were focused on I-4 and restricted to the Orlando area, this Web site was rarely used by RTMC operators. If an RTMC operator wanted information about an incident on I-4, the operator could request it from the co-located FHP CAD Troop D dispatchers.
With the advent of iFlorida and its statewide traveler information systems, the D5 RTMC had a need for statewide incident information and the iFlorida plans included developing an interface between the FHP CAD systems and CRS. (Section 5 provides a more complete description of this interface and FDOT's use of FHP CAD data.) The CRS presentation of data from this interface did not operate as expected: it did not effectively restrict incidents to those on roads included in the iFlorida statewide system and it sometimes placed on incident at an incorrect location. When the CRS failed to operate as expected, RTMC operators referred to the FHP Web site for statewide incident information, and used that information to populate the statewide 511 system and the statewide Web site with incident information.
| Interfacing with local police organizations to obtain more complete incident information may be a better source of statewide traveler information than a statewide monitoring system. |
Despite this limitation, FHP CAD incident information was the primary source of data used for statewide traveler information. The primary limitation noted by FDOT with regard to this incident information was that it was not complete-local police rather than FHP responded to incidents at some locations that were included in the iFlorida statewide traveler information system. This meant that FDOT might not be aware of incidents at some locations, so that the statewide traveler information was sometimes incomplete. FDOT did take steps to remedy this limitation. One creative step was to make 511 user feedback on unreported incidents available to RTMC operators. FDOT also began considering ways to work with other police jurisdictions to obtain incident information.
More information about the statewide traveler information system and data supporting it are in Section 10.
8.5. Using Statewide Data to Support Hurricane Evacuations
Emergency management in Florida, and evacuation management in particular, is managed primarily at the county (or regional) level, with the SEOC monitoring evacuation traffic and providing support as needed. For example, the emergency manager for each county makes the decision for issuing evacuation orders, the areas covered by the order, and when it takes effect (the Governor can over-ride these decisions, if necessary). Because most evacuation decisions are made by local emergency management personnel, the main use of statewide traffic data at the SEOC is for general situational awareness and for monitoring traffic conditions on evacuation routes.
Prior to iFlorida, the SEOC relied on three sources of information on statewide traffic conditions: reports from the FHP, reports from the individual counties during periodic statewide conference calls, and information from the TTMS network. The TTMS network, which did not provide real-time data during normal operations, could be activated to provide hourly traffic data from a limited number of sites during a hurricane evacuation. This data was made available via a public Web site, and the SEOC regularly consulted this Web site to assess traffic conditions on key evacuation routes.
The original design for the Statewide Monitoring System was to improve a number of TTMS stations by providing connectivity for real-time data and adding traffic video. Because iFlorida Statewide Monitoring stations were deployed at microwave tower locations, which did not coincide with TTMS station locations, the system was supplemental to the existing TTMS network. This meant that the traffic data from the Statewide Monitoring System was not integrated into the TTMS Web site, so was not used at the SEOC. The traffic video, on the other hand, was enthusiastically received at the SEOC. Paul Clark, the Traffic Incident Management Program Manager then TTMS video first became available at the SEOC, stated, "We believe (the iFlorida cameras) will be invaluable for this coming hurricane season." Network connectivity was provided to the SEOC in January 2006 so that staff could view video from any of the 25 iFlorida Statewide Monitoring cameras. The SEOC requested an upgrade to the bandwidth of this network connection to provide improved access to this video.
Because no significant hurricane evacuations occurred during the iFlorida operational period, direct observations of the impacts of the iFlorida statewide data on evacuation operations is unavailable. Section 9 of this report does provide more information on Florida evacuation operations and the expected impacts of iFlorida on those operations.
8.6. Using Statewide Data to Support Traveler Information
The original iFlorida plans called for statewide traveler information services to cover roads on the Florida Intrastate Highway System (FIHS), which includes about 4,000 miles of Florida Interstate highways, the Florida Turnpike, selected urban expressways, and major interregional and intercity arterial highways. Early in the iFlorida project, FDOT realized that the amount of traffic and incident information that would be available for many of these roads was extremely limited. FDOT decided to limit the statewide traveler information to ten major roads: I-4, I-10, I 75, I-95, the Florida Turnpike, SR-60, SR-70, SR-528, US-19, and US-27.
The main source of data to support the statewide traveler information was information from the FHP CAD system obtained from the FHP CAD Web site. FDOT also established processes in which the various FDOT districts would submit information about construction activities on roads that were covered by the statewide traveler information systems.
| A Statewide Monitoring System may be too sparse to consistently provide useful traveler information. |
The Statewide Monitoring System provided video and traffic data from the monitoring stations that were deployed. While the video from these stations was occasionally useful to confirm information about incidents that occurred within range of the video cameras, most incidents were not within camera range. The wide spacing between Statewide Monitoring System stations meant that the system was not very useful at supporting statewide traveler information services.
The FHP-CAD interface provided incident data from the FHP CAD system. The FHP-CAD data was the primary source of statewide traveler information. However, the CRS presentation of FHP-CAD data was not reliable, so was seldom used. Most operators chose to review FHP incident information through the public Web site interface provided by FHP. Because the FHP-CAD information was the main source of statewide traveler information, FDOT contracted in the summer of 2007 for the development of a new interface to the FHP-CAD data. This tool received data from the FHP-CAD system and provided a Web site that listed incidents associated with the roads included in FDOT's Statewide traveler information systems. It could also use Google maps to display the maps of the incident locations. D5 RTMC operators found that interface to the FHP data to be both reliable and useful, though some still preferred to access the FHP Web site directly (see Section 5 for more information on this interface).
| The FHP CAD was the primary source of statewide traveler information. |
FDOT staff suggested that, for the purpose of supporting statewide traveler information, some of the resources spent on the Statewide Monitoring System might have been better spent on developing interfaces to additional police CAD systems across the State.
8.7. Uses of Statewide Weather Data
The iFlorida system did provide weather data to RTMC operators. The operators did not find this weather data useful for supporting traveler information. More information on iFlorida weather data is available in Section 12.
8.8. The Condition Reporting System and Statewide Operations
The purpose of the CRS for supporting statewide operations was to manage incident information and assist with creating 511 messages that reflected these incidents. The primary sources of incident information for the CRS were the FHP CAD system and RTMC operator input. RTMC operators found the CRS manner of handling FHP CAD incident information difficult to use. The CRS did not effectively filter the FHP CAD incidents to only those that occurred on iFlorida roads. At one point, an RTMC operator was required to spend most of his time deleting FHP CAD incident information that was for incidents that did not occur on iFlorida roads. FDOT had expected the CRS to filter out these incidents automatically (see sections 2, 5, and 8.4 for more information). Thus, the CRS incident management features were not very useful with regard to statewide data. The CRS did provide tools that FDOT used to manage 511 messages. In May 2007, the CRS contractor discontinued development of the CRS and the CRS software failed. After the failure of the CRS, FDOT began migrating to SunGuide as its traffic management center software. By November 2007, FDOT was using SunGuide to manage 511 messages for the Statewide 511 system. See section 2 for more information on the CRS software and the migration to SunGuide.
8.9. Statewide Traveler Information
Despite the difficulties of obtaining information to populate the statewide 511 system and the limitations of the CRS in supporting statewide operations, FDOT D5 did create a successful statewide 511 system. When the CRS failed to successfully automate capabilities for maintaining statewide traveler information, RTMC operators used more manual methods to ensure that support for statewide traveler information continued. When available source of incident information sometimes left holes in coverage, FDOT used creative methods to fill those holes, such as providing 511 user comments to RTMC operators so they can correct 511 messages that may be in error. Over the period from November 2005 through August 2007, the statewide 511 system typically logged about 35,000 calls per month (see Figure 69).
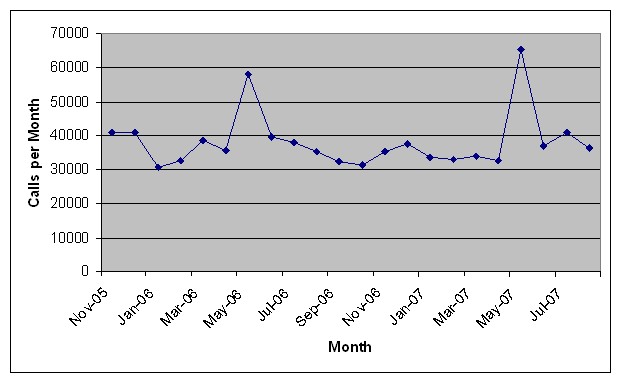
Figure 69. Statewide 511 Calls Per Month
More information on statewide traveler information can be found in Section 10.
8.10. Summary and Conclusions
The primary objectives of iFlorida Statewide Operations were to support statewide traveler information and hurricane evacuations, objectives that FDOT met despite having to overcome significant challenges to do so. When the CRS failed to meet expectations for managing incident information from the FHP CAD interface, FDOT worked around those limitations. With this support, the statewide 511 system serviced about 35,000 calls per month throughout the operational period. FDOT also provided access to Statewide Monitoring System traffic video to the SEOC, though this system was not used extensively because no significant hurricane evacuations occurred during the operational period.
While deploying and operating these statewide systems, FDOT did identify a number of lessons learned that it might use to improve future operations and that other locales may find useful. The following list summarizes these lessons learned.
- The Statewide Monitoring System demonstrated that using the pre-existing
microwave communication network was a cost-effective approach for providing
communications to remote traffic monitoring stations.
- One challenge was designing around the bandwidth limitations of the microwave network.
- FDOT noted that the network was reliable, except for some disruptions during bad weather.
- FDOT noted that using the locations of microwave towers as the primary factor in selecting sites for the Statewide Monitoring System may have been a mistake. A better system may have resulted from selecting sites primarily on the basis of the usefulness of the sites for supporting transportation decision making, and only taking advantage of microwave tower locations when consistent with those site selections.
- The cost of maintaining the Statewide Monitoring System was high, and
the demand for data generated by the Statewide Monitoring System was low.
- Because of this, FDOT focused its limited maintenance budget on field equipment that produced data for which demand was higher.
- The SEOC was very interested in using the traffic video provided by the Statewide Monitoring System during hurricane evacuations.
- FDOT found that the FHP CAD interface provided more useful data for supporting
statewide traveler information than that obtained from the Statewide Monitoring
System.
- FDOT suggested that, for the purpose of supporting statewide traveler information, the resources spent on the Statewide Monitoring System may have been better spent on interfacing with additional police CAD systems across the State.
1 Actual bandwidth requirements will vary, depending on the characteristics of the traffic video and the compression technology used.
2 This system is accessible to the public at http://www.fhp.state.fl.us/traffic/.