7. Implementing Variable Speed Limits
The initial plans for iFlorida called for the implementation of Variable Speed Limits (VSLs) on a 9-mile stretch of I-4 in central Orlando running from just west of Orange Blossom Trail to Maitland Boulevard. These plans called for the CRS to process weather and traffic data in order to recommend appropriate speed limits to RTMC operators, who would then select the speed limits to apply. These plans were not implemented due to inability of the CRS software to update sign messages reliably. FDOT did deploy VSL signs, however, and prepared plans for implementing VSL once the transition to the new TMC software was completed. This section of the report describes FDOT's experiences in preparing to implement VSL and its plans for doing so in the future.
7.1. Florida Speed Limit Statutory Requirements
At the time of the iFlorida Model Deployment, Florida statutes placed the following requirements1 on speed limits on Florida Interstate highways:
- FDOT could increase or decrease speed limits if an engineering and traffic investigation indicated that the existing speed limit was "greater or less than is reasonable or safe under the conditions found to exist." In that case, FDOT could declare a new speed limit that became effective as soon as appropriate signs were "erected" notifying drivers of the new speed limit.
- For limited access highways, the maximum allowable speed limit was 70 miles per hour.
- For non-limited access divided highways with at least four lanes outside of urban areas, the maximum allowable speed limit was 65 miles per hour.
- For other roads under FDOT's authority, the maximum allowable speed limit was 60 miles per hour.
- For "all highways that comprise a part of the National System of Interstate and Defense Highways and have not fewer than four lanes,"the minimum speed limit is 40 mph, or 50 mph if the posted speed limit is 70 mph.
| Identify statutory and regulatory speed limit requirements before considering the use of variable speed limits. |
The key requirement among these statutes relative to variable speed limits was that an engineering and traffic investigation was required before speed limits could be changed. To satisfy this requirement, FDOT conducted an engineering and traffic investigation that identified reasonable and safe speeds under different weather and traffic conditions. This investigation provided RTMC operators with the authority to change speed limits after verifying that the appropriate conditions existed without requiring a new engineering and traffic investigation for each event. Through the engineering investigation, FDOT noted that speeds on the portion of I-4 covered by the VSL signs regularly fell below the 40 mph minimum speed limit (see Figure 63 in section 7.4) and determined the speed limits as low as 30 mph should be applied under some conditions.
7.2. The iFlorida VSL System
The iFlorida VSL signs were deployed along a 9 mile portion of I-4 in Orlando, as shown in Figure 62. In this figure, the boxes on the left indicate the locations of loop detectors used to monitor traffic on this portion of I-4. These detectors report speed, volume, and occupancy for each travel lane at 30-second intervals. The boxes on the right indicate the location of the VSL signs, with the values in those boxes being the normal speed limit displayed by that sign.
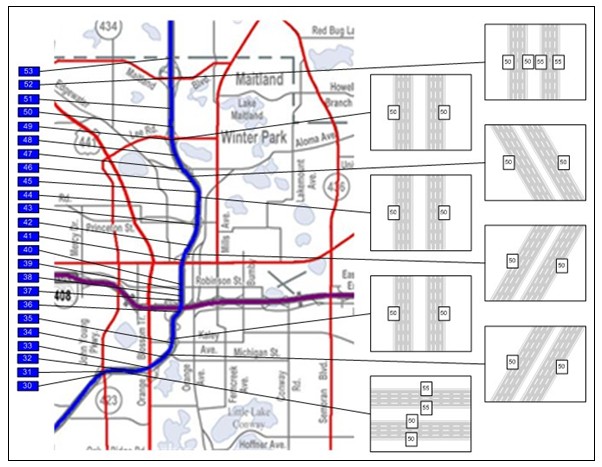
Figure 62. iFlorida VSL Signs
Two signs were deployed in each direction of travel at the beginning and end of the portion of I 4 covered by VSLs, with one sign in each direction in the interior portion of the trial segment. The normal speed limit in this region is 50 mph, with 55 mph speed limits beginning for eastbound traffic as it exits the area at Maitland Boulevard and for westbound traffic as it exits the area west of Orange Blossom Trail. FDOT noted that the exact location of the VSL signs should be identified after considering the patterns of recurring congestion in the area. FDOT suggested deploying signs before an interchange where congestion often begins so that speed limits can be lowered prior to vehicles entering the congested area. They also suggested deploying signs after an interchanges that serve as congestion relief points so that the speed limit can be increased immediately downstream of where the congestion typically ends.
7.3. iFlorida VSL Plans
During discussions with the evaluation team, FDOT noted that several reasons and circumstances exist for using variable speed limits:
- VSL might be used when prevailing conditions make the usual speed limit
unsafe.
- VSL might be used when weather conditions, such as "Florida ice"2 or fog, make driving conditions hazardous. Normal speed limits are set to be safe under usual driving conditions, although safe speeds may be lower than the normal speed limit during adverse weather conditions. Using VSL to reduce speed limits during adverse weather conditions could reduce the number of crashes that occur at those times.
- VSL might be used when high levels of congestion result in prevailing speeds that are lower than the normal speed limit. Prevailing speeds in a congested area are lower than the normal speed limit and drivers cannot safely drive the speed limit. Using VSL to reduce speed limits in congested areas would result in speed limits that were more consistent with current travel speeds and could result in less variability in vehicle speeds in congested areas.
- VSL might be used upstream from congested areas. Vehicles upstream from a congested area must reduce speed when they reach the congested area. Reducing speed limits upstream of the congested area will both warn drivers that traffic ahead is moving more slowly and help them make the transition to the lower speeds ahead. Using VSL to reduce speed limits upstream of congestion could reduce the number of crashes that occur as vehicles enter congestion-related queues.
- VSL might be used in work zones. Construction activities can make driving hazardous, and high speed traffic in a work zone can be a risk to workers. Reducing speed limits in work zones could reduce vehicle speeds in work zones, which could result in fewer work zone-related crashes and injuries.
- VSL might be used upstream of a congested area to reduce the number of vehicles entering the area, which could help clear congestion more quickly. FDOT determined that the 9-mile length of the planned VSL area was too short to provide any effective reduction in the number of vehicles entering the congested area. Also, Florida statute allowed changing speed limits due to safety concerns, not for traffic management.
- VSL might be used in a commonly congested area to encourage travelers to find alternate routes or alternate travel times. FDOT determined that the lower speeds already present in the VSL area during congested periods provided encouragement for travelers to find alternate routes. As noted above, Florida statute allowed changing speed limits due to safety concerns, not for traffic management.
In 2005, FDOT prepared a concept of operations document for using variable speed limits on I-4. This document noted that "The purpose of the VSL sign system is to facilitate the maintenance of safe driving conditions along the I-4 corridor (in both directions of travel) through the Orlando metropolitan area." This would be accomplished by reducing speed limits by 10 mph when any of the following five types of conditions occurred:
- Traffic incidents and work zone conditions. Traffic incidents
and work zones often result in traffic queues, and crashes could occur as
drivers approach the back of the queue. FDOT planned to reduce speed limits
for the portion of I-4 upstream from an incident or work zone. FDOT defined
three levels of response, depending on the severity of the road blockage
resulting from the incident or work zone:
- The lowest level of response would modify speed limits on the two closest VSL signs upstream from the incident and post a speed reduction message on the first upstream DMS. (If the incident was within ¼ mile of the first upstream VSL sign, modified speed limits would be posted on three upstream signs.) This response would apply to incidents that affected only one lane of travel.
- The next level of response would modify speed limits on the three closest VSL signs upstream from the incident and post a speed reduction message on the first two upstream DMSs. (If the incident was within ¼ mile of the first upstream VSL sign, modified speed limits would be posted on four upstream signs.) This response would apply to incidents that affected two lanes of travel.
- The highest level of response would modify speed limits on the four closest VSL signs upstream from the incident and post a speed reduction message on the first four upstream dynamic message signs. (If the incident was within ¼ mile of the first upstream VSL sign, modified speed limits would be posted on five upstream signs.) This response would apply to incidents that affected three lanes of travel.
- Non-incident recurring congestion. Congestion can result in
reduced traffic speeds and queuing that could be a risk for vehicles approaching
the congestion. During non-recurring congestion, FDOT planned on reducing
speed limits upstream from the location of the congestion based on the average
speed in the congested area.
- If the average speed in the congested area was less than, but within 10 mph of, the normal speed limit, the speed limit would be reduced within the congested area and at the two VSL signs upstream of the congestion.
- If the average speed in the congested area was between 10 and 20 mph below the normal speed limit, the speed limit would be reduced within the congested area and at the three VSL signs upstream of the congestion. The nearest DMS upstream would post information about the congestion.
- If the average speed in the congested area was more than 20 mph below the normal speed limit, the speed limit would be reduced within the congested area and at the four VSL signs upstream of the congestion. The nearest two DMSs upstream would post information about the congestion.
- Work zone-related recurring congestion. The same process would be used as described above for traffic incidents and work zone conditions.
- Extreme weather conditions. Extreme weather conditions can mean
that the usual speed limit is unsafe. It can also result in slower traffic,
which can be a hazard for vehicles approaching the portion of road affected
by the extreme weather. During extreme weather conditions, FDOT planned
on reducing speed limits within and upstream from the location of the extreme
weather.
- If there was moderate rainfall, windy conditions (25 to 35 mph), or visibility of about ½ mile, speed limits would be reduced within the affected area and at two signs upstream from that area. A notice of the reduced speed limits would be posted on one sign upstream from where the reduced speed limit takes affect.
- If there was heavy rainfall, windy conditions (35 to 50 mph), or visibility of between ¼ and ½ mile, speed limits would be reduced within the affected area and at three signs upstream from that area. A notice of the reduced speed limits would be posted on at least one sign upstream from where the reduced speed limit takes affect.
- If there are squall-like conditions, very windy conditions (more than 50 mph), or visibility of less than ¼ mile, speed limits would be reduced within the affected area and at five signs upstream from that area. A notice of the reduced speed limits would be posted on at least two signs upstream from where the reduced speed limit takes affect.
- Other nonrecurring traffic events. The same process would be used as described above for non-incident recurring congestion.
FDOT's plans called for the CRS, the traffic management software used at the RTMC, to ingest speed, weather, and incident data, analyze that data, and make recommendations regarding variable speed limits to RTMC operators. When the CRS made a recommendation to lower speed limits, the RTMC operator was to verify that the appropriate conditions existed for changing speed limits. After verifying the conditions, the operator was required to request supervisor approval to lower speed limits and, if approval was granted, the operator would post the lower speed limit.
During the period that speed limits were lowered, RTMC operators were required to periodically check that the VSL signs were displaying the correct speed limit and review traffic and weather conditions to determine whether the speed limits should be returned to normal. Supervisor approval was required before returning the speed limits to their normal values.
7.4. Assessing the Potential for VSL
Variable speed limits were considered appropriate for this section of I-4 because congestion often developed in this area and vehicle speeds were often below the posted speed limits. The typical congestion levels in this area are depicted in the figures below. Figure 63 depicts the average vehicle speeds measured at the detector stations in this area for the weekdays in October 2006, with averages calculated every 15 minutes. This figure indicates that vehicle speeds regularly dropped below the normal speed limit during both the morning and afternoon rush hour, particularly for eastbound traffic.
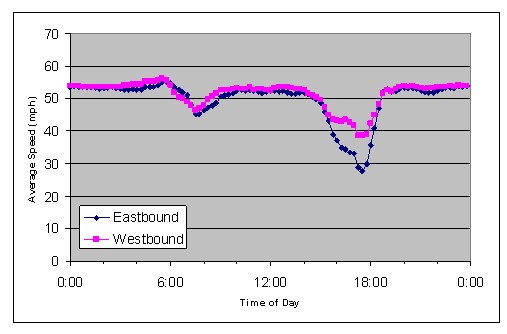
Figure 63. Average Speeds by Time of Day in the VSL Area, Weekdays
in October 2006
Figure 64 depicts similar vehicle speed data for weekend days. Note that there was little indication of congestion on weekends.
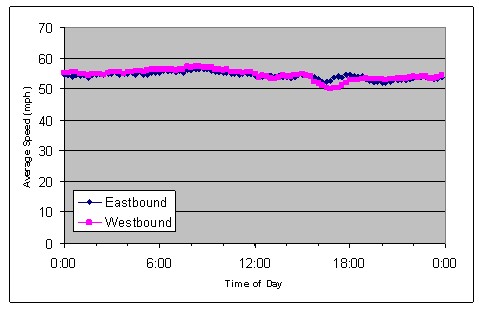
Figure 64. Average Speeds by Time of Day in the VSL Area, Weekends
in October 2006
The following congestion charts provide a more detailed view of I-4 congestion. Each chart depicts the degree of congestion at different times of day for a single direction of travel. The x-axis of each chart shows the time of day and the y-axis shows the detector station number. Because the detectors are arranged in milepoint order and are spaced at roughly half-mile intervals, the y-axis can be thought of as representing I-4 with the lowest numbered station representing a point west of Orlando near US 192 and the highest numbered station representing a point east of Orlando near SR 472. The VSL signs were deployed in the area between stations 31 and 52. For each station and each 5-minute period, a dot is placed if the average speed at the indicated station and time period was less than or equal to 40 mph. The shading of the dot is determined by the average speed with darker dots representing lower average speeds. A black dot indicates the average speed was below 20 mph, and a white dot with black outline indicates the average speed was between 35 and 40 mph, and shades of gray were used when the average speed was between these two ranges. No dot indicates either that the average speed was above 40 mph or that a detector was either not reporting data or was reporting data that was deemed unreliable (e.g., detectors 37 and 38 in Figure 65). Thus, an area where congestion occurred is represented in the chart by a cluster of dots, with darker dots indicating an area with more extensive congestion. Figure 65 below is a congestion chart for I-4 eastbound on Wednesday, October 4, 2006, and Figure 66 is a congestion chart for westbound traffic on the same day.
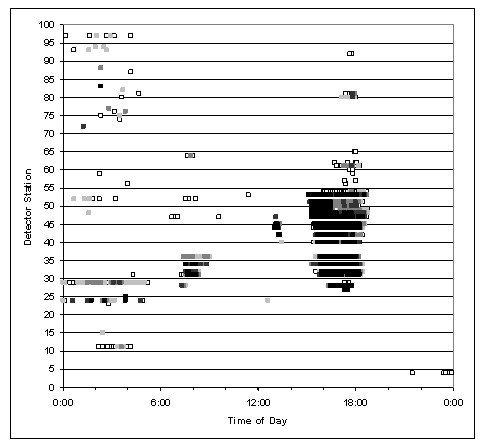
Figure 65. Congestion Chart for I-4 Eastbound on Wednesday, October
4, 2006
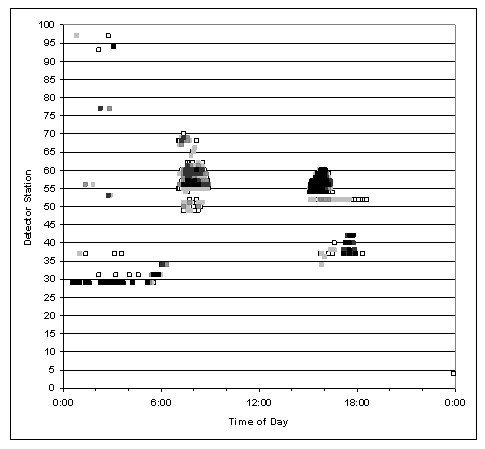
Figure 66. Congestion Chart for I-4 Westbound on Wednesday, October
4, 2006
These charts, while representing traffic for only a single day, are consistent with the average weekday traffic depicted in the earlier charts. Some localized congestion occurs in the eastbound direction in the morning, with more significant congestion occurring across the VSL area in the afternoon. Some mild congestion in the westbound congestion occurs in the morning, though this congestion occurs east of the VSL area. Consideration of these congestion charts led to several other observations related to the application of VSL in Orlando.
| The concept of operations for VSL should be validated against historical data. |
The algorithms for recommending speed limit changes should be able to detect and correct for low vehicle speed observations that are not related to congestion.
Note that these charts indicate the dynamics of recurring congestion on I-4. In the eastbound direction, congestion first appears in the afternoon for eastbound traffic around detector 34 (near Kaley Ave) and around detector 50 (east of Lee Road). (The left-most congestion indicators in the afternoon block of congestion are at these detectors.) From these two points, the congestion begins to migrate westward. FDOT felt that advanced speed limit signing would be most important during the transition from free flow to congestion. VSL signs were located upstream from these two locations to accommodate that. As the congestion grows, it may extend west beyond the point where VSL signs were deployed, in which case speed limits could not be lowered in advance of the congested area. These signs could be used to lower speed limits in the congested area so that the posted speed limits reflect current speeds.
The westbound congestion actually occurred east of the location of the VSL signs, so the area in which congestion was most likely to occur in the westbound direction was not covered by the VSL signs. The reason for this was not clear. The evaluation team did note that the VSL concept of operations was developed after the VSL sign locations were already determined and did not include an analysis of traffic patterns that result in the use of the VSL system.
Another observation is related to the occurrence of low travel speeds in the 5-minute averages depicted in these charts that do not appear to be related to congestion. Examples are detector 29 (low speeds prior to 6:00 a.m. in both directions of travel), detector 30 (observations omitted from charts because low speeds were recorded all day in both directions of travel), and detector 37 (low speeds sporadically throughout the day in the westbound direction). These low values could be due to faulty detectors or vehicles occasionally driving at low speeds. In either case, the system must include methods to prevent such anomalous readings from resulting in recommendations to lower speed limits. It might be appropriate to test the algorithms against historical data to fine-tune them before using them in a production system.
| Operator approval should be required for all speed limit changes. |
A key element of FDOT's approach to ensuring that speed limits would not be lowered inappropriately was to require operator approval of all speed limit changes before they were implemented. This approval process would allow RTMC operators to disregard suggested changes to speed limits that were not supported by their observations of traffic conditions. Thus, failures of the algorithms used to recommend speed limit changes would result in false recommendations that operators would disregard.
7.5. iFlorida VSL Activities
| A VSL system should not be deployed until the other systems required to support it are operating reliably. |
Because of problems with the CRS, iFlorida did not implement its VSL plans during the period of the national evaluation of iFlorida activities. The main problem that prevented implementation was that the CRS could not reliably update sign messages. The CRS also demonstrated problems with analyzing traffic and weather data that may have impacted its VSL recommendations. (See Section 2 for more information.) With FDOT focused on getting the CRS to reliably support basic traffic management capabilities, it chose to delay lower priority activities, such as VSL. This resulted in wasted resources-the costs of deploying the signs could have been delayed and the cost of maintaining them while displaying static speed limits could have been avoided. It also resulted in some negative press when a local newspaper noted that the signs were not being used and included an article in the newspaper titled Stuck on I-4? High-tech signs aren't doing their job.4
In the case of the iFlorida Model Deployment, FDOT scheduled the deployment of the VSL signs so they would be ready for use at the start of the planned iFlorida operational period-the schedule for the iFlorida Model Deployment provided 2 years for deployment and 2 years for operations. In order to meet this constraint, FDOT accepted the risk that problems with other parts of the deployment would prevent the use of the VSL signs. Other sites considering VSL, without similar constraints, should consider ensuring that all the support systems needed to support VSL operations (e.g., traffic measurement, sign management software, software tools to make speed limit recommendations) are working reliably before deploying VSL signs.
After the CRS failed in May 2007, FDOT began the process of replacing it with SunGuide software. By November 2007, SunGuide was able to access and analyze traffic data, including loop data on the section of I-4 covered by the VSL trial, and reliably update DMS messages. SunGuide also included tools for analyzing traffic conditions and, based on that analysis, recommending sign messages. As FDOT grew more confident in the reliability of SunGuide, it re-started the delayed VSL project.
In December 2007, FDOT began testing the ability of SunGuide to update VSL speed limit messages. FDOT also began testing whether the SunGuide tools could implement the logic required to automatically recommend speed limits to operators based on the criteria established in the engineering and traffic investigation conducted to support the VSL on I-4. Because the version of SunGuide in use at that time did not include weather data, it would not be able to implement the weather-related speed limit recommendations. Initial tests did indicate that it would be able to make appropriate speed limit recommendations to RTMC operators based on current traffic speeds and incidents.
In early 2008, FDOT began testing specific VSL algorithms. The first step was to examine the variability in observed occupancy and speed data to determine which would produce more reliable speed limit recommendations. FDOT also considered the period over which observations should be averaged. . (A very short averaging period could result in frequent changes to speed limit recommendations, particularly during the periods when congestion is building or dissipating. A very long averaging period could make the system slow to respond to changes in the level of congestion present.) Once this general review was performed, an algorithm as selected for making VSL recommendations and the VSL recommendations were compared against detector data and visual observations of traffic to determine the responsiveness and reasonableness of the recommendations. During this evaluation period, the VSL signs were covered so a full execution of the VSL system could be accomplished without displaying messages to the I-4 motorists.
7.6. Future Plans for Using VSL
At the time of this report, FDOT had completed initial testing with good results and was working on issues that needed to be resolved before full implementation. The following list describes the basic approach FDOT is taking:
- The area covered by the VSL signs will be divided into four sub-areas: eastbound south, eastbound north, westbound north, and westbound south.
- The SunGuide software will monitor the occupancy level and classify traffic conditions within each area as either free flow, light congestion, or heavy congestion.
- The SunGuide software will make speed limit recommendations for signs within each area based on these traffic condition classifications. Current plans call for recommending speed limits of 30 mph for heavy congestion, 40 mph for light congestion, and the normal speed limit (i.e., 50 or 55 mph) for free flow.
- The SunGuide software will also recommend lower speed limits when necessary to ensure that the posted speed limit does not change by more than 10 mph between two adjacent sets of VSL signs. (For example, the nearest signs upstream of an area with a posted speed limit of 30 mph due to heavy congestion would have a 40 mph posted speed limit, even if conditions there were free flow.)
FDOT will be able to adjust the operation of the system by adjusting a number of parameters in SunGuide. One set of parameters identifies the detector stations assigned to each sub-area, allowing FDOT to remove problematic detectors from the VSL calculations. Other parameters specify the threshold values used to assign traffic condition categories to each sub-area based on the observed occupancies and the number of seconds of detector data to use when making these assignments. A last set of parameters specifies the value of the posted speed limit that corresponds to each traffic condition category.
FDOT also identified a list of items needing resolution or completion before full implementation:
- If communication with the sign fails, then the sign should default to the posted speed limit. Some of the signs currently have this capability, but others need to be updated to provide this function. This function is necessary to prevent a reduced speed limit to continue to be posted after the congestion condition has passed if communication was lost during the period that the reduced speed limit was being implemented.
- Operator procedures need to be developed and training provided to operators to allow the operators to train on the full process of managing the VSL subsystem before the signs are uncovered. These procedures include a daily check of data quality from the detectors assigned to the VSL subsystem and the process for removing failed detectors from the VSL recommendation process.
- Brief the Florida Highway Patrol on the proposed operations of the signs and advise them that the signs will be posting a speed limit that best matches the flow of congested traffic. The intended purpose of the signs is to improve safety along I-4 through more steady flow during congested periods and to provide advance warning to drivers of slowing traffic ahead.
- Implement a public information plan just prior to full implementation of sign operation that explains that the VSL signs have the ability to both improve safety and reduce congestion.
- Add features to draw attention to VSL signs when speed limits are reduced. When FDOT first announced plans for VSL in Orlando, the initial response of the public was that the system was intended to be a speed trap, catching drivers speeding who were unaware of the lowered speed limit. FDOT combated this perception through a public relations campaign and also added flashing lights above the VSL signs that flash to indicate when speed limits are lowered.
In September 2008, FDOT completed these steps and began operating their VSL system. FDOT has begun gathering data on driver response to the variable speed limits and their impacts on safety and mobility and will prepare a report to FHWA on these impacts.
7.7. Summary and Conclusions
As part of the iFlorida Model Deployment, FDOT deployed the field hardware needed to support variable speed limits on a portion of I-4 and maintained a network of loop detectors on I-4 that could support determination of when reduced speed limits should be implemented. The agency developed a concept of operations for using VSL and included requirements for CRS, the District 5 (D5) RTMC software, to support VSL operations. When this software failed to operate as expected, FDOT delayed its VSL plans while it worked with the CRS contractor to repair that software. In May 2007, after 2 years of additional work, the CRS software still did not operate reliably and FDOT abandoned it. Thus, the iFlorida operational period ended without FDOT gaining direct experience operating a VSL system.
Even though FDOT's experiences did not result in an operational VSL system prior to the completion of this evaluation, they did bring to light a number of lessons learned that might benefit others considering VSL:
- Identify statutory and regulatory speed limit requirements before considering the use of variable speed limits. Statutory restrictions limit the applicability of VSL on I-4. The minimum speed limit of 40 mph, combined with the normal speed limits of 50 and 55 mph on I-4 in Orlando, meant that speed limits could be varied only over a small range. The requirement for an engineering and traffic investigation before speed limits could be changed was also problematic. FDOT determined that it could perform this type of investigation once to identify the types of traffic conditions that would warrant lower speed limits, and RTMC staff could then change speed limits after verifying that the specified conditions for lowering speed limits had been met.
- Develop the concept of operations for VSL before designing the VSL system and validate it against historical data. Because of the long lead time for deploying the iFlorida field equipment, FDOT contracted to deploy the VSL signs before completing the VSL concept of operations, specifying that the signs be deployed in the area where congestion most often occurred. The VSL concept of operations emphasized the benefits of lowering speed limits upstream from a congested area. A comparison of the VSL sign locations to historical patterns of recurring congestion indicated that the signs were located to cover the area upstream of the points where eastbound congestion typically began, though not the area upstream of the full extent of the congestion at its peak. The VSL signs appeared to be west of the area congestion typically occurred in the westbound direction. FDOT noted that the agency had discussed each of these issues prior to selecting the site for deploying the VSL signs; however, because these issues were not addressed in the concept of operations document, the basis for the VSL design was not documented.
- Ensure that the algorithms for recommending speed limit changes can detect and correct for low vehicle speed observations that are not related to congestion. A review of historical speed data identified a number of cases where low speed measurements did not appear to be related to congested conditions. In some cases, this appeared to be caused by a faulty detector (e.g., the detector consistently reported low speeds). In others, a single low value would be embedded in a series of otherwise normal values. In either case, the algorithms for recommending lower speed limits should include methods to detect and disregard low vehicle speed measurements that are not related to congestion. (In the case of iFlorida, the problems with the CRS made this very difficult or impossible to do.) Problematic detectors might also be taken offline until repaired, in which case the algorithms must be able to adapt to the fact that detectors may be taken offline. The robustness of those algorithms could be verified by applying them to historical data.
- Require operator approval of all speed limit changes. FDOT's design of the VSL system called for an automated system to monitor traffic and weather conditions and recommend lower speed limits when conditions appeared to warrant them. RTMC operators would be required to investigate traffic conditions and approve the recommendation only when warranted by current traffic conditions. Since any algorithm for recommending speed limits is likely to fail on occasion, this approach will prevent those failures from resulting in changing speed limits at inappropriate times.
- Deploy a VSL system only after the systems required to support it are mature and reliable. Because of its participation in the Model Deployment and the required milestones, FDOT had to deploy infrastructure and develop the operating system concurrently. This resulted in the deployment of VSL signs before the CRS software for supporting those signs had proven reliable. These signs remained set at the fixed speed limits when the initial version of the CRS software did not operate reliably and 2 years of additional work by the CRS contractor did not remedy the problems. Thus, FDOT had to bear the cost of deploying VSL signs without obtaining the benefit of using variable speed limits.
After the CRS software was abandoned, FDOT began working with a new contractor to migrate to a different traffic management application, SunGuide, for the RTMC. By August 2007, FDOT was using SunGuide at the RTMC. By November 2007, SunGuide supported most of FDOT's basic traffic management needs and FDOT's confidence in the system was growing. At about that time, FDOT elected to restart its delayed VSL project. In December 2007, FDOT reviewed the VSL concept of operations and began to develop a new approach for triggering speed limit changes. The agency also began testing the SunGuide capabilities to support VSL operations. As the national evaluation was ending, it appeared that FDOT's experience with VSL on I-4 was ready to begin.
1 Requirements listed are detailed in Title XXIII, Chapter 316, Section 316.187 of the 2007 Florida Statutes.
2 "Florida ice" occurs in the first minutes of rain when rain mixes with oil and other residues on the road to produce slick conditions.
3 The evaluation team recognizes that there is a potential contradiction in these plans. If speed limits are reduced by 10 mph, they can only return to within 5 mph of the normal speed limit if vehicles are exceeding the speed limit set by the VSL signs.
4 Orlando Sentinel, January 12, 2007.