6. Using Dynamic Message Signs for Traveler Information
To support their traveler information and traffic management objectives, FDOT deployed more than 100 DMSs. This section of the report describes FDOT's use of those signs.
6.1. The FDOT DMS Network
One collection of FDOT D5's DMSs was deployed along a 50-mile portion of I-4 running from SR 417 south of Orlando to I-95. Figure 51 depicts the locations of those signs in the Orlando area.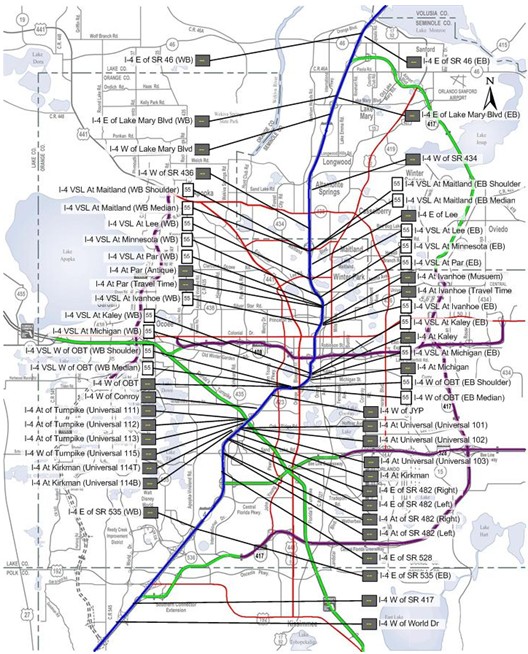
Figure 51. DMS on I-4 Near Orlando
Most of these signs were used for traffic information, displaying travel times by default and incident or congestion information when necessary. Two of this signs, one located south of the I-4 interchange with SR 417 south of Orlando (labeled "I-4 W of World Dr") and one located north of the I-4 interchange with SR 417 north of Orlando (labeled "I-4 E of SR 46 (WB)"), displayed travel times along two possible routes through Orlando, one along I-4 and one along SR 417. Twenty VSL signs were located in a section of I-4 from just east of US 441 (Orange Blossom Trail) to SR 414 (Maitland Boulevard). Eleven signs were used primarily to provide information about nearby local attractions. Many of these signs were present before the iFlorida deployment began, and the rest were in use by July 2005.
A second collection of DMSs were deployed along a 70-mile portion of I-95 from SR 509 in the south (near Belbourne Beach) to SR 40 in the north (about 5 miles north of Daytona Beach) and at a number of intersections on alternate routes near I-95 (see Figure 52).
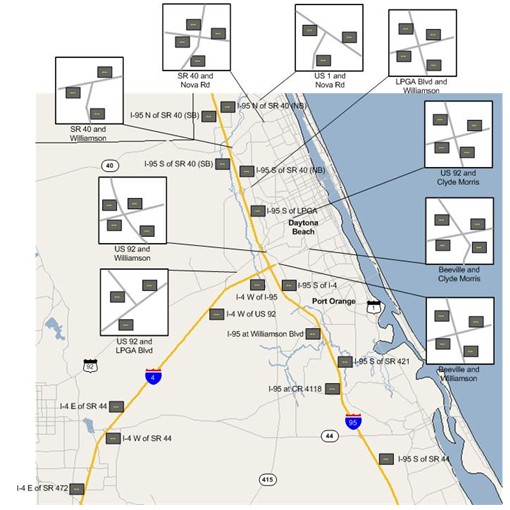
Figure 52. DMSs on I-95 Near Daytona Beach, Florida
The signs deployed along I-4 and I-95 were used primarily for traffic information. The signs on the nearby arterials were used to provide travel directions for travelers diverting off of I-4 and/or I-95 when a significant incident occurred on one of those highways. Additional signs were deployed at regular intervals along I-95 south of the area depicted in Figure 30. Few of these signs were available when the iFlorida Model Deployment began in 2003. Many of the highway signs were in place by 2005, with deployment of signs along I-95 continuing through 2007. Most of the arterial signs were connected to the sign management system in May and June of 2006.
When the iFlorida Model Deployment began, FDOT contracted to develop TMC management software called CRS, which included tools to help manage the messages on theses signs. (See section 2 for more information on this software.) For example, this software would ingest data from detectors on I-4, use that data to estimate I-4 travel times, and automatically post travel time messages to message signs. The system would also manage data about incidents and include tools for automatically generating messages when incidents occurred. The key features of this system were its ability to:
- Automatically generate travel time messages.
- Define manual messages with a pre-determined lifetime and alert the operator to retire or continue the message when the lifetime of the message ended.
- Define sign message plans that would be triggered when certain events occurred, automatically generate messages on appropriate signs during the lifetime of that event, and automatically retire messages when the event ended.
- Define default messages that would be displayed if no other message were available for a given sign.
- Prioritize messages, displaying the highest priority message at each point in time and, when the life of the highest priority message ended, automatically replace with the next priority message in the queue.
Unfortunately, the interface between the CRS and the message signs was not reliable. Operators reported that the CRS would sometimes fail to post a message when requested to do so, or would post it briefly before replacing it with a previously sent or lower priority message. At times, all of the message signs on the CRS operator interface would drop off the screen, only to reappear a few minutes later. When the signs disappeared from the interface, it sometimes affected the messages displayed on the signs.
When the first version of the CRS was released in November 2005, RTMC operators began using the basic sign management features of the CRS. They allowed it to automatically generate travel time messages and used it to manually post messages when an incident occurred. By the Spring of 2006, the above-mentioned problems forced FDOT to stop using CRS to post messages. Instead, FDOT disabled the signs within CRS and used a different software tool to manually post messages when an incident or significant congestion occurred. When there were no incident- or congestion-related messages to post, FDOT enabled the sign within the CRS and allowed the CRS to automatically post travel time messages.
| Validating all travel time estimates before using them for traveler information can prevent dissemination of false data and possible loss of public confidence in the traveler information systems. |
In addition to the problems with updating sign messages, FDOT also noted that the CRS miscalculated travel times. In the field, travel times were measured over relatively short stretches of road. On I-4 and I-95, travel speeds were measured by detectors placed at roughly half-mile intervals. These detectors were used to estimate the travel time for each such interval. On toll roads, OOCEA reported travel times for segments that averaged about 1 mile in length. The travel times reported on DMSs were often 10 miles in length or longer. (See Table 11 on page 90.) So, a single travel time reported on a DMS was the sum of travel times measured for small segments of road, and the CRS configuration data had to include information about which observed travel times should be summed to generate a travel time displayed on a DMS. A review of the CRS configuration data by FDOT in February 2006 indicated that errors existed in about two-thirds of the travel time segment definitions, and repeated tests by FDOT continued to identify travel time calculation errors for as long as the CRS was operational. This led OOCEA to suggest that all travel time estimates should be validated before being used for traveler information. OOCEA was concerned that the loss of public trust that might accompany dissemination of inaccurate travel times could result in a loss of public confidence in the travel time information, which would reduce the impact of that information on traveler behavior.
Throughout the most of 2006, FDOT continued to use the CRS to automatically post travel times. RTMC operators periodically reviewed the posted travel times and disabled signs when the posted times were inaccurate. In September 2006, FDOT quit this practice and disabled all message signs within CRS. From that time until June 2007, FDOT managed all sign messages manually. FDOT posted standard travel time messages that reflected free-flow travel times when there was little congestion present, changing to other types of messages when an incident or congestion occurred.
In June 2007, FDOT began transitioning away from CRS to SunGuide. As signs were added to SunGuide system, FDOT allowed SunGuide to post travel times automatically. The transition between manual and automated posting of travel time messages is reflected in Figure 53, which depicts the average length of time that a travel time message remained posted.
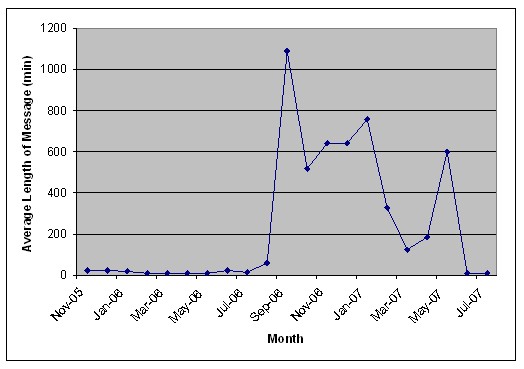
Figure 53. Average Length of iFlorida Travel Time Message
Note that the periods of automated travel time messages (November 2005 through August 2006 and June 2007 forward) are marked by relatively frequent changes in the travel time messages, so that the average length of the messages is very short. Manually updated travel time messages changed infrequently, so that the average length of the messages was long.
The remainder of this section provides more details on FDOT's use of its network of message signs.
6.2. Uses for the FDOT D5 Message Sign Network
Most of the message signs used by FDOT could be organized into categories according to how they were typically used. Some signs were used primarily to provide travel time information, though the travel time messages would be replaced with other types of messages (e.g., incident information, Amber Alerts) when situations warranted it. Others were used primarily to provide information about local attractions or to provide detour information when traffic was diverted off the highway.
The following sections describe FDOT's usage of their message signs, organized by these categories. Many of the results presented rely on analysis of sign messages that FDOT archived from July 2005 to July 2007. This archive included most signs during this period, but excluded signs once they were fully integrated into SunGuide. For example, FDOT used the signs along I-95 and on nearby arterials for testing SunGuide well before it began officially using SunGuide in 2007. Information about those signs was excluded from this archive. Information about the archive and how the evaluation team analyzed it is presented in Appendix B.
6.2.1. Signs Used for Travel Time Messages
The largest category of message signs was for those signs used primarily for travel time messages. By default, these signs displayed travel time messages, which were replaced with higher priority messages when warranted (e.g., a crash occurred or congestion appeared downstream from the sign). Table 10 lists the message signs that were used primarily for travel time information, along with the first and last months for which the archived sign data indicated that a travel time message was posted on each sign.
| Road | MP | Name | Direction | Period |
|---|---|---|---|---|
| I-4 | 62.8 | I-4 West of SR 417 | Eastbound | 05/06 to 07/07 |
| I-4 | 69 | I-4 East of SR 535 (Eastbound) | Eastbound | 11/05 to 07/07 |
| I-4 | 69 | I-4 East of SR 535 (Westbound) | Westbound | 11/05 to 07/07 |
| I-4 | 72.6 | I-4 East of SR 528 | Eastbound | 11/05 to 07/07 |
| I-4 | 77.7 | I-4 West of Conroy Road | Westbound | 11/05 to 07/07 |
| I-4 | 78.5 | I-4 West of John Young Parkway | Eastbound | 11/05 to 07/07 |
| I-4 | 79.2 | I-4 West of OBT | Westbound | 09/06 to 07/07 |
| I-4 | 81 | I-4 At Michigan Ave | Eastbound | 02/06 to 07/07 |
| I-4 | 81.5 | I-4 At Kaley Ave | Westbound | 11/05 to 07/07 |
| I-4 | 84.5 | I-4 At Ivanhoe (Travel Time) | Eastbound | 11/05 to 06/07 |
| I-4 | 86 | I-4 At Par Ave (Travel Time) | Westbound | 11/05 to 07/07 |
| I-4 | 89 | I-4 East of Lee Rd | Eastbound | 03/06 to 07/07 |
| I-4 | 91 | I-4 West of SR 436 | Westbound | 11/05 to 07/07 |
| I-4 | 93 | I-4 West of SR 434 | Eastbound | 08/05 to 06/07 |
| I-4 | 97 | I-4 West of Lake Mary Blvd | Westbound | 03/06 to 07/07 |
| I-4 | 99.2 | I-4 East of Lake Mary Blvd (Westbound) | Westbound | 10/05 to 07/07 |
| I-4 | 99.3 | I-4 East of Lake Mary Blvd (Eastbound) | Eastbound | 11/05 to 07/07 |
| I-4 | 104.3 | I-4 East of SR 46 (Eastbound) | Eastbound | 11/05 to 07/07 |
| I-4 | 107.5 | I-4 At The Causeway | Eastbound | 11/05 to 07/07 |
| I-4 | 109.9 | I-4 At Enterprise Rd | Westbound | 11/05 to 07/07 |
| I-4 | 114.6 | I-4 East of SR 472 | Westbound | 12/05 to 07/07 |
Two other signs on I-4 ("I-4 West of World Dr" and "I-4 East of SR 46 (Westbound)") were also used predominately for travel time information, but were classified as diversion signs because they were also used to provide diversion information (see section 6.2.2.). Four signs on I-95 were also used for travel time information (see Table 11), though travel times were only available on these signs part of the time because FDOT was still developing the I-95 travel time data collection system. Other signs on I 95 were used to display travel time information, but archives of the sign messages for those signs were not available.
| Road | MP | Name | Direction | Period |
|---|---|---|---|---|
| I-95 | 199.4 | I-95 North of SR 519 | Northbound | 01/06 to 04/07 |
| I-95 | 203.2 | I-95 North of SR 524 (Southbound) | Southbound | 01/06 to 04/07 |
| I-95 | 203.9 | I-95 North of SR 524 (Northbound) | Northbound | 01/06 to 04/07 |
| I-95 | 207 | I-95 North of SR 528 | Southbound | 01/06 to 07/07 |
For each travel time sign, either one or two locations were selected and travel times were posted for the estimated time to drive from the location of the sign to each of those selected locations. Table 12 lists the locations used for the iFlorida travel time signs and the distance to those locations.
| Road | Sign Name | Location To (Distance To) |
|---|---|---|
| I-4 | I-4 West of SR 417 | SR 528 (10 miles) / SR 91 (15 miles) |
| I-4 | I-4 East of SR 535 (Eastbound) | SR 91 (8 miles) / SR 50 (14 miles) |
| I-4 | I-4 East of SR 535 (Westbound) | US 27 (13 miles) |
| I-4 | I-4 East of SR 528 | SR 50 (10 miles) / SR 436 (19 miles) |
| I-4 | I-4 West of Conroy Road | SR 528 (5 miles) / US 192 (13 miles) |
| I-4 | I-4 West of John Young Parkway | SR 50 (5 miles) / SR 423 (9 miles) |
| I-4 | I-4 West of OBT | SR 91 (3 miles) / SR 528 (7 miles) SR 528 (8 miles) / US 192 (14 miles) |
| I-4 | I-4 At Michigan Ave | SR 436 (10 miles) / Lake Mary Blvd (16 miles) |
| I-4 | I-4 At Kaley Ave | SR 91 (4 miles) / SR 528 (7 miles) |
| I-4 | I-4 At Ivanhoe (Travel Time) | SR 436 (7 miles) / Lake Mary (13 miles) |
| I-4 | I-4 At Par Ave (Travel Time) | SR 91 (9 miles) / SR 528 (14 miles) |
| I-4 | I-4 East of Lee Rd | Lake Mary (10 miles) / SJR Bridge (16 miles) |
| I-4 | I-4 West of SR 436 | SR 50 (6 miles) / SR 91 (13 miles) |
| I-4 | I-4 West of SR 434 | Lake Mary (5 miles) / SJR Bridge (11 miles) |
| I-4 | I-4 West of Lake Mary Blvd | SR 50 (11 miles) / SR 91 (18 miles) |
| I-4 | I-4 East of Lake Mary Blvd (WB) | SR 436 (7 miles) / SR 50 (15 miles) |
| I-4 | I-4 East of Lake Mary Blvd (EB) | Saxon Blvd (12 miles) / I-95 (33 miles) |
| I-4 | I-4 East of SR 46 (Eastbound) | Saxon Blvd (8 miles) / I-95 (32 miles) |
| I-4 | I-4 At The Causeway | SR 44 (12 miles) / I-95 (26 miles) |
| I-4 | I-4 At Enterprise Rd | SR 417 (7 miles) / SR 50 (24 miles) |
| I-4 | I-4 East of SR 472 | SR 417 (14 miles) / SR 50 (31 miles) |
The travel time messages posted on these signs included three pieces of information: the location to which the travel time referred, the distance to that location, and the travel time to that location. (Prior to the start of the iFlorida Model Deployment, FDOT reported travel times to the public in the form of travel delays, using messages with a format similar to "To SR 417, 15 Min Delay".) Although 54 different formats for travel time messages were identified, most of the messages (about 97 percent of travel time messages) were minor variations of the following two formats.
- TO {Location To} / {Distance To} / {Travel Time From}{Next Phrase} / TO {Location To} / {Distance To} / {Travel Time From}
- TO {Location To} / {Distance To} / {Travel Time From}
While these signs were used primarily for travel time messages, other messages were used at times. When travel times were unavailable, the signs were either blank or contained a traffic-related advertisement (e.g., "For Travel Information Dial 511"). When an incident or significant congestion occurred, the travel time message was replaced by an incident or congestion message. Incident and congestion messages included much more variability in their content than did travel time messages.
More than 800 different formats were identified for congestion messages, with each message including some combination of the following types of information:
- A key phrase (e.g., "Congestion Ahead") indicating that the message was about congestion.
- Distance to the start of the congestion or, if the sign location was in the congested areas, distance to the end of the congestion.
- Name of location at which the congestion starts, if applicable, and name of the location at which the congestion ends.
- The expected delay caused by the congestion.
More than 1,100 different formats were identified for crashes, with another 122 formats for other types of incidents (e.g., heavy fog). These messages typically included some combination of the following types of information:
- A key phrase (e.g., "Crash Ahead") identifying the type of incident.
- Distance to the incident.
- Number of lanes blocked.
- A congestion message (see above) providing information about congestion induced by the incident.
Because the messages were entered manually by RTMC operators, variation existed in the messages that were used. For example, some operators tended to use the word "incident" to indicate a crash, while most used the word "accident". Other characteristics of the messages evolved over time. For example, congestion delay was usually expressed as a unique number of minutes in 2005, but almost always expressed as a range of possible minutes in 2007. Also, messages tended to include more details in 2007 than they did in 2005. Figure 54 depicts the fraction of time that these signs were displaying different types of messages.
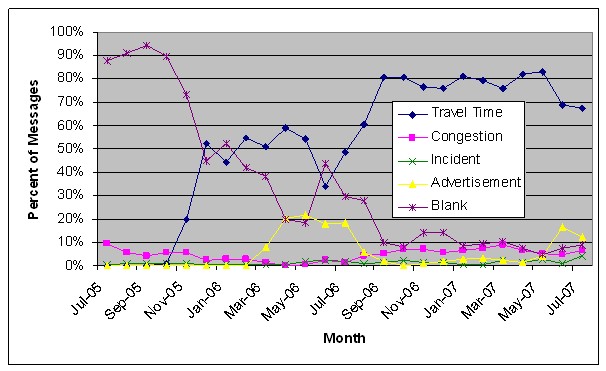
Figure 54. Type of Messages on iFlorida Travel Time Signs
Consider, for example, the messages displayed on the I-4 west of the John Young Parkway sign on October 26, 2006. On this day, typical levels of congestion occurred during the morning and afternoon, as depicted in the congestion chart in Figure 55. (The I-4 west of the John Young Parkway sign is located near detector station 29 in this chart.)
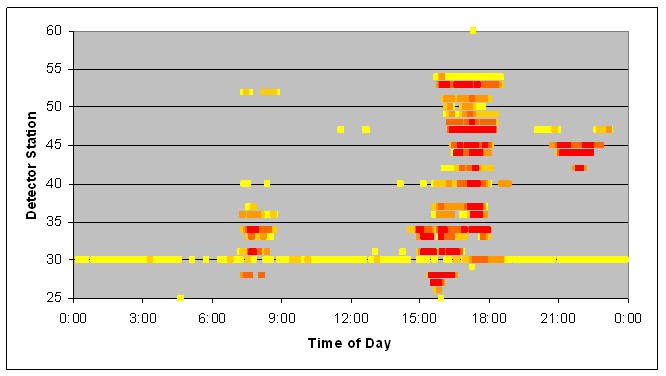
Figure 55. Congestion Chart for I-4 Eastbound Traffic on October 26, 2006
In addition, a crash occurred at about 3:15 p.m. near detector station 36. The following list describes the messages used on this sign on that day.
- While traffic was light, a standard travel time message was displayed. From midnight until 7:23 a.m., the message "To SR 50 / 5 Miles / 5 Min / To Lee Rd / 9 Miles / 10 Min" was displayed. (Because the CRS software was not working reliably, FDOT was manually posting standard travel time messages rather than using automated travel time messages.)
- When congestion began to build, operators began using congestion messages. From 7:23 a.m. until 8:25 a.m., the message "Congestion / Next 5 Miles / 15-20 Min / Congestion / Clears At / Anderson St" was displayed. From 8:25 a.m. until 8:36 a.m., the message "Congestion / Ahead 2 Miles / 10-15 Min / Congestion / John Young / To Anderson" was displayed. From 8:36 a.m. until 8:55 a.m., the message "Congestion / Ahead 3 Miles / 10-15 Min / Congestion / US 441/OBT / To Anderson" was displayed.
- At the end of the morning rush hour, the standard travel time message was used. From 8:55 a.m. until 3:13 p.m., the message "To SR 50 / 5 Miles / 5 Min / To Lee Rd / 9 Miles / 10 Min" was displayed.
- When a crash occurred, crash messages were displayed until the crash was cleared. From 3:13 p.m. until 3:36 p.m., three slight variations of the message "Accident / Ahead 3.5 Miles / Left Ln Blkd / Congestion / Ahead 3 Miles / 3-5 Min" were displayed.
- When the crash cleared, afternoon congestion was starting to build and congestion messages were displayed until 6:12 p.m., with the content of the message changing frequently as congestion built up and then dissipated.
- At 3:36 p.m., the message "Congestion / Next 3 Miles / 5-10 Min / Congestion / Clears At / US441/OBT" was displayed.
- From 3:37 p.m. until 3:54 p.m., the message "Congestion / Next 3 Miles / 10-15 Min / Congestion / Clears At / US441/OBT" was displayed.
- From 3:54 p.m. until 4:14 p.m., the message "Congestion / Next 5 Miles / 10-15 Min / Congestion / Clears At / Anderson St" was displayed
- From 4:14 p.m. until 4:17 p.m., the message "Congestion / Next 7.5 Miles / 15-20 Min / Congestion / Clears At / Ivanhoe Blvd" was displayed.
- From 4:17 p.m. until 4:35 p.m., the message "Congestion / Next 13.5 Miles / 35-40 Min / Congestion / Clears / W of SR 436" was displayed.
- From 4:35 p.m. until 4:42 p.m., the message "Congestion / Ahead 3 Miles / 35-40 Min / Congestion / OBT/US 441 To / W of SR 436" was displayed.
- From 4:42 p.m. until 4:58 p.m., the message "Congestion / Ahead 1.5 Miles / 35-40 Min / Congestion / John Young Pkwy / To W of SR 436" was displayed.
- From 4:58 p.m. until 6:12 p.m., the message "Congestion / Ahead 3 Miles / 35-40 Min / Congestion / OBT/US 441 To / W of SR 436" was displayed.
- From 6:12 p.m. until 6:41 p.m., the sign was blank.
- From 6:41 p.m. until 7:18 p.m., the standard travel time message "To SR 50 / 5 Miles / 5 Min / To Lee Rd / 9 Miles / 10 Min" was displayed.
- From 7:18 p.m. until 8:39 p.m., the sign was blank.
- From 8:39 p.m. until midnight, the standard travel time message "To SR 50 / 5 Miles / 5 Min / To Lee Rd / 9 Miles / 10 Min" was displayed.
The general approach exemplified by this sequence of messages was typical of how the travel time signs were used. Travel time messages were used by default, but were replaced with a congestion message when travel times increased. When an incident occurred, an incident message would be used instead.
| Ensure that the TMC software supports automated generation of common types of messages, such as congestion messages. |
It is worth noting that FDOT preferred to use congestion messages rather than travel time messages when travel times increased. The advantages of a congestion message are that it alerts travelers that traffic conditions worsen ahead and provides more detail than travel time messages about the exact location of the congestion. This meant that travel time messages were used during the times of day where travel times were most likely to be static, and congestion messages were used during the times of day when the messages were likely to change frequently. Because neither the CRS nor SunGuide requirements included specification for tools to automatically generate congestion messages, RTMC operators were required to generate and update these messages manually.
Thus, the CRS was designed to produce the types of messages (travel time messages) that were used predominately during the times of day when static messages would suffice. It was not designed to produce the types of messages (congestion messages) that were used during the times of day when the messages changed frequently. Designers of similar systems may want to clearly define DMS message policies and review those policies to identify which messages are used most often and change frequently before determining the types of messages that will be automated.
| Design the TMC management software to automatically produce the types of messages that are used often and change frequently. |
The biggest challenge FDOT faced with respect to the travel time signs was reliably producing travel time estimates. FDOT relied primarily on two types of technologies for producing travel time estimates. On I-4 and I-95, the agency used loop and radar detectors to collect speed data, and used the speed data to estimate travel times. On toll roads and arterials, FDOT primarily used toll tag readers and estimated travel times by comparing time stamps for vehicles that passed by two successive toll tag readers. In a few cases, they used license plate recognition rather than toll tag readers.
| The software used to manage travel time messages on DMSs should include methods for managing sign messages when travel times are unavailable. |
In the summer of 2005, the startup of the iFlorida operational period was delayed because a large number of arterial toll tag readers were out of service, so that arterial travel times were unavailable. At that time, FDOT struggled to establish a process to quickly identify and repair failed readers. Even after 2 years of experience with these toll tag readers, failures were still common. For example, travel time estimates for arterial and toll travel time segments were available only about 60 percent of the time during the period from March 1, 2007, through May 21, 2007 (see Figure 56).
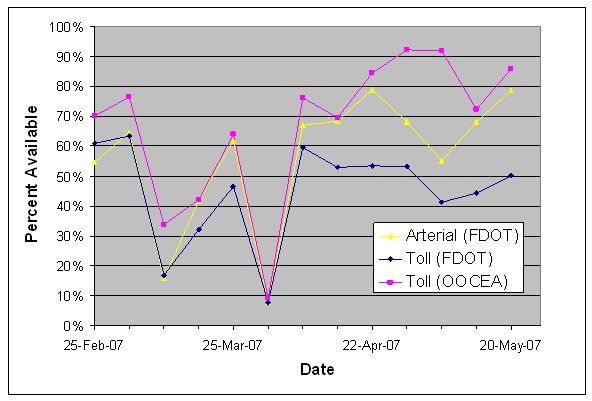
Figure 56. Reliability of Travel Time Estimates from Toll Tag Readers
The speed estimates from the I-4 and I-95 detectors were more often available than the travel time estimates from the toll tag readers, but still were unavailable a significant fraction of the time, as shown in Figure 57.
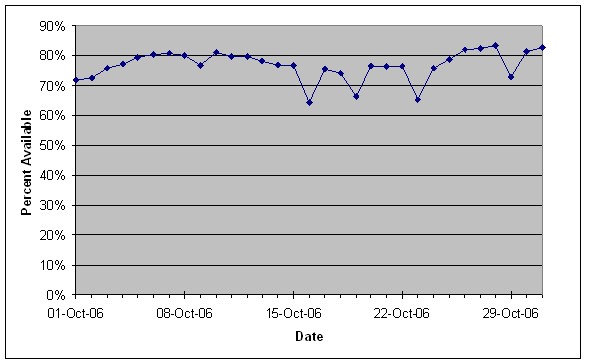
Figure 57. Reliability of Speed Estimates from Loop and Radar Detectors
With the CRS, FDOT was able to manually post travel time messages manually if observations were not available. However, the CRS did not alert RTMC operators to the fact that data was missing, so signs could remain blank for some time before operators detected that fact. It is interesting to note that both prior to the CRS becoming operational in November 2005 and after FDOT abandoned using it to maintain sign messages in September 2006, RTMC operators regularly maintained congestion information on these signs during peak travel periods without the help of automated tools for doing so. The RTMC operators were also skilled at estimating travel times based on traffic surveillance video and often used this approach rather than considering loop speed measurements when automated travel time estimates were unavailable.
6.2.2. Signs Used for Diversion Messages
Two signs were used to display travel time information for two alternate routes, one along I-4 through downtown Orlando and one along the SR 417 toll road that bypasses downtown Orlando. The route along I-4 was shorter-about 42 miles long-but was often congested and could have longer travel times. The route along SR 417 was longer-about 57 miles long-but was seldom congested and could have shorter travel times when I-4 was congested.
The system was intended to display a diversion message only when the travel time on I-4 was larger than that on SR 417 by at least 10 minutes, indicating that diverting onto SR 417 would save time. The I-4 west of World Dr. sign, located west of the I-4 / SR 417 interchange west of Orlando, was used for diversion information for travelers heading east on I-4. The I-4 east of SR 46 (westbound) sign, located east of the I-4 / SR 417 interchange east of Orlando, was used for diversion information for travelers heading west on I-4.
Figure 58 depicts the fraction of time these signs were devoted to different types of messages, including diversion messages.
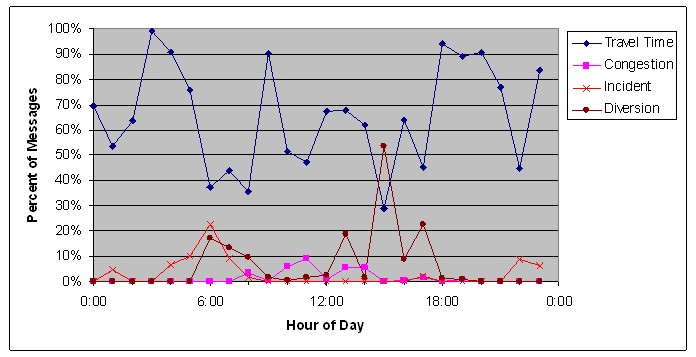
Figure 58. Messages of iFlorida Diversion Signs
As would be expected, the diversion messages occurred primarily during the morning and evening rush hours. Figure 59 depicts the percent of diversion entries with different travel times on the I-4 west of the World Dr. sign.
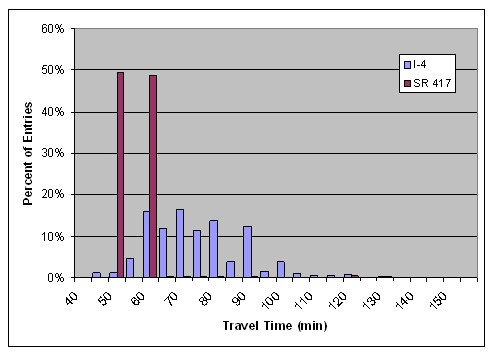
Figure 59. Average Diversion Travel Times on the I-4 West of World Dr. Sign
Note that almost all of the travel times along SR 417 were either 50 or 60 minutes, whereas the I 4 travel time ranges from 45 to 120 minutes. Figure 60 is a similar chart for the I-4 east of SR 46 (westbound) sign.
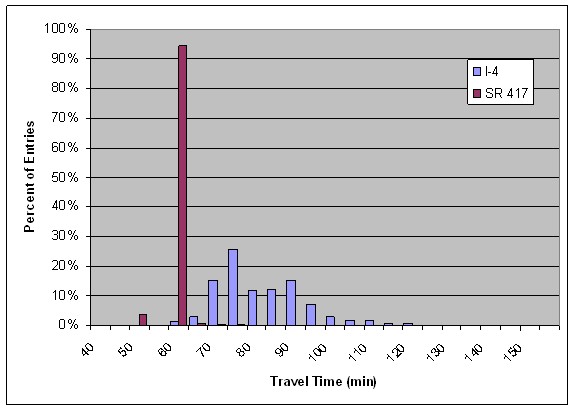
Figure 60. Average Diversion Travel Times on the I-4 East of SR 46 (Westbound) Sign
As with the I-4 west of World Dr. sign, the SR 417 travel times showed little variation while the I-4 travel times showed broad variation.
6.2.3. Signs Used at Arterial Intersections
One of the unusual features of the network of FDOT D5 message signs was the extensive collection of trailblazer signs deployed at key arterial intersections located along I-4 and I-95 near the I-4 / I-95 interchange. These signs were used primarily to direct traffic that either had detoured off one of the nearby Interstate highways due to an incident or was traveling to or from the Daytona International Speedway during a race weekend.
An example of the usefulness of these signs occurred on February 19, 2007. A man was shot and killed at about 9:30 p.m. on I-4 westbound as people were leaving the Daytona 500 race at the Daytona International Speedway. During the investigation, traffic in both directions on I-4 was blocked, eliminating the primary exit route westbound from the Speedway. The presence of these signs allowed FDOT to identify diversion routes and post information on the arterial signs to redirect travelers along the diversion routes. After the event, the Daytona International Speedway reported to FDOT that they received numerous compliments on the usefulness of these signs from race attendees.
Further support for the value of diversion signs came from a survey of Central Florida freeways users conducted in March 2005.1 When asked to specify two types of new traveler information they would like to receive, 68 percent of respondents listed "information about alternate routes" as one of their two choices. The next most frequently listed item, "travel information Web site," was listed by only 12 percent of respondents.
6.2.4. Other Types of Signs
FDOT managed messages on several other types of signs in the Orlando area. One set of five signs was used to suggest an appropriate exit number to take to reach the Universal theme parks. These signs included variable content that could be changed to different exit numbers and static content indicating that the listed exit number should be taken to reach the theme parks. FDOT had the ability to change the exit numbers on these signs in response to traffic on the nearby arterials, although these exit numbers were seldom changed in practice.
Another two signs identified nearby attractions, such as the Mennello Museum of American Art, the Antique District, Leu Gardens, the Shakespeare Center, etc. Twenty-two signs were designated for displaying variable speed limits, though these signs displayed static speed limits throughout the iFlorida evaluation period. (See Section 7 for more information on the variable speed limit signs.)
6.3. The Reliability of the FDOT Sign Network
In general, the FDOT roadside signs proved fairly reliable, as depicted in Figure 61. In this figure, sign reliability is reported as the average percent of days during each month that a sign was listed in FDOT's maintenance logs as requiring maintenance. Prior to the iFlorida deployment, about 90 percent of the forty-four FDOT DMSs were operational. Throughout most of 2005 and 2006, when FDOT was experiencing significant problems with other aspects of the iFlorida deployment, this percentage dropped down to about 70 percent. By early 2007, after FDOT abandoned the use of the CRS to manage sign messages, the reliability of these signs returned to pre-iFlorida levels, even as the number of signs increased from 44 to 60.
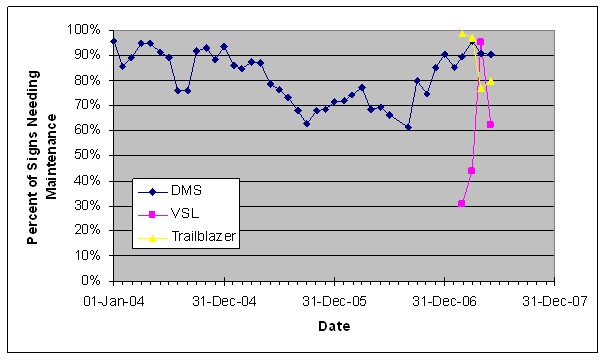
Figure 61. Percent of FDOT Signs Requiring Maintenance
Too little data is available to make statements regarding the reliability of the VSL and trailblazer signs.
6.4. Summary and Conclusions
At the start of the iFlorida Model Deployment, FDOT managed about 45 DMSs deployed along I-4 and used for several different purposes. Most signs were used to display delay and incident information, with a small number of sign used to display information about local attractions. During the iFlorida deployment and operational period, the number of these signs increased to 60. In addition, 20 VSL signs were deployed as part of iFlorida and a number of trailblazer signs were deployed at arterial intersections near the I-4 and I-95 interchange. These signs operated reliably, with about 90 percent of the signs operational, on average. This percentage was significantly lower during the midst of the iFlorida deployment when the CRS software was experiencing difficulties interfacing with the signs and FDOT resources were focused on correcting other problems with the iFlorida deployment.
A number of lessons learned were identified by observing sign operations during the evaluation. These lessons are contained in the following list:
- Travel time estimates should be validated before being used for traveler information. The CRS software miscalculated travel times that were used for DMS messages, resulting in inaccurate travel times being displayed to the public. One iFlorida stakeholder suggested that the process used to produce travel times for DMS messages should be thoroughly validated before being used in the field.
- Software for automating DMS messages should focus on the types of messages that are used often and change frequently. The CRS software included tools to generate travel time DMS messages automatically. FDOT operational policies for these signs meant that congestion messages were used most often during high traffic periods-exactly the time when sign messages changed frequently (because of changes in travel times). This required RTMC operators to manage congestion sign messages manually during rush hour periods while travel time messages, used when congestion was not present, were generated automatically. The workload on RTMC operators might have been reduced if congestion messages were automated rather than travel time messages.
- Tools for automatically generating travel times should include methods for managing sign messages when automated travel times are unavailable. FDOT experienced significant reliability problems with their travel time network, so that travel time estimates were often unavailable. Although the CRS software was intended to include tools to estimate travel times based on historical values, these tools were not used. When the CRS failed, FDOT discovered that (a) static historical travel times worked well for most of the day and (b) RTMC operators could update signs manually to reflect current travel conditions when congestion occurred, although they made these updates by circumventing the CRS software.
1 iFlorida Evaluation Telephone Survey, prepared for FDOT in March 2005.