11. Weather Data
One of the features of the iFlorida deployment was the integration of weather data into the traffic management system at the District 5 Regional Transportation Management Center (D5 RTMC). This weather data was provided in several forms. FDOT deployed a number of Road Weather Information System (RWIS) stations to collect new weather data. FDOT also contracted with a third party provider to supply the RTMC with weather data, including current and forecast weather data specific to iFlorida road segments and severe weather alerts tied to specific locations. FDOT planned to use this data in a number of ways, including identifying appropriate speed limits for setting variable speed limits (VSL) and warning travelers of adverse weather conditions. This section of the evaluation report documents the iFlorida use of weather data.
11.1. The iFlorida Weather Systems
The first element of the iFlorida weather systems were the RWIS stations deployed by FDOT. The locations of these stations are depicted in Figure 135.
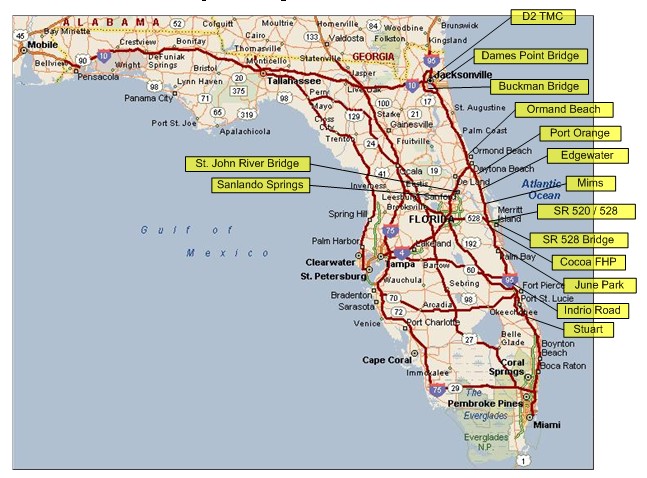
Figure 136. The Locations of iFlorida RWIS Stations
Seven of these stations were deployed at Motorist Aid System Microwave Towers and used the microwave network to transmit their data back to a central server. (See Section 9 for more information on this microwave network.) Each of these stations included an anemometer, a visibility sensor, a rain gauge, a barometer, and a temperature and relative humidity sensor. A data server at the microwave tower collected data from the sensors and transmitted it through the microwave tower network to the University of North Florida. (This data was available to FDOT, though FDOT did not have software installed to decode the data.)
Three additional stations were deployed on poles within District 5. These stations included an anemometer, a visibility sensor, a rain gauge, and a temperature and relative humidity sensor. A data server at the pole collected data from the sensors and transmitted it through an existing fiber network to the University of Northern Florida.
Four stations, measuring only wind speed and direction, were deployed on bridges. The data from the anemometer was transmitted via a wireless system to a nearby station with an existing connection to the FDOT network. A portable weather station was also developed that could be positioned near to locations with connectivity to the FDOT network. See Section 11.2 below for more information on Road Weather Information System performance.
The original design of this system called for the data from these RWIS stations to be transmitted to a weather data processor at the D5 RTMC. This data was accessible at the RTMC, but was in a format that was incompatible with the interface requirements for the CRS and was not used directly. Instead, the University of Northern Florida collected and redistributed the data to the National Weather Service Meteorological Assimilation Data Ingest System (MADIS). FDOT obtained the data through MADIS. The requirements also called for a web-based interface for accessing real-time and historical weather data.
The second element of the iFlorida weather system was a contract with Meteorlogix, a company that supplies customized weather data. This company ingested data from five sources of real-time weather data: a Next Generation Weather Radar (NEXRAD) data feed that provides information about precipitation rates and severe weather conditions, county-based National Weather Service (NWS) weather warnings and watches, information about tropical storms from the National Hurricane Center, and surface observations from MADIS. The system also ingested regional weather forecasts and performed additional processing on this data to generate enhanced precision local weather forecasts with a resolution of 5 km.1
Spatial analyses were performed to relate this weather data to specific geographic objects to generate weather condition and forecasts for those objects. In the case of iFlorida, the geographic objects were road segments, so the system provided weather condition and forecast data for specific road segments.
The third part of the iFlorida weather system involved the CRS, the transportation management software used at the D5 RTMC. High expectations were placed on the CRS software system in terms of its anticipated capability to apply weather data toward facilitating transportation operations decisions. For example, the system was to consider weather conditions when providing recommendations for speed limits to use on VSL signs. The CRS was to provide forecasts of future travel times on iFlorida segments and alert RTMC operators if current or forecast weather conditions would result in an "abnormal road condition" so that the operator could post appropriate 511 and DMS messages. The CRS was also to consider weather conditions when generating traffic condition maps for web-based traveler information, color-coding roads when severe weather conditions existed. These expectations, however, were never realized. The causal factors for this are explored later in this section.
11.2. The Performance of the iFlorida RWIS Stations
In Florida, the weather conditions most likely to impact traveler safety are low visibility from fog, smoke, and heavy rain as well as hazards presented by strong winds, wet pavement, and freezing temperatures. Because most of these conditions are local in nature, data on weather conditions at individual RWIS stations provided little guidance in assessing when and where such conditions existed on Florida roads. FDOT D5 recognized this, and did not intend to use data from individual RWIS stations as part of its decision-making process in responding to road weather conditions. Instead, the data from the RWIS stations was to be integrated with other data in the weather models used by Meteorlogix to generate weather condition and forecast data for individual road segments. The data would also be posted to the MADIS mesonet, so it would be available to weather modelers to improve general forecasts.
The exception to this was the wind-speed monitors placed on bridges. In that case, the risks were at specific locations (i.e., bridges) rather than distributed along roads, and FDOT deployed RWIS stations at the specific locations where the risk existed. The intention was for data from those stations to be ingested by the CRS, which would generate alerts whenever high wind speeds were detected. These alerts would prompt review of conditions at the bridge so that a bridge closure decision could be made.
In practice, the effectiveness of the RWIS stations was limited by disputes between the contractors responsible for developing the CRS and RWIS over how the RWIS stations would interface with the CRS. The project for deploying the RWIS stations was let before the CRS vendor was selected, and the specifications for the interface to this system were vague:
Design a web-based interface to the road weather data collected by the RWIS that shall make this information available in real-time, in a user-friendly and useful format to public and private users (processors) of the data. Conduct a workshop to determine the requirements of FDOT, and other potential stakeholders, and to get feedback about successive versions. The design of the site shall be done in cooperation with FDOT-District 5 and the ITS Office, UNF and NWS meteorologists.
| Providing RWIS data to the MADIS mesonet or to the Clarus system will make the data available to the meteorological community. |
To meet this requirement, UNF developed a web server that could be used to access real-time data from the RWIS stations. It also fed the data to NWS MADIS, which archived the data and made it available to the meteorological community. National Oceanic & Atmospheric Administration (NOAA) staff indicated that the National Centers for Environmental Prediction, which run the operational weather models for the United States, uses data from the MADIS mesonet in these models. Thus, the iFlorida RWIS data was available to improve weather forecasting, though it is not clear how strong the impact of this additional data is on the forecasts.2
The CRS contractor, on the other hand, expected to receive this data through an interface that was based on the IEEE 1512 standard and used Simple Object Access Protocol (SOAP) push to deliver the data. This was the same interface the contractor used to receive most of its data. UNF refused to develop an interface consistent with the one specified by CRS, stating that it was not familiar with the SOAP technology that CRS required it use and did not have sufficient software development resources available to develop an interface based on an unfamiliar technology. CRS refused to develop an interface to available UNF data sources, including a Web site and FTP site through which real-time data was available.
| When systems that must interact are being developed by different contractors, the contractual language for those contractors should specify how the systems will interface and who is responsible for developing each part of the interface. |
Faced with this impasse, FDOT elected to have the CRS receive the RWIS data through MADIS. Meteorlogix, the contractor providing the iFlorida weather condition and forecast data, had already developed an interface to the MADIS data and was in the process of developing an interface to transmit weather data to CRS. The data would go from UNF to MADIS, from MADIS to Meteorlogix, then from Meteorlogix to CRS. The disadvantage of this approach was that it introduced an approximate 15-minute lag between when measurements were made and when the CRS received the data.
The FDOT RWIS data was first delivered to MADIS on February 28, 2005, and the data feed stopped on June 6, 2006, when the contract with UNF to push this data to MADIS ended. The data from these stations during this period is available from MADIS. As of September 2007, FDOT was considering upgrading all FDOT RWIS stations so as to be NTCIP compliant. If this were done, then the agency's new traffic management software (see Section 2) would be able to ingest the RWIS data directly.
11.3. Deploying the Meteorlogix Weather Data System
The contract with Meteorlogix to provide weather data to the iFlorida systems was signed in January 2004, about the same time as the contract to begin development of the CRS was signed. It described the following basic approach for providing Meteorlogix weather data to FDOT:
| The contract with a data provider should clearly describe the data that will be provided and its format. |
- Meteorlogix would ingest weather data from a variety of sources and produce high-resolution estimates for current and forecast weather conditions for a wide variety of forecast parameters.
- Meteorlogix would ingest NWS Doppler Weather radar data and compute projected storm tracks for individual storm cells.
- Meteorlogix would ingest NWS thunderstorm and tornado warnings and associate those warnings to Florida counties.
- Meteorlogix would use the high-resolution current and forecast weather condition data to compute current and forecast values for a Road Speed Index. (The Road Speed Index would be a number estimating the extent of the impact of weather conditions on traffic.)
- Meteorlogix would compute the intersection of the Road Speed Index values with pre-defined road segments and transmit the current and 3-day forecast values of the Road Speed Index for each road segment. The data would be transmitted as a Geographic Information System (GIS) shape file and as a text file.
- Meteorlogix would compute a Road Speed Summary for each road segment, where the Road Speed Summary is a classification of the Road Speed Index into several categories. The data would be transmitted as a GIS shape file and as a text file.
- Meteorlogix would compute the intersection of projected storm tracks and NWS thunderstorm and tornado warnings and provide current and forecast road alerts based on that data.
- Meteorlogix would provide a text narrative for each road segment that summarizes expected weather conditions for the next three hours and would be appropriate for use in a 511 message.
The basic concept was that Meteorlogix would pre-process the weather data and provide to FDOT information tailored to support specific traffic management activities. The Road Speed Index could be used to estimate the impact of current and forecast weather conditions on traffic flow. The alerts could warn operators of severe weather conditions that could impact traffic. The text narratives could be used to generate 511 messages or populate a traveler information Web site.
As the design proceeded for the CRS, which was to receive and make use of the Meteorlogix weather data, considerable change to this approach occurred. Some of the key changes were:
- Meteorlogix would neither compute the Road Speed Index nor provide it to FDOT.
- Meteorlogix would provide weather data for each Florida county, including:
- Current and forecast weather conditions for each Florida county, including a general descriptor of weather conditions, wind speed and direction, and current, minimum, and maximum temperatures;
- Severe weather alerts.
- Meteorlogix would provide weather data for each iFlorida road segment.
- This data would take the form of one or more descriptors indicating when rain, thunderstorms, hail, high winds, snow, or mixed precipitation were expected to affect or were affecting a road segment.
- The data would only be provided when one or more weather conditions exceeded reporting thresholds. The weather conditions that would trigger a data submission were light rain, thunderstorms, hail, high winds, fog, snow, and mixed precipitation.
- The data would be transmitted in the form of TMDD FEU messages, a much more complex format than the use of text files and shape files.
- Meteorlogix would not provide a text narrative for each road segment.
| The design of the system that uses provided data should be complete before a contract with a data provider is put in place. |
In other words, the role of Meteorlogix changed from providing weather information that was pre-processed specifically to support traffic management activities to providing simpler weather data. The responsibility for estimating the impact of weather conditions on traffic had migrated from Meteorlogix to the CRS contractor. However, the format that Meteorlogix was to use for transmitting the data had changed from a simple transmission of shape and text files to a more complicated transmission of XML files in which a time-series of transmissions were organized into events and event updates. These changes meant that the requirements of the Meteorlogix contract were no longer consistent with the actual requirements for participating in the iFlorida deployment.
A second difficulty caused by this evolution of the requirements was that it impacted Meteorlogix's part of the iFlorida deployment. The original schedule called for the meteorological portion of the CRS to be completed in January 2005, making that software available to test the Meteorlogix data feed before Meteorlogix entered the operational phase on May 1, 2005. However, the evolution of the Meteorlogix-CRS interface continued to evolve throughout 2004 and the first part of 2005. The last significant change occurred in March 2005, when CRS documentation first indicated that Meteorlogix would not provide the Road Speed Index to the CRS. The continual evolution of the CRS design prevented Meteorlogix from completing the development of the system that would provide data to the CRS.
| A coordinated master schedule should be maintained that reflects the dependencies between the projects. |
The delays in the CRS development also affected the Meteorlogix deployment in indirect ways. First, FDOT could not test the Meteorlogix data feed until the CRS meteorological component was available. The Meteorlogix system first began providing weather data to FDOT in June 2005, though the CRS interface for receiving that data was not available until July 2005. With no system available to receive the Meteorlogix data, the development of the Meteorlogix side of the Meteorlogix-CRS interface was accepted without complete testing and the contract entered the operational phase. Second, FDOT had no need of Meteorlogix weather data before the CRS development was far enough along to make use of that data. Because FDOT struggled to get the CRS to provide basic traffic management functionality, such as automatically computing travel times and populating DMS with travel time messages, it never moved on to secondary features, such as integrating weather data into its traffic management process. If FDOT had developed a detailed master schedule for the iFlorida deployment that included all of the dependencies for using weather data, it might have avoided paying for a weather data feed that it could not use.
11.4. The Performance of the Meteorlogix Weather Data System
A number of problems were reported with this interface between June 2005, when Meteorlogix first began providing data to FDOT, and November 2005, when FDOT first began regularly using the CRS at the D5 RTMC. Soon afterwards, RTMC operators complained about the presence of extraneous weather data in their CRS displays-the system would post messages indicating that weather conditions were good on every road segment. The root cause of this seemed to be a misunderstanding regarding the type of weather data that would be passed through the Meteorlogix-CRS interface. Meteorlogix provided current weather data for every road segment, while CRS believed that it would only receive weather data for road segments when certain weather conditions existed. FDOT believed that it would be able to tailor the weather conditions that resulted in the display of weather alerts on the operator consoles. The interface control document specified the format that should be used for transmitting the data, but did not specify the data that should be transmitted or the triggers for transmitting it. This information was in the CRS and Meteorlogix design documents. Because comprehensive testing of this data feed was not performed, the discrepancy was not noted until RTMC operators began using the CRS.| Interface documentation should clearly describe the data that is passed through the interface. |
Sometime in January 2006, the CRS contractor turned off the CRS process that received data from Meteorlogix. This eliminated the appearance of extraneous weather data on the RTMC CRS displays, but also removed weather data from the CRS. The CRS weather data processing was restarted in June 2006, but little use was made of this data at the RTMC. Because this data feed was not often used at the RTMC, little is known about the reliability of the feed.
11.5. The Performance of the CRS Weather Data Systems
FDOT's original requirements for the CRS specified that the CRS would:3
- Incorporate roadway weather conditions, alerts and forecasts and accept data feeds from Meteorlogix's weather information;
- Exhibit an abnormal road condition in the operator interface when adverse weather conditions presently exist or are forecasted within the next 60 minutes that will affect throughput capacity or safety along the roadway link;
- Color-code roads on the statewide Web site to indicate if severe weather conditions exist on each road;
- Prompt operators to record a regional 511 message if a significant weather condition exists on a Central Florida or Statewide 511 route;
- Consider weather conditions when estimating future travel times on iFlorida road segments; and
- Archive weather data received.
Of these capabilities, only the first (incorporating weather data) and last (archiving weather data) were successfully demonstrated while the CRS was in operation. CRS did accept data feeds from Meteorlogix, and archived data that it received. The extent to which the CRS met the other requirements is summarized in the following list:
- The CRS did display weather events on the operator interface, but did not initially differentiate between adverse and normal weather conditions, displaying both types of conditions. The CRS was updated to filter the weather data and only display severe weather conditions. But, this filtering capability was frequently "lost" when the CRS software was updated.
- Roads on the statewide Web site were not color-coded based on weather data.
- RTMC operators did not indicate that the CRS prompted them to produce 511 messages based on severe weather conditions.
- FDOT reported that the CRS did not appear to produce travel time forecasts, regardless of whether those forecasts made use of weather data.
11.6. Costs and Benefits of the iFlorida Weather Data Systems
The cost of the iFlorida RWIS stations was $638,000, $400,000 for equipment and $238,000 for other services. This cost covered ten permanent RWIS stations, one portable RWIS station, and four bridge wind speed monitoring stations, as well as compiling and disseminating this data via the Internet and to MADIS through June 2006. Because this data was not used by FDOT, the agency received no direct benefit from it. Because the data was provided to MADIS and, through MADIS, to the weather modeling and forecasting community, there may have been an indirect benefit in the form of improved weather forecasting while the data was available.
The cost of the weather data from the third-party provider was $500,000, $250,000 to design and deploy the systems for delivering the data to FDOT and integrating with the Condition Reporting System and $250,000 for data delivery during the two-year operational period from May 2005 through May 2007. Because the CRS did not fully incorporate the use of weather data to support traffic management operations at the RTMC, little benefit was gained from incorporating this weather data in the iFlorida deployment.
11.7. Summary and Conclusions
As part of the iFlorida Model Deployment, FDOT D5 successfully deployed a set of RWIS stations and established a method (through the MADIS mesonet) for providing that data to the D5 RTMC and to the meteorological community. This method of providing the data to the D5 RTMC introduced a 15-minute lag between the time the data was measured and when it reached the RTMC, which could have reduced its effectiveness in supporting real-time decision making. FDOT also successfully contracted with a third-party provider of weather data to supply road-specific weather condition and forecast data to FDOT.
However, the CRS software that was to help integrate this weather data into FDOT's transportation management decision making process did not perform as expected. Thus, the weather data was little used during the period considered in this report. In large part, this was due to limitations in the CRS, such as not including appropriate filtering of the weather data so that FDOT could select the types of weather conditions that generated alerts for the operators. These limitations were likely compounded by the fact that FDOT was focused on correcting other problems with the CRS, problems that included incorrect computations of travel times and failure to update DMS messages (see Section 2 for more information), rather than correcting problems with CRS use of weather data. With problems existing with the primary types of information needed to support traffic management (e.g., travel times), there was little advantage to improving sources of secondary information, like weather data. In retrospect, it might have been better to introduce weather data into the transportation management process at FDOT after the primary transportation management tools (e.g., travel time measurements, travel time forecasts, traveler information) were more stable.
While deploying and operating these weather systems, FDOT did identify a number of lessons learned that it might use to improve future operations and that other locales may find useful. The following list summarizes these lessons learned.
- Use of the microwave tower sites was a cost-effective approach for deploying RWIS stations at remote sites. Deployment costs were reduced because utilities were already available at those sites and the microwave network could be used to transmit the collected data.
- NWS indicated that locating some weather observation equipment on a microwave tower could violate NWS equipment, siting, and exposure standards. For example, a temperature sensor should be at least 100 feet from any paved or concrete surface and precipitation gauges should not be located close to isolated obstructions such as trees and buildings.4
- The interface between the software that compiled and disseminated data from the RWIS stations and the CRS software, which was to use this data, was a problem, and the contractual language between the two contractors involved did not make it clear who was responsible for fixing the problem. When systems developed by different contractors must interact, the contract should clearly define the interface that will be used and the responsibilities of the contractors in developing that interface.
- The MADIS mesonet can be used as an interface between RWIS stations and traffic management software.
- If DOT RWIS data is provided to the MADIS mesonet, it will be available to the meteorological community, including the National Centers for Environmental Prediction, which runs the operational weather models for the United States.
- If a DOT accesses its RWIS data through the MADIS mesonet, it may also be able to access other real-time surface weather data collected by other organizations.
- Accessing data through the MADIS mesonet may introduce a latency in the availability of the data. For the FDOT RWIS stations, there was an approximate 15-minute lag between when RWIS data was collected and when it was available through the MADIS mesonet.
- Simultaneously introducing new traffic data collection methods, transportation management software, and weather data into the transportation management process is difficult. One may want to wait until the primary transportation management tools and practices are stable before introducing weather data into the process.
Despite the difficulties FDOT faced, it is still hoping to integrate weather data into its transportation decision-making process, but at a slower pace. The agency has replaced the problematic CRS software with software from a different vendor. FDOT is currently focusing its efforts on primary transportation management tools, such as collecting accurate travel time and incident data and facilitating the use of this data to manage its incident response and traveler information capabilities. FDOT has been considering other sources of weather data, and hope in the future to re-introduce weather data into their transportation management practices.
1 The National Weather Service National Digital Forecast Database offers free access to weather forecasts on a 5-km grid covering the continental United States. This could be a viable alternative as a source for digital weather data.
2 From email exchanges with Mike Barth of the National Oceanic and Atmospheric Administration.
3 Source: CRS baseline requirements database.
4 Source: http://www.weather.gov/om/coop/standard.htm (accessed on December 19, 2007). These standards are recommendations rather than requirements. Not following the standards does not preclude NWS from making use of the resulting weather data.