COLUMBIA CASE STUDY
Columbia was selected as the case study city representing the Small size category. It is located in the eastern region of the United States. This section presents the results of a case study of PSEs in the Columbia metropolitan area.
Venue and Event Types
The following specially designed facilities in the Columbia area with event days that draw crowds of more than 10,000 people were contacted:
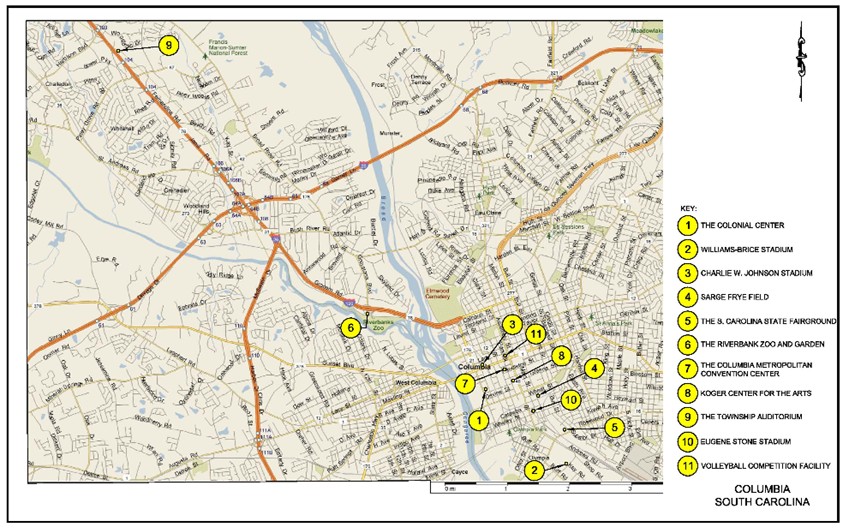
- The Colonial Center – maximum capacity 18,000
- Williams-Brice Stadium – maximum capacity 18,000
- Charlie W. Johnson Stadium – maximum capacity 11,000
- The South Carolina State Fairground – maximum capacity not available
- The Riverbank Zoo and Garden – maximum capacity not available
Other event-hosting facilities that were examined, but found not to host events with crowds larger than 5,000, include:
- Eugene Stone Stadium – maximum capacity 5,700
- Sarge Frye Field – maximum capacity 5,000
- The Township Auditorium – maximum capacity 3,200
- Koger Center for the Arts – maximum capacity 2,500
- Volleyball Competition Facility – maximum capacity 2,000
- The Columbia Metropolitan Convention Center – maximum capacity not available
A map of these venues is provided in Exhibit 6-1. As the map shows, many of these venues are closely clustered in the downtown area, and all are within three miles of an interstate highway. The high concentration of PSE-hosting venues in the city center and the lack of immediate access to major highways from these venues may exacerbate PSE-caused congestion in the city.
Exhibit 6-1: Map of Venues in Columbia that Host PSEs with More Than 10,000 Attendees
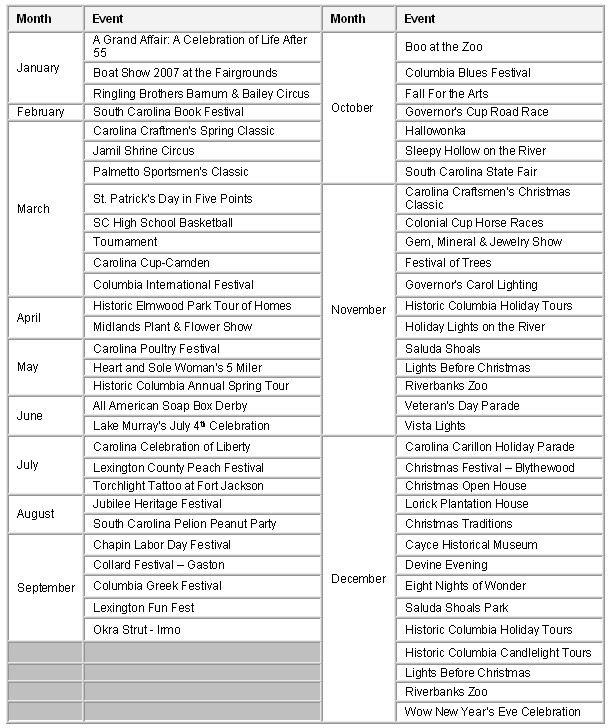
Columbia does not have a municipal office that tracks or issue permits for street and park events. In order to estimate the number of street and park events in the city, project staff contacted every event organizer listed in the event calendar in Exhibit 6-2, which was provided by the Columbia Metropolitan Convention Center and Visitor Bureau.
Exhibit 6-2: Calendar of Events in the Columbia Area, provided by the Columbia Metropolitan Center and Visitors Bureau
Data Collection by Venue
The next few paragraphs provide a description of each PSE-hosting venue in the city that draws crowds of more than 10,000 attendees. For the purposes of a sensitivity analysis, data was also collected on venues that draw crowds of more than 5,000 attendees.
Colonial Center
The Colonial Center is a multi-purpose arena in Columbia, primarily home to the University of South Carolina men's and women's basketball teams. Opened in 2002 as a replacement for the Carolina Coliseum, the 18,000-seat arena is also host to events such as conferences, concerts, and graduation ceremonies throughout the year. It is the largest arena in the state of South Carolina and the tenth largest college arena in the U.S. The Center has 36 home basketball games with an average attendance of 11,000. It hosts eight shows with 10,000 in attendance, as well as 12 concerts. Half the concerts have about 6,000 attendees and the other half have about 11,000 attendees.
Williams-Brice Stadium
Williams-Brice Stadium is the home of the USC Gamecocks' football team and is one of the largest college football stadiums in the nation. It seats 80,250 and is located just south of downtown Columbia.
Sarge Frye Field
Sarge Frye Field is the home field of the University of South Carolina Gamecock baseball team. The stadium, which is named after a longtime groundskeeper of the college, holds 5,000 people. The team will move into a new ballpark in 2009.
Charlie Johnson Stadium
Charlie W. Johnson Stadium in Columbia is primarily used for football and is the home field of Benedict College. The stadium opened in 2006 and holds 11,000 people.
Street and Park Events
Street events in the Columbia area include fairs, festivals, and marathons. As noted above, information on street events was collected by contacting every event organizer listed in an annual event calendar sent to project staff by the Columbia Metropolitan Convention Center and Visitors Bureau.
South Carolina State Fairground
The South Carolina State Fairground is the site of the South Carolina state fair and other events.
Riverbank Zoo and Garden
The Riverbank Zoo and Garden hosts many large attendance events such as Boo at the Zoo and Lights before Christmas.
Other
Other venues that were surveyed include the South Carolina State Museum and Fort Jackson, a U.S. Army installation.
Data Collection by Activity
The next few paragraphs describe data collected for each of the PSE event types in the Columbia area.
College Sports
The University of South Carolina (USC) has the most well-attended college sports teams in Columbia. The USC Gamecocks play 36 home basketball games at the Colonial Center with an average attendance of 11,000.
Expositions and Shows
Most large exhibitions in Columbia are held at the Colonial Center. There is an average of eight expositions and shows in the Colonial Center with attendance over 5,000 every year.
PSE Event Days Summary Matrix
The matrix in Exhibit 6-3 lists the number of event days for PSEs with more than 10,000 attendees in Columbia. In total, there is an average of 94 events with more than 10,000 attendees annually. Attendance at these large PSEs ranges from 10,000 to 75,000.
 |
Affiliated Team/Event | Average Attendance | The Colonial Center | Williams-Brice Stadium | Sarge Frye Field | Charlie Johnson Stadium | Street | Parks | State Fair Ground | Riverbank Zoo and Garden | Other | Total |
|---|---|---|---|---|---|---|---|---|---|---|---|---|
| Professional Football | |
|
|
|
|
|
|
|
|
|
|
0 |
| Professional Baseball | |
|
|
|
|
|
|
|
|
|
|
0 |
| Professional Basketball | |
|
|
|
|
|
|
|
|
|
|
0 |
| Professional Ice Hockey | |
|
|
|
|
|
|
|
|
|
|
0 |
| College Football | USC Gamecocks | 80,000 | |
7 | |
|
|
|
|
|
|
7 |
| College Basketball | USC Gamecocks |
11,000 |
36 |
|
|
|
|
|
|
|
|
36 |
| Auto Racing | |
|
|
|
|
|
|
|
|
|
|
0 |
| Horse Racing | |
|
|
|
|
|
|
|
|
|
|
0 |
| Golf Tournaments | |
|
|
|
|
|
|
|
|
|
|
0 |
| Marathons | |
|
|
|
|
|
|
|
|
|
|
|
| Concerts | |
30,000 | |
2 | |
|
|
|
|
|
|
2 |
| Parades | |
15,000 | |
|
|
|
1 | |
|
|
|
1 |
| Fairs | |
12,500 | |
|
|
|
|
|
3 | |
1 | 4 |
| Festivals | Benedict College | 10,000 | |
|
|
|
|
|
|
|
1 | 1 |
| Protests/Political Events | |
30,000 | |
1 | |
|
|
|
|
|
|
1 |
| Expositions and Shows | |
10,000 | 8 | |
|
|
|
|
|
|
|
8 |
| Other – Concert | |
11,000 | 6 | |
|
|
|
|
|
|
|
6 |
| Other – College Football | Benedict College | 11,000 | |
|
|
3 | |
|
|
|
|
3 |
| Other –Fair | |
40,000 | |
|
|
|
1 | |
12 | |
|
13 |
| Other – Festival | Benedict College | 10,000 | |
|
5 |
|
|
|
|
|
1 | 1 |
| Other – Festival | |
24,000 | |
|
|
|
9 | |
|
|
|
9 |
| Other – Festival | |
40,000 | |
|
|
|
1 | |
|
|
|
1 |
| Other – Festival | |
75,000 | |
|
|
|
1 | |
|
|
|
1 |
| Total | |
|
50 | 10 | 0 | 3 | 13 | 0 | 15 | 0 | 3 | 94 |
| Maximum Facility Capacity | |
|
18,000 | 80,250 | 5,000 | 11,000 | NA | NA | NA | NA | NA | |
| Public Transportation (Y/N) | |
|
NA | NA | NA | NA | NA | NA | NA | NA | NA | |
| Near Interstate (Y/N) | |
|
Y | Y | Y | Y | Y | Y | Y | Y | Y | |
| Type of Public Transit* | |
|
NA | NA | NA | NA | NA | NA | NA | NA | NA | |
| Number of Parking Spaces | |
|
NA | NA | NA | NA | NA | NA | NA | NA | NA | |
Venue Location** |
|
|
U | U | U | U | U | U | U | U | U | |
| * Response options are: B (Bus), L (Light Rail),
H (Heavy Rail) ** Response options are: D (Downtown), U (Urban), S (Suburban), R (Rural) |
||||||||||||
As stated in the Study Methodology section, in an attempt to exclude low attendance PSEs that have small impacts on traffic demand, project staff, in coordination with FHWA, selected an event attendance size cut-off of 10,000. However, in order to examine the sensitivity of these results, data on the number of events with more than 5,000 attendees was collected for El Paso and Columbia, where data collection was relatively less complex. As shown in Exhibit 6-4, there are approximately 167 events with more than 5,000 attendees annually. Accordingly, there is an average of one PSE with more than 5,000 people every other day in the Columbia area.
|
Affiliated Team/Event | Average Attendance | The Colonial Center | Williams-Brice Stadium | Sarge Frye Field | Charlie Johnson Stadium | Street | Parks | State Fair Ground | Riverbank Zoo and Garden | Other | Total |
|---|---|---|---|---|---|---|---|---|---|---|---|---|
| Professional Football | |
|
|
|
|
|
|
|
|
|
|
0 |
| Professional Baseball | |
|
|
|
|
|
|
|
|
|
|
0 |
| Professional Basketball | |
|
|
|
|
|
|
|
|
|
|
0 |
| Professional Ice Hockey | |
|
|
|
|
|
|
|
|
|
|
0 |
| College Football | USC Gamecocks | 80,000 | |
7 | |
|
|
|
|
|
|
7 |
| College Basketball | USC Gamecocks |
11,000 |
36 |
|
|
|
|
|
|
|
|
36 |
| Auto Racing | |
|
|
|
|
|
|
|
|
|
|
0 |
| Horse Racing | |
|
|
|
|
|
|
|
|
|
|
0 |
| Golf Tournaments | |
|
|
|
|
|
|
|
|
|
|
0 |
| Marathons | |
|
|
|
|
|
|
|
|
|
|
|
| Concerts | |
30,000 | |
2 | |
|
|
|
|
|
|
2 |
| Parades | |
15,000 | |
|
|
|
1 | |
|
|
|
1 |
| Fairs | |
6,300 | |
|
|
|
2 | |
7 | |
1 | 10 |
| Festivals | 5,000 | |
|
|
|
|
5 | |
7 | |
12 | |
| Protests/Political Events | |
30,000 | |
1 | |
|
|
|
|
|
|
1 |
| Expositions and Shows | |
10,000 | 8 | |
|
|
|
|
|
|
|
8 |
| Other – Concert | |
5,500 | 6 | |
|
|
2 | 5 | |
|
|
13 |
| Other – Concert | 11,000 | 6 | |
|
|
|
|
|
|
|
6 | |
| Other –College football | Benedict College | 11,000 | |
|
|
3 | |
|
|
|
|
3 |
| Other – College baseball | USC Gamecocks | 5,000 | |
|
36 | |
|
|
|
|
|
36 |
| Other – High school football | |
8,000 | |
3 | |
|
|
|
|
|
|
3 |
| Other – Fair | |
12,500 | |
|
|
|
|
|
3 | |
1 | 4 |
| Other – Fair | |
40,000 | |
|
|
|
1 | |
12 | |
13 | |
| Other – Festival | Benedict College |
10,000 | |
|
|
|
|
|
|
|
1 | 1 |
| Other – Festival | |
24,000 | |
|
|
|
9 | |
|
|
|
9 |
| Other – Festival | |
40,000 | |
|
|
|
1 | |
|
|
|
1 |
| Other – Festival | |
75,000 | |
|
|
|
1 | |
|
|
|
1 |
| Total | |
|
55 | 13 | 36 | 3 | 17 | 10 | 22 | 7 | 3 | 167 |
| Maximum Facility Capacity | |
|
18,000 | 80,250 | 5,000 | 11,000 | NA | NA | NA | NA | NA | |
| Public Transportation (Y/N) | |
|
NA | NA | NA | NA | NA | NA | NA | NA | NA | |
| Near Interstate (Y/N) | |
|
Y | Y | Y | Y | Y | Y | Y | Y | Y | |
| Type of Public Transit* | |
|
NA | NA | NA | NA | NA | NA | NA | NA | NA | |
| Number of Parking Spaces | |
|
NA | NA | NA | NA | NA | NA | NA | NA | NA | |
Venue Location** |
|
|
U | U | U | U | U | U | U | U | U | |
| * Response options are: B (Bus), L (Light Rail),
H (Heavy Rail) ** Response options are: D (Downtown), U (Urban), S (Suburban), R (Rural) |
||||||||||||
Venue-specific PSE event days with attendance of more than 5,000 and 10,000 as a percent of the total number of PSEs with attendance of more than 5,000 and 10,000, respectively, is summarized in Exhibit 6-5. There are on average approximately 97 PSE event days with attendance of more than 10,000 annually. Statistically, there is an average of 1.9 PSE event days per week, or one every 3.7 days. The majority of these events, 75 percent, are hosted at the Colonial Center. The second most frequent host of these events is the South Carolina State Fairground, which hosts 15 percent of all PSEs with attendance of more than 10,000. The Colonial Center, Williams-Brice Stadium, and Sarge Frye Field are affiliated with the University of South Carolina Gamecocks. These three facilities combined host 64 percent of all PSEs with attendance over 10,000 and 64 percent of all PSEs with attendance of more than 5,000.
| Venue | Venue Type | Event days with more than 5,000 people | Event days with more than 10,000 people | ||
|---|---|---|---|---|---|
| Number of PSE event days annually | Percent of Total (%) | Number of PSE event days annually | Percent of Total (%) | ||
| Colonial Center | Arena | 56 | 34 | 50 | 53 |
| Willimas-Brice Stadium | Stadium | 13 | 8 | 10 | 11 |
| Sarge Frye Field | Stadium | 36 | 22 | 0 | 0 |
| Charlie Johnson Stadium | Stadium | 3 | 2 | 3 | 3 |
| Street Events | Street | 17 | 10 | 13 | 14 |
| Park Events | Park | 10 | 6 | 0 | 0 |
| SC State Fairground | Convention Center | 22 | 13 | 15 | 16 |
| Riverbank Zoo and Garden | Racetrack | 7 | 4 | 0 | 0 |
| Other | |
3 | 2 | 3 | 3 |
| Total | |
167 | 100 | 94 | 100 |
| Note: Due to rounding the percentages do not add up to 100. | |||||
Exhibit 6-6 lists PSE event days by activity categories. College and high school sports account for 49 percent of PSEs with attendance of more than 10,000. Concerts account for nine percent of events with more than 10,000 attendees.
| Activity Category | Activity | Events Days W/ More Than 5,000 People | Events Days W/ More Than 10,000 People | ||
|---|---|---|---|---|---|
| Number of PSE Event Days Annually | Percent of Total (%) | Number of PSE Event Days Annually | Percent of Total (%) | ||
| Professional Team Sports | Professional Football | 0 | 0.0 | 0 | 0.0 |
| Professional Team Sports | Professional Baseball | 0 | 0.0 | 0 | 0.0 |
| Professional Team Sports | Professional Basketball | 0 | 0.0 | 0 | 0.0 |
| Professional Team Sports | Professional Ice Hockey | 0 | 0.0 | 0 | 0.0 |
| College & High School Sports | College & HS Football | 13 | 7.8 | 10 | 10.6 |
| College & High School Sports | College & HS Basketball | 36 | 21.6 | 36 | 38.3 |
| College & High School Sports | Other – College Baseball | 36 | 21.6 | 0 | 0.0 |
| Racing | Auto Racing | 0 | 0.0 | 0 | 0.0 |
| Racing | Horse Racing | 0 | 0.0 | 0 | 0.0 |
| Racing | Other – Boat Racing | 0 | 0.0 | 0 | 0.0 |
| Golf | Golf Tournaments | 0 | 0.0 | 0 | 0.0 |
| Concerts | Concerts | 21 | 12.6 | 8 | 8.5 |
| Marathons | Marathons | 0 | 0.0 | 0 | 0.0 |
| Parades | Parades | 1 | 0.6 | 1 | 1.1 |
| Fairs | Fairs | 27 | 16.2 | 17 | 18.1 |
| Festivals | Festivals | 24 | 14.4 | 13 | 13.8 |
| Protests / Political Events | Protests / Political Events | 1 | 0.6 | 1 | 1.1 |
| Expositions & Shows | Expositions & Shows | 8 | 4.8 | 8 | 8.5 |
| Other | Other | 0 | 0.0 | 0 | 0.0 |
| TOTAL | |
167 | 100.0 | 94 | 100.0 |
| Note: Due to rounding, the percentages do not add up to 100. | |||||
Traffic Impacts
The annual delay per traveler in Columbia as a result of PSEs is between 0.4 and 0.7 hours per year. The wasted fuel per traveler is between 0.2 and 0.4 gallons per year. Annual travel delay in Columbia due to planned special events totals between 83,000 and 166,000 hours. Between 53,000 and 105,000 gallons of excess fuel are consumed per year. Finally, the congestion cost of planned special events is between $2 million and $3 million per year.
The results of the congestion analysis for the Columbia area are summarized in Exhibit 6-7.
| Congestion Category | Units | AM Peak (44%) | PM Peak (56%) | PSE Caused (4%) | PSE Caused (8%) | Totals |
|---|---|---|---|---|---|---|
| Average Delay per traveler | Hours | 7.1 | 8.9 | 0.4 | 0.7 | 16 |
| Wasted Fuel per Traveler | Gallons | 4.4 | 5.6 | 0.2 | 0.4 | 10 |
| Travel Delay | Hours | 1,650,442 | 2,079,558 | 83,182 | 166,365 | 3,730,000 |
| Excessive Fuel Consumed | Gallons | 1,046,018 | 1,317,982 | 52,719 | 105,439 | 2,364,000 |
| Congestion Cost | $ Million | 32 | 41 | 2 | 3 | 73 |
The previously-determined attendance figures were used to determine more specific congestion effects in the Columbia area. Average attendance at the Williams-Brice Stadium for University of South Carolina Gamecock college football games is 80,000 people, with seven games per year. This means that approximately 22 percent of all planned special event attendance in the Columbia area is at college football games.
The major congestion factor when considering college and high school football is the day on which the game is played. The majority of college football games are played on weekends, either Saturday afternoons or Saturday evenings. Games do not occur during peak commuting periods, so the majority of congestion caused by the games affects only attendees. The percentage of non-attendees affected by the planned special event is much lower. In addition, college football tends to attract a large amount of students who walk to the game from campus, which greatly reduces congestion on the roadways.
College football games also attract many tailgaters, who tend to arrive much earlier than game time and to stay much longer than other attendees after the completion of the game. As attendee arrivals and departures are spread out, roadway congestion is reduced. College football is a very good example of how timing of the event and type of event play into the role of congestion.
Summary of Case Study Cities
There is significant variation in the frequency of events across the case study cities. City size appears to affect the types of events that occur in cities. For example, Very Large and Large cities tend to host professional sports teams, while Medium and Small cities do not. The occurrence of some event types is also influenced by geography. Detroit, for instance, is situated along Lake Michigan and can host boat races, while landlocked El Paso and Columbia cannot. At other times, the occurrence and frequency of events depends on social and cultural attributes. Fairs are popular in Small rural cities like Columbia, for example, but tend to occur less frequently in Very Large and Large cities. A summary table of the results from all the case studies is provided in Exhibit 6-8.
| Activity Category | Activity | Detroit, MI | Portland, OR | El Paso, TX > 5K |
El Paso, TX > 10K |
Columbia, SC > 5K |
Columbia, SC > 10K |
||||||
|---|---|---|---|---|---|---|---|---|---|---|---|---|---|
| Number of PSE Event Days Annually | Percent of Total (%) | Number of PSE Event Days Annually | Percent of Total (%) | Number of PSE Event Days Annually | Percent of Total (%) | Number of PSE Event Days Annually | Percent of Total (%) | Number of PSE Event Days Annually | Percent of Total (%) | Number of PSE Event Days Annually | Percent of Total (%) | ||
| Professional Team Sports | Professional Football | 10 | 1.9 | |
0.0 | |
0.0 | |
0.0 | |
0.0 | |
0.0 |
| Professional Team Sports | Professional Baseball | 81 | 15.4 | 7 | 3.7 | |
0.0 | |
0.0 | |
0.0 | |
0.0 |
| Professional Team Sports | Professional Basketball | 70 | 13.3 | 44 | 23.5 | |
0.0 | |
0.0 | |
0.0 | |
0.0 |
| Professional Team Sports | Professional Ice Hockey | 46 | 8.7 | |
0.0 | |
0.0 | |
0.0 | |
0.0 | |
0.0 |
| Professional Team Sports | Other – Soccer | |
0.0 | 7 | 3.7 | |
0.0 | |
0.0 | |
0.0 | |
0.0 |
| College & High School Sports | College Football | 8 | 1.5 | 1 | 0.5 | 23 | 9.4 | 12 | 12.9 | 13 | 7.8 | 10 | 10.6 |
| College & High School Sports | College Basketball | 10 | 1.9 | |
0.0 | 42 | 17.2 | 17 | 18.3 | 36 | 21.6 | 36 | 38.3 |
| College & High School Sports | Other – Baseball | |
0.0 | |
0.0 | 12 | 4.9 | |
0.0 | 36 | 21.6 | |
0.0 |
| College & High School Sports | Other – Ice Hockey | 12 | 2.3 | |
0.0 | |
0.0 | |
0.0 | |
0.0 | |
0.0 |
| Racing | Auto Racing | 3 | 0.6 | 3 | 1.6 | |
0.0 | |
0.0 | |
0.0 | |
0.0 |
| Racing | Horse Racing | |
0.0 | |
0.0 | 41 | 16.8 | 1 | 1.1 | |
0.0 | |
0.0 |
| Racing | Other – Bicycle | |
0.0 | 3 | 1.6 | |
0.0 | |
0.0 | |
0.0 | |
0.0 |
| Racing | Other – Boat | 3 | 0.6 | |
0.0 | |
0.0 | |
0.0 | |
0.0 | |
0.0 |
| Golf | Golf Tournaments | 4 | 0.8 | 4 | 2.1 | |
0.0 | |
0.0 | |
0.0 | |
0.0 |
| Concerts | Concerts | 179 | 34.0 | 25 | 13.4 | 43 | 17.6 | 12 | 12.9 | 21 | 12.6 | 8 | 8.5 |
| Marathons | Marathons & Walks | 2 | 0.4 | 4 | 2.1 | 1 | 0.4 | 1 | 1.1 | |
0.0 | |
0.0 |
| Parades | Parades | 1 | 0.2 | 2 | 1.1 | 1 | 0.4 | 1 | 1.1 | 1 | 0.6 | 1 | 1.1 |
| Fairs | Fairs | |
0.0 | |
0.0 | 5 | 2.0 | |
0.0 | 27 | 16.2 | 17 | 18.1 |
| Festivals | Festivals | 33 | 6.3 | 38 | 20.3 | 8 | 3.3 | 8 | 8.6 | 24 | 14.4 | 13 | 13.8 |
| Protests / Political Events | Protests / Political Events | 3 | 0.6 | 2 | 1.1 | |
0.0 | |
0.0 | 1 | 0.6 | 1 | 1.1 |
| Expositions & Shows | Expositions & Shows | 61 | 11.6 | 47 | 25.1 | 20 | 8.2 | |
0.0 | 8 | 4.8 | 8 | 8.5 |
| Other | Other | |
0.0 | |
0.0 | 48 | 19.7 | 41 | 44.1 | |
0.0 | |
0.0 |
| TOTAL | 526 | 100.0 | 187 | 100.0 | 244 | 100.0 | 93 | 100.0 | 167 | 100.0 | 94 | 100.0 | |