EL PASO CASE STUDY
El Paso was selected as the case study city representative of the Medium size group and the southern geographical area. This section presents the results of the case study of PSEs in the El Paso metropolitan area.
Venues and Event Types
The following specially designed facilities with event days generating crowds of more than 10,000 people in the El Paso area were contacted:
- Canutillo Stadium – maximum capacity 12,000
- El Paso County Coliseum – maximum capacity 11,000
- Sun Bowl Stadium – maximum capacity 51,500
- Don Haskins Center – maximum capacity 12,222
- SISD Student Activity Center – maximum capacity 11,000
- Sunland Park Raceway – maximum capacity not available
Other event hosting facilities that were examined, but found not to host events with crowds larger than 5,000, include:
- Cohen Stadium – maximum capacity 9,725
- El Paso Convention Center – maximum capacity 8,000
- J. Quarles Thunderbird Stadium – maximum capacity 2,250
- Patriot Stadium – maximum capacity 3,000
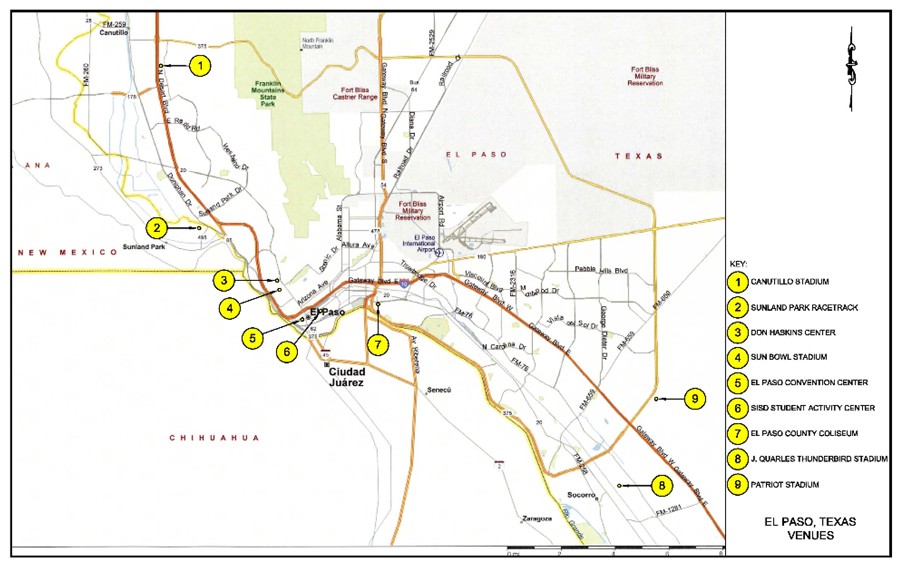
A map of some of these venues is provided in Exhibit 5-1. As the map shows, all of the venues are located within two to three miles of Interstate 10.
Exhibit 5-1: Map of Venues in El Paso that Host PSEs with More Than 10,000 Attendees
The following municipal departments were contacted to collect information on open area PSEs:
- Development and Infrastructure Services
- Transportation and Economic Development
- Department of Parks and Recreation
Data Collection by Venue
The next few paragraphs provide a description of each of the PSE hosting venues in the city that draw crowds of more than 10,000 attendees. For the purposes of a sensitivity analysis, data was also collected on events that drew crowds of more than 5,000 attendees.
Cohen Stadium
Cohen Stadium is located on the northeast side of El Paso, by the Patriot Freeway next to the Franklin Mountains. It is primarily used for baseball, and is the home field of the El Paso Diablos minor league baseball team. It opened in 1990 and holds 9,725 people. Cohen Stadium is also used for concerts, boxing, and soccer games.
Canutillo Stadium
Canutillo Stadium is located at Canutillo High School and is owned and operated by the Canutillo Independent School District. Opened to the public in 2005, the stadium has a capacity of around 12,000 and is about 14 miles away from downtown El Paso. It is mainly used for high school football games.
El Paso County Coliseum
El Paso County Coliseum is a 5,250-seat multi-purpose arena in El Paso. The Coliseum opened in 1942 and can be adapted to seat up to 11,000 for concerts.
Sun Bowl Stadium
The Sun Bowl is an outdoor football stadium on the campus of the University of Texas at El Paso (UTEP). It is home to the UTEP Miners of Conference USA (formerly of the Western Athletic Conference), and a late December college football bowl game, the Brut Sun Bowl. The stadium was opened in 1963 and has a current seating capacity of 51,500.
Don Haskins Center
The Don Haskins Center (capacity 12,222), the home of UTEP Miners basketball, is considered one of the top college basketball facilities in the United States and perhaps the top in Conference USA. Fans are seated extremely close to the playing floor, and the UTEP student section is located near the opponent's bench. "The Don" is so notorious as a tough place for opponents to win that UTEP has historically had difficulty convincing top-rated teams to play there.
SISD Student Activity Complex
The Socorro Independent School District (SISD) Student Activities Complex, known locally as "The SAC," is a high school football stadium located in the far east side of El Paso. It has a capacity of 11,000. It is owned and operated by the SISD for high school football, soccer, and track and field events. It is also used for the SISD high school graduation ceremonies.
Street and Park Events
Street events in the El Paso area include fairs, festivals, and marathons. Information on street events was collected from the El Paso Convention Center and Visitors Bureau.
El Paso Convention Center
The El Paso Convention Center has a maximum capacity of 8,000. It hosts 16 PSE event days with crowds above 5,000, but does not host any PSE event days with crowds above 10,000.
Sunland Park Racetrack
The Sunland Park Racetrack hosts an average of 6,000 attendees every Saturday and Sunday between December and April, or approximately 40 event days annually. In addition, an annual Derby has an attendance of 13,000 people.
Data Collection by Activity
The next few paragraphs describe data collected for each of the PSE event types in the El Paso area that draw crowds in excess of 10,000 or 5,000 attendees.
College Sports
University of Texas El Paso (UTEP) has the most well-attended college sports games in El Paso. The UTEP basketball team hosts about 17 games a year that draw crowds in excess of 10,000. The football team plays at the Sun Bowl Stadium and during the 2007 session had six games with about 48,000 attendees.
Horse Racing
El Paso's only horse racing venue is the Sunland Park Raceway. As discussed above, Sunland Park hosts an average of 6,000 attendees every Saturday and Sunday between December and April, or approximately 40 event days. The only event hosting more than 10,000 people is an annual Derby that attracts 13,000.
Expositions and Shows
Most large exhibitions in El Paso are held at the El Paso Convention Center. The Convention Center averages 16 PSEs with an attendance of over 5,000 people annually, but none that exceed 10,000.
PSE Event Days Summary Matrixes
A matrix listing the number of event days for PSEs with more than 10,000 attendees in the El Paso is provided in Exhibit 5-2. In total, there is an average of 93 events with more than 10,000 attendees annually. Attendance at these large PSEs ranges from 10,000 to 150,000.
 |
Affiliated Team/Event | Average Attendance | Cohen Statium | Canutillo Stadium | El Paso County Coliseum | Sun Bowl Stadium | Don Haskins Center | SISD Student Activity Complex (SAC | Street | Parks | El Paso Convention Center | Sunland Park Raceway | Total |
|---|---|---|---|---|---|---|---|---|---|---|---|---|---|
| Professional Football | |
|
|
|
|
|
|
|
|
|
|
|
0 |
| Professional Baseball | |
|
|
|
|
|
|
|
|
|
|
|
0 |
| Professional Basketball | |
|
|
|
|
|
|
|
|
|
|
|
0 |
| Professional Ice Hockey | |
|
|
|
|
|
|
|
|
|
|
|
0 |
| College Football | |
48,000 | |
|
|
6 | |
|
|
|
|
|
6 |
| College Basketball | |
10,000 |
|
|
|
|
17 | |
|
|
|
|
17 |
| Auto Racing | |
|
|
|
|
|
|
|
|
|
|
|
0 |
| Horse Racing | |
13,000 | |
|
|
|
|
|
|
|
|
1 | 1 |
| Golf Tournaments | |
|
|
|
|
|
|
|
|
|
|
|
0 |
| Marathons | |
10,000 | |
|
|
|
|
|
1 | |
|
|
1 |
| Concerts | |
10,000 | |
|
|
|
12 | |
|
|
|
|
12 |
| Parades | |
150,000 | |
|
|
|
|
|
1 | |
|
|
1 |
| Fairs | |
|
|
|
|
|
|
|
|
|
|
|
0 |
| Festivals | |
30,000 | |
|
|
|
|
|
|
1 | |
1 | |
| Protests/Political Events | |
|
|
|
|
|
|
1 | 1 | 1 | |
|
0 |
| Expositions and Shows | |
|
|
|
|
|
|
|
|
|
|
|
0 |
| Other – HS Football | |
15,000 | |
|
|
6 | |
|
|
|
|
|
6 |
| Other – Graduation | |
12,000 | |
|
|
|
17 |
|
|
|
|
|
17 |
| Other –Festival | |
15,000 | |
|
|
|
|
|
2 | |
|
|
2 |
| Other – Festival | |
12,000 | |
|
5 | |
|
|
|
|
|
|
5 |
| Other | |
23,000 | |
|
|
|
24 |
|
|
|
|
|
24 |
| Total | |
|
0 | 0 | 5 | 12 | 70 | 0 | 4 | 1 | 0 | 1 | 93 |
| Maximum Facility Capacity | |
|
9,725 | 12,000 | 11,000 | 51,500 | 12,222 | 11,000 | NA | NA | 8,000 | NA | |
| Public Transportation (Y/N) | |
|
Y | Y | Y | Y | Y | Y | Y | Y | Y | N | |
| Type of Public Transit* | |
|
B | B | B | B | B | B | B | B | B | N | |
| Near Interstate (Y/N) | |
|
Y | Y | Y | Y | Y | Y | Y | Y | Y | Y | |
| Number of Parking Spaces | |
|
NA | NA | NA | NA | NA | NA | NA | NA | 1,425 | NA | |
Venue Location** |
|
|
U | U | U | U | U | U | U | R | D | S | |
| * Response options are: B (Bus), L (Light Rail),
H (Heavy Rail) ** Response options are: D (Downtown), U (Urban), S (Suburban), R (Rural) |
|||||||||||||
As stated in the Study Methodology section, in an attempt to exclude low attendance PSEs that have small impacts on traffic demand, project staff, in coordination with FHWA, selected an event attendance size cut-off of 10,000. However, in order to examine the sensitivity of these results, data on the number of events of over 5,000 was collected for the smaller case study cities of El Paso and Columbia, where data collection was relatively less complex. Exhibit 5-3 summarizes events with more than 5,000 attendees. There were 244 events in this category, more than double the number of events with more than 10,000 attendees.
|
Affiliated Team/Event | Average Attendance | Cohen Statium | Canutillo Stadium | El Paso County Coliseum | Sun Bowl Stadium | Don Haskins Center | SISD Student Activity Complex (SAC | Street | Parks | El Paso Convention Center | Sunland Park Raceway | Total |
|---|---|---|---|---|---|---|---|---|---|---|---|---|---|
| Professional Football | |
|
|
|
|
|
|
|
|
|
|
|
0 |
| Professional Baseball | |
|
|
|
|
|
|
|
|
|
|
|
0 |
| Professional Basketball | |
|
|
|
|
|
|
|
|
|
|
|
0 |
| Professional Ice Hockey | |
|
|
|
|
|
|
|
|
|
|
|
0 |
| College Football | |
48,000 | |
|
|
6 | |
|
|
|
|
|
6 |
| College Basketball | |
9,000 | |
|
|
|
42 | |
|
|
|
|
42 |
| Auto Racing | |
|
|
|
|
|
|
|
|
|
|
|
0 |
| Horse Racing | |
6,000 | |
|
|
|
|
|
|
|
|
40 | 40 |
| Golf Tournaments | |
|
|
|
|
|
|
|
|
|
|
|
0 |
| Marathons | |
10,000 | |
|
|
|
|
|
1 | |
|
|
1 |
| Concerts | |
8,000 | 6 | |
|
|
|
|
|
|
|
|
6 |
| Parades | |
150,000 | |
|
|
|
|
|
1 | |
|
|
1 |
| Fairs | |
5,000 | |
|
|
|
|
|
|
5 | |
|
5 |
| Festivals | |
30,000 | |
|
|
|
|
|
|
1 | |
|
1 |
| Protests/Political Events | |
|
|
|
|
|
|
|
|
|
|
|
0 |
| Expositions and Shows | |
5,000 | 4 | |
|
|
|
|
|
|
16 | |
20 |
| Other – College Basketball | |
6,000 | 12 | |
|
|
|
|
|
|
|
|
12 |
| Other – Concerts | |
6,000 | |
|
25 | |
|
|
|
|
|
|
25 |
| Other – HS Football | |
15,000 | |
|
|
6 | |
|
|
|
|
|
6 |
| Other – Football | |
7,000 | |
|
|
|
|
11 | |
|
|
|
11 |
| Other –Rodeo | |
6,000 | 2 | |
|
|
|
|
|
|
|
|
2 |
| Other – Graduation | |
5,000 | |
1 | |
|
|
4 | |
|
|
|
5 |
| Other – Graduation | |
12,000 | |
|
|
|
17 | |
|
|
|
|
17 |
| Other – Concert | |
10,000 | |
|
|
|
12 | |
|
|
|
|
12 |
| Other –Festival | |
15,000 | |
|
|
|
|
|
2 | |
|
|
2 |
| Other – Festival | |
12,000 | |
|
5 | |
|
|
|
|
|
|
5 |
| Other – Horse Racing | |
13,000 | |
|
|
|
|
|
|
|
|
1 | 1 |
| Other | |
23,000 | |
|
|
|
24 | |
|
|
|
|
24 |
| Total | |
|
24 | 1 | 30 | 12 | 95 | 15 | 4 | 6 | 16 | 41 | 224 |
| Maximum Facility Capacity | |
|
9,725 | 12,000 | 11,000 | 51,500 | 12,222 | 11,000 | NA | NA | 8,000 | |
|
| Public Transportation (Y/N) | |
|
Y | Y | Y | Y | Y | Y | Y | Y | Y | |
|
| Type of Public Transit* | |
|
B | B | B | B | B | B | B | B | B | |
|
| Near Interstate (Y/N) | |
|
Y | Y | Y | Y | Y | Y | Y | Y | Y | |
|
| Number of Parking Spaces | |
|
NA | NA | NA | NA | NA | NA | NA | NA | 1,425 | |
|
Venue Location** |
|
|
U | U | U | U | U | U | U | R | D | |
|
| * Response options are: B (Bus), L (Light Rail),
H (Heavy Rail) ** Response options are: D (Downtown), U (Urban), S (Suburban), R (Rural) |
|||||||||||||
Venue-specific PSE event days with attendance over 5,000 and 10,000 as a percentage of the total number of PSEs with attendance over 5,000 and 10,000, respectively, are summarized in Exhibit 5-4. There are on average approximately 93 PSE event days with attendance over 10,000 annually. This is an average of 1.8 PSE event days per week, or one every four days. The majority of these events, 75 percent, are hosted at the Don Haskins Center. The second most frequent host of these events is the Sun Bowl Stadium, which hosts 13 percent of all PSEs with attendance over 10,000. Both facilities are at located the University of Texas at El Paso (UTEP). These two facilities combined host 88 percent of all PSEs with attendance over 10,000 and 44 percent of all PSEs with attendance over 5,000 in El Paso.
| Venue | Venue Type | Event days with more than 5,000 people | Event days with more than 10,000 people | ||
|---|---|---|---|---|---|
| Number of PSE event days annually | Percent of Total (%) | Number of PSE event days annually | Percent of Total (%) | ||
| Cohen Stadium | Stadium | 24 | 9.8 | 0 | 0.0 |
| Canutillo Stadium | Stadium | 1 | 0.4 | 0 | 0.0 |
| El Paso County Coliseum | Stadium | 30 | 12.3 | 5 | 5.4 |
| Sun Bowl Stadium | Stadium | 12 | 4.9 | 12 | 12.9 |
| Don Haskins Center | Arena | 95 | 38.9 | 70 | 75.3 |
| SISD Activity Complex | Arena | 15 | 6.1 | 0 | 0.0 |
| Street Events | Street | 4 | 1.6 | 4 | 4.3 |
| Park Events | Park | 6 | 2.5 | 1 | 1.1 |
| El Paso Convention Center | Convention Center | 16 | 6.6 | 0 | 0.0 |
| Sunland Park Racetrack | Racetrack | 41 | 16.8 | 1 | 1.1 |
| Total | |
244 | 100.0 | 93 | 100.0 |
| Note: Due to rounding the percentages do not add up to 100. | |||||
Exhibit 5-5 lists PSE event days by activity categories. As discussed above, the majority of events are sporting, graduation, and concert events hosted at UTEP.
| Activity Category | Activity | Events Days W/ More Than 5,000 People | Events Days W/ More Than 10,000 People | ||
|---|---|---|---|---|---|
| Number of PSE Event Days Annually | Percent of Total (%) | Number of PSE Event Days Annually | Percent of Total (%) | ||
| Professional Team Sports | Professional Football | 0 | 0.0 | 0.0 | |
| Professional Team Sports | Professional Baseball | 0 | 0.0 | 0.0 | |
| Professional Team Sports | Professional Basketball | 0 | 0.0 | 0.0 | |
| Professional Team Sports | Professional Ice Hockey | 0 | 0.0 | 0.0 | |
| College & High School Sports | College & HS Football | 23 | 9.4 | 12 | 12.9 |
| College & High School Sports | College & HS Basketball | 42 | 17.2 | 17 | 18.3 |
| College & High School Sports | Other – College Baseball | 12 | 4.9 | 0.0 | |
| Racing | Auto Racing | 0 | 0.0 | 0.0 | |
| Racing | Horse Racing | 41 | 16.8 | 1 | 1.1 |
| Racing | Other – Boat Racing | 0 | 0.0 | 0.0 | |
| Golf | Golf Tournaments | 0 | 0.0 | 0.0 | |
| Concerts | Concerts | 43 | 17.6 | 12 | 12.9 |
| Marathons | Marathons | 1 | 0.4 | 1 | 1.1 |
| Parades | Parades | 1 | 0.4 | 0 | 1.1 |
| Fairs | Fairs | 5 | 2.0 | 0.0 | |
| Festivals | Festivals | 8 | 3.3 | 8 | 8.6 |
| Protests / Political Events | Protests / Political Events | 0 | 0.0 | 0.0 | |
| Expositions & Shows | Expositions & Shows | 20 | 8.2 | 0 | 0.0 |
| Other | Other | 48 | 19.7 | 41 | 44.1 |
| TOTAL | |
244 | 100.0 | 93 | 100.0 |
| Note: Due to rounding, the percentages do not add up to 100. | |||||
College and high school sports account for 31 percent of PSEs with attendance over 10,000, while concerts account for another 13 percent. The large "Other" category includes university and high school graduations, university events, rodeos, and fairs hosted in stadiums. This category accounts for about 49 percent of all PSEs with attendance over 10,000.
Traffic Effects
The annual delay per traveler in El Paso attributable to PSEs that host more than 10,000 attendees is between 0.5 and 1.1 hours per year for every traveler. The wasted fuel per traveler due to PSEs is between 0.4 and 0.7 gallons per year. Cumulatively, the travel delay is between 193,000 and 387,000 hours in the El Paso area, while the excess fuel consumed is between 128,000 and 256,000 gallons per year. The cost of congestion is between $4 million and $7 million dollars per year. The results of the congestion analysis for the El Paso area are summarized in Table 5-6.
| Congestion Category | Units | AM Peak (44%) | PM Peak (56%) | PSE Caused (4%) | PSE Caused (8%) | Totals |
|---|---|---|---|---|---|---|
| Average Delay per Traveler | Hours | 10.6 | 13.4 | 0.5 | 1.1 | 24 |
| Wasted Fuel per Traveler | Gallons | 7.1 | 8.9 | 0.4 | 0.7 | 16 |
| Travel Delay | Hours | 3,838,496 | 4,836,504 | 193,460 | 386,920 | 8,675,000 |
| Excessive Fuel Consumed | Gallons | 2,542,035 | 3,202,965 | 128,119 | 256,237 | 5,745,000 |
| Congestion Cost | $ Million | $70 | $89 | $4 | $7 | $159 |
The major congestion factor when considering college and high school football is the day on which the game is played. The majority of college football games are played on weekends, either Saturday afternoons or Saturday evenings. The cost of congestion is relatively low, because games do not occur during peak commuting periods. Similarly, the majority of the congestion caused by the games affects attendees, and the percentage of non-attendees affected by the planned special event is much lower. In addition, college football tends to attract a large amount of students who walk to the games from campus, greatly reducing congestion on the roadways.
Finally, college football games attract many tailgaters, who tend to arrive much earlier than game time and stay after the completion of the game. Since attendee arrivals and departures are spread out, roadway congestion is further reduced. College football is a very good example of how timing of the event and type of event affects congestion.