Office of Operations
21st Century Operations Using 21st Century Technologies

Traffic Analysis Toolbox Volume V:
Traffic Analysis Toolbox Case Studies – Benefits and Applications

4.0 Project Development

A wider range of tools with more detailed output capabilities is needed when transportation-related projects move into the development stage. Here, the focus is usually on geometric considerations, operational characteristics, or both. The practitioner will need access to a variety of analysis tools depending on accuracy and display-ability requirements of the audience. Many such tools have been developed and can be effectively applied within the realms of sketch planning, design/operational analyses, and even simulation. The table below introduces three real-world case studies used in the remainder of this chapter to demonstrate benefits that can be achieved through proper application of these tools in project development environments.

Type of Analysis Real-World Case Study
4.1 Sketch Planning Carman/Quarry/Meadows Intersection Layout and Roundabout Analysis
Lake Oswego, Oregon
4.2 Operational/Design Evaluation Bridgeport Village Shopping Center Development
Tualatin, Oregon
4.3 Simulation Analysis and Display K Street Busway Transit Alternatives Analysis
Washington, DC

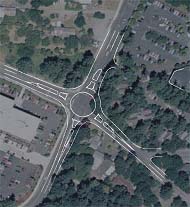
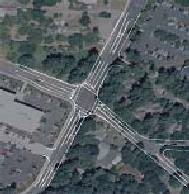
4.1 Sketch Planning Case Study – Intersection Layout and Roundabout Analysis

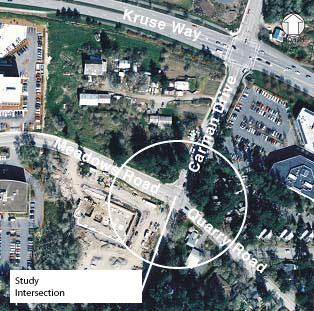
Sketch planning traffic analysis tools were used to develop design alternatives to address both operational and safety issues at the Carman/Quarry/Meadows intersection in Lake Oswego, Oregon. Using only basic turning volume information, the tools predicted the number and configuration of lanes required for different types of intersection control. This approach saved substantial time and money, and laid the groundwork for the final design activities.

Carman/Quarry/Meadows Intersection – Lake Oswego, OR
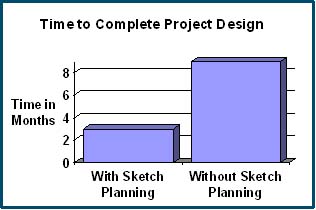
Key Benefits

  • Data required is minimal and readily available in most cases
  • Allowed for the consideration of multiple alternatives in a time and cost efficient manner

Other Considerations

  • Sketch planning products can give decision makers an understanding of the big picture, even though modifications and greater detail is sometimes necessary through detailed design.
aerial photograph of the study intersection and surrounding area. Carman Drive runs north-south, with Quarry Road-Meadows Road traversing east-west. The photo shows the wooded environment of the study area with office park developments in the north-east and south-west intersection quadrants, a residential home in the south-east quadrant, and a vacant parcel in the north-west quadrant.

Designing the Intersection

Sketch planning of intersection improvements helped the public visualize the various scenarios being considered for improving safety at an all-way stop controlled intersection. The sketches illustrated specific impacts to adjacent properties and were the first step towards identifying a preferred improvement alternative for implementation.

Context Appropriate Alternatives

The neighborhood and adjacent property owner's key concerns were focused on environmental, accessibility, livability, and safety issues, as opposed to pure intersection traffic operations. As such, consideration of the surrounding system, and adjacent land uses was required to develop context-appropriate alternatives.

design alternative developed for the study intersection, created by placing sketches over an aerial photo. The sketch is a modern single-lane roundabout design reflecting the functional geometric characteristics and right-of-way impacts of this alternative.

Minimum Data Required

Sketch planning allows for efficient development and comparison of project alternatives, given the minimal data and effort required. Typically, it is only necessary to use:

  • Aerial photograph
  • Existing right-of-way limits
  • Preliminary operational results
another design alternative developed for the study intersection, created by placing sketches over an aerial photo. The sketch is a signalized intersection design including left and right turn lanes on the intersection approaches. It reflects the functional geometric characteristics and right-of-way impacts of this alternative.

Relative Outputs

With this basic data, the sketch planning tool can determine:

  • Basic geometric layouts
  • Magnitude of right-of-way needs
  • Property/environmental impacts
  • Relative assessment of established evaluation criteria
bar graph reflecting the time to complete the project design with and without implementation of a sketch planning tool. The graph indicates that with sketch planning the design was completed in 3 months. Without the use of the sketch planning tool, it is estimated that the design would have taken 9 months to complete.

Time Effectiveness

Sketch planning facilitated the alternatives evaluation and decision making process in a time efficient manner:

  • By reducing the initial effort involved, the decision on the preferred alternative was completed in minimal time
  • For each alternative, potentially fatal feasibility issues were identified before significant time was invested in refined analysis

Cost Effectiveness

  • The sketch planning tool saved engineering time as unpromising alternatives were identified and discarded in the early stages of evaluation, without requiring detailed examination or refinement to final stages of design implementation
  • By minimizing the number of alternatives taken to refined evaluation and design, there was a cost savings of approximately 35% in engineering and design fees.

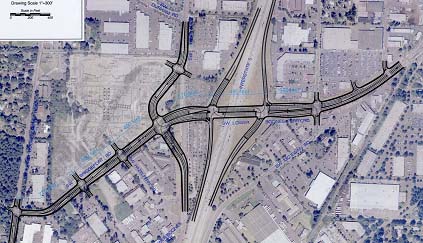
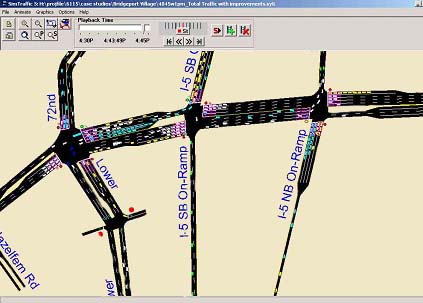
4.2 Operational/Design Case Study – Traffic Impact Study

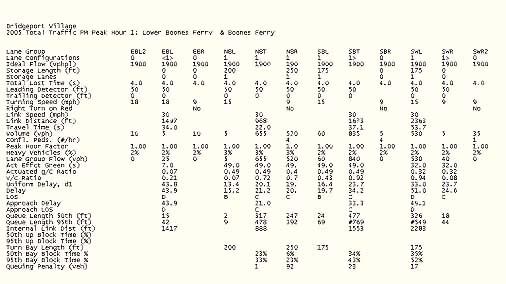
In the project development process, HCM and/or other analytical methods provide the kind of detailed analysis that is needed to make decisions such as required number of travel lanes at intersections, length of queue storage required for each turning movement based on signal timing assumptions, and assorted other details. The detailed analysis helps provide the technical support for a list of improvements required for project development.

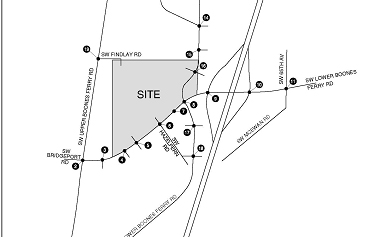
Bridgeport Village Shopping Center Development – Tualatin, OR

Key Benefits

  • Estimated the impact of the development on the transportation network
  • Considered the physical layout of improvements in concert with the analytical analysis lead to a comprehensive solution.

Other Considerations

  • These procedures require an iterative approach regarding assumptions for design and operations
double line sketch drawing laid out on an aerial view site plan. The sketch is of the SW Lower Boones Ferry Road and I-5 interchange area and shows the lane configuration and queue storage at the intersections.

Adequacy of Analysis

In the Bridgeport Village project, a 466,000 sq. ft. mixed use development located adjacent to a congested interchange was being considered. The analytical method provided outputs that were adequate for evaluation of the impact of the alternatives.

The analytical method evaluated the delay (level-of-service), capacity (volume-to-capacity ratio) and queuing (95th-precentile queue estimates) at the intersections and met the City's requirements. Geometric design of the roadway needed further refinement and had to be tested within the analysis.

drawing showing the layout of the roadway network around the site with numbered intersections and driveways. The intersection numbers correspond to bubbles (not pictured) that show the turning movements traffic volumes at the intersection. A partial bubble is shown in the figure for intersection nine.

Cost and Time Effective

Various single and double line drawings were used to evaluate alignment alternatives and help focus the analytical analyses. Queue interactions between closely spaced intersections were carefully scrutinized in the analytical models, prior to a more rigorous evaluation such as microsimulation.

The analytical method can be data intensive and costly if numerous alternatives with different volumes, geometry and signal timing scenarios are to be analyzed. Significant time and budget can be saved if only the most viable alternatives are analyzed in detail.

screen capture of a SimTraffic simulation model. The figure shows the area around the SW Lower Boones Ferry Road and I-5 interchange, with small rectangles representing vehicles on the roadway. The figure shows some of the vehicles queuing at the intersections.

Queue Interaction

The HCM procedures are insufficient for addressing issues related to closely spaced signalized intersections, and so additional modeling of queue interaction was used to confirm assumptions used in the analytical model.

screen capture of the Synchro model output for the 2005 Total Traffic PM Peak Hour. The output shows various parameters (Lane Group, Lane Configuration, etc.) on the right side of the figure on the different rows. The columns are separated into turning movements (EBL2, EBL, etc.).

Improved Understanding

The Bridgeport Village project benefited from the full range of output capabilities that were available. Standard tabular output served to document analysis results and quantify key design parameters that would be necessary in the subsequent design effort. Visual animation was useful to both the engineers (who used it to confirm the reasonableness of input data) and to the reviewers, who could see more clearly the differences among the alternatives.

Pedestrian Consideration

The HCM procedures address issues related to pedestrian timing needs at signalized intersections, which is an often-overlooked issue. In this case, pedestrian timing needs were included in the analysis and calculated based on roadway widths from the geometric design alternatives.

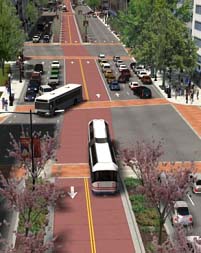
4.3 Traffic Simulation Model Case Study – Transit Alternatives Analysis

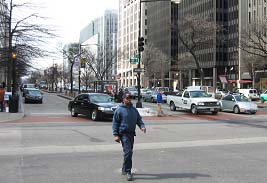
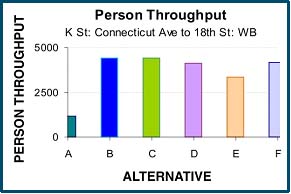
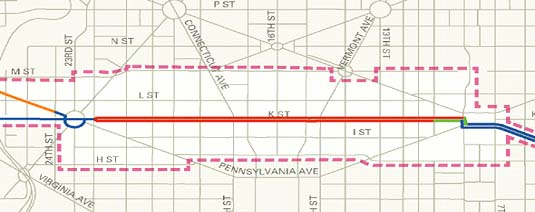
The K Street Busway Study assessed a proposed busway that included transit service planning and detailed simulation analysis. Simulation was used to determine the effects of street reconstruction on all modes, to contrast the alternatives, and to determine a recommended solution that met the City's policies.

K Street Busway – Washington, D.C.

Key Benefits

  • Evaluation of impacts on all modes over several scenarios
  • Efficient communication of project outcomes to stakeholders and decision makers

Other Considerations

  • Detailed information is needed on design and operational characteristics
simulated image of a busway

Clear communication of the project

The busway provided exclusive right-of-way for buses throughout the corridor. Animation was used to communicate the nature of the changes to the corridor to the public. Project engineers indicate that the visualization significantly improved project comprehension.

cutout section of a map of the Washington, DC, area. K Street is highlighted to show the proposed location of the busway. K Street parallels Pennsylvania Avenue on this grid section of the DC metropolitan area map.

Assessment of alternatives

The project evaluated alternatives to improve the person carrying capacity for the K Street corridor in Washington, D.C. Transit service alternatives were tested to insure the person carrying capacity of the busway was maximized and the public was amenable to the changes proposed.

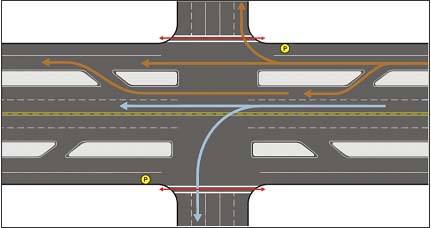
Microsimulation can assess a much wider range of issues present in the corridor including effects to general automobile traffic, pedestrians, and existing and proposed bus service. This allows for decisions to be made while considering all modes.

Another important dimension of this project is the complexity of the analyses that was performed. As a dense urban area, pedestrian interaction throughout the boulevard required careful consideration of the interaction of pedestrians and vehicle movements that are rarely encountered.

photograph of a man crossing a street that intersects K Street in the area of study. At the intersection shown, there is a pullout area along K Street for buses and other access to local businesses. Pedestrian interaction within the boulevard was analyzed as part of the study.

Microsimulation

Microsimulation provided an output for assessing the capacity of a busway under a variety of scenarios, which lead to modifications to a transit service plan and transportation capacity calculations.

bar graph of several person throughput scenarios

Pedestrian Interaction

Pedestrian interaction within the boulevard was carefully considered in the project because access to transit was important to the public. Pedestrian accessibility to transit was an important element in the project that was explicitly modeled in the simulation.

drawing that illustrates vehicle and bus movements through the use of sketch planning along the boulevard. An overhead view of the boulevard is shown (including the proposed busway) along with the movements of vehicles and buses. The sketch planning example shown was an important tool in identifying the movements of each mode for the purposes of determining the appropriate signal priority treatments.

Sufficient analysis of a boulevard

A boulevard is a complex confluence of movements (traffic and otherwise), which could not be effectively analyzed using the HCM procedure for urban streets. Elements of sketch planning methods were used to determine appropriate treatments of signal priority, but the simulation provided person throughput and other important measures.

Office of Operations