For More Information: http://www.ops.fhwa.dot.gov/freight/index.cfm
Contact Information: FreightFeedback at FreightFeedback@dot.gov
This publication is an archived publication and may contain dated technical, contact, and link information.

Cost-Benefit Methodology
The economy is growing, fueled by increases in international trade. In 2004, international trade accounted for nearly 25 percent of U.S. gross domestic product and is predicted to continue to grow. The downside of this growth is that increases in the volume of trade are stressing our transportation network. When transportation system performance decreases, the economy pays a price.
To relieve this stress, a mix of public and private sector approaches and investments are needed. On the private-sector side, for example, ports and companies are now working together to extend port terminal hours to accommodate the movement of freight at night and on weekends. The use of universal chassis pools is also under consideration to improve the efficiency of freight movement. On the public-sector side, federal and state governments continue to make infrastructure improvements and investments in intelligent transportation technologies to provide real-time travel and gateway clearance information to enhance the performance of vehicles and operators. Still, many additional opportunities exist to improve efficiency and reliability.
The Federal Highway Administration (FHWA) is working with its partners to evaluate potential technological solutions to improve the reliability, efficiency, and security of the freight transportation system. Technology evaluation is a complex process requiring analysis of many factors, including freight transportation needs, supply chain performance, costs, and benefits. Not surprisingly, the complexity increases as the number of criteria and parties involved rises.
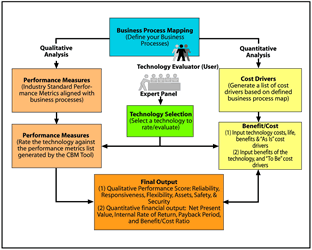
Recognizing the need for evaluation tools to sift through technology options, FHWA is developing the Cost-Benefit Methodology (CBM) framework. The framework is aimed at giving decisionmakers the information and tools needed to invest wisely and prioritize future projects. Making good investment choices for the transportation system is critical to enhancing America's economic productivity and global connectivity.
CBM combines and customizes well-defined and accepted industrial engineering approaches and benchmarking and uses best practices to determine the costs and benefits of using a particular technology or launching a new project to improve supply chain efficiency. Industrial engineering approaches capture the current state of the supply chain, which serves as a starting point for optimizing efficiency. Benchmarking quantifies the operational performance of similar supply chains, identifies the best ones, and establishes targets for improvement. The best practices are identified as a way to reach desired performance.

CBM also identifies the freight technology needs of a business through the use of field reports, surveys, historical data, freight demand projections, and best practices. Needs are then married to requirements and potential technologies are then identified. The above sample final output table shows both the qualitative & quantitative results of an evaluation of several example technologies using the CBM framework. By using the CBM methodology, decisionmakers can measure the economic efficiency of a proposed technology or project and target investments dollars where the payoff is greatest.
Design of the CBM framework is completed, and its testing and validation are now underway. During August and September 2005, data were collected on the business processes (e.g., dispatching drivers and cargo) and cost drivers (e.g., fuel consumption) of two intermodal freight projects. These data are now being analyzed to determine a particular technology's effect on a company's business processes. The final methodology framework is scheduled for delivery in mid 2006.
| Intermodal database(IDB) | Wireless Dispatch | IDB + Schedule | Cellphone + IDB + Schedule | |
|---|---|---|---|---|
| Qualitative Summary | ||||
| Reliability Score | 16 | 24 | 24 | 24 |
| Responsiveness Score | 12 | 10 | 15 | 18 |
| Flexibility Score | 12 | 14 | 12 | 10 |
| Cost Score | 34 | 21 | 21 | 14 |
| Asset Management Score | 11 | 11 | 22 | 28 |
| Safety Score | 0 | 0 | 0 | 7 |
| Security Score | -3 | -3 | -9 | -5 |
| Total Score | 82 | 77 | 85 | 96 |
| Quantitative Summary | ||||
| Initial Investment | $100,000.00 | $175,000.00 | $300,000.00 | $360,000.00 |
| Net Annual Cash Flow | $13,020.25 | $23,235.44 | $62,194.09 | $92,766.24 |
| Net Present Value | $49,357.00 | $88,080.60 | $235,764.53 | $351,657.04 |
| Internal Rate of Return | 21.05% | 21.40% | 31.22% | 37.60% |
| Payback (years) | 2.54 | 2.52 | 2.12 | 1.92 |
| Discounted Payback (years) | 3.07 | 3.05 | 2.5 | 2.23 |
| Benefit-Cost Ratio | 1.49 | 1.50 | 1.79 | 1.98 |
Scores, including the total score, have no theoretical maximum or minimum.
|
For more information, please contact Randy Butler 202-366-9215 Randy.Butler@fhwa.dot.gov October 2005 FHWA-HOP-05-060 EDL 14143 |

U.S. Department of Transportation Federal Highway Administration |
|
Office of Freight Management and Operations, 400 7th Street, SW, Room 3401, Washington, D.C. 20590
http://www.ops.fhwa.dot.gov/freight/, Toll-free help-line 866-367-7487 |
|