Freight Performance Measurement:
Travel Time in Freight-Significant Corridors
U.S. Department of Transportation
Federal Highway Administration
QUALITY ASSURANCE STATEMENT
The Federal Highway Administration (FHWA) provides high-quality information.to serve Government, industry, and the public in a manner that promotes, public understanding. Standards and policies are used to ensure and maximize the quality, objectivity, utility, and integrity of its information. FHWA periodically reviews quality issues and adjusts its programs and processes to ensure continuous quality improvement.
Preface
THE FREIGHT PERFORMANCE MEASURES INITIATIVE IS A FEDERAL HIGHWAY ADMINISTRATION (FHWA) EFFORT TO MEASURE SPEED AND TRAVEL-TIME RELIABILITY ON FREIGHT-SIGNIFICANT CORRIDORS AND CROSSING AND DELAY TIME AT MAJOR U.S. LAND BORDER CROSSINGS. THIS REPORT, BASED ON THE FIRST FULL YEAR OF DATA FOR FIVE FREIGHT-SIGNIFICANT CORRIDORS, PRESENTS INITIAL RESEARCH FINDINGS. THIS RESEARCH ESTABLISHES A FOUNDATION FOR WORKING WITH REGIONAL, STATE AND LOCAL TRANSPORTATION AGENCIES AND THE FREIGHT INDUSTRY TO FURTHER REFINE THIS WORK AND DEVELOP TOOLS AND PRODUCTS TO MEET A MYRIAD OF FREIGHT DATA NEEDS.
Contents
- Introduction
- National Context
- Travel Time Methodology
- Factors that Affect Speed and Reliability of Freight Movement
- 2005 FPM Data Analysis
- Next Steps
- Conclusion
- References
- Appendix
Introduction
In 2004, transportation-related goods and services accounted for more than 10 percent—over $1 trillion—of U.S. Gross Domestic Product (GDP). Only three sectors—housing, health care, and food—contributed a larger share to GDP (USDOT RITA BTS 2006). The U.S. Department of Transportation (USDOT) recognizes that the efficient and reliable movement of goods and people is critical to the U.S. economy.
In May 2006, the Department announced the National Strategy to Reduce Congestion on America's Transportation Network. The Strategy acknowledges that “congestion is one of the single largest threats to our economic prosperity and way of life,” and costs America an estimated $200 billion a year. The Strategy also notes that growing congestion reduces the economic benefits derived from the movement of freight. For trucking companies, congestion diminishes productivity and increases the cost of operations, as drivers must be paid for time spent making deliveries as well as time spent stalled or stopped in traffic. Additionally, congestion results in decreased fuel efficiency and increased vehicle maintenance costs resulting from stop-and-go traffic conditions. Congestion also contributes to societal costs such as decreases in air quality and increases in the cost of consumer goods.
Studies of America's metropolitan areas show that highway congestion is a major problem and getting worse, particularly for commuters. There is growing evidence that congestion is not just a big city problem anymore nor is it confined to people trying to get to and from work. Highway congestion extends to the suburban fringe, smaller cities, rural areas, and border crossings. It also extends from “rush hour” to any time of the day or night and on weekends.
Historically, congestion data collection efforts focused on commuting problems in urban areas. Consequently, little data exist on congestion and delay experienced by trucking companies when transporting goods from their origin to their destination. To meet this and other freight data needs, FHWA launched the Freight Performance Measurement (FPM) initiative in 2002. The initiative centers on collecting intercity travel time data on freight-significant corridors and at international land border crossings. The effort complements other FHWA efforts to monitor and measure urban congestion. Combining FPM data with urban congestion data provides a more complete picture of surface transportation system performance and identifies areas where performance could be improved.
To support the FPM initiative, FHWA established a partnership with the American Transportation Research Institute (ATRI) to determine whether and how information derived from communications technologies used by the freight industry could provide FHWA with data to support the measurement of freight performance on the surface transportation system. ATRI worked with technology vendors and motor carriers to demonstrate that data from automatic vehicle location (AVL) technologies could be used to derive measures of speed and reliability on specific Interstate routes.
This report provides a preliminary analysis of travel time (speed and reliability) in five freight-significant corridors based on data from calendar year 2005, the first full year for which data are available. The report begins with the national context for truck speed and reliability research and then describes FPM data collection efforts. Next, the report discusses the factors that affect highway speed and reliability, moves on to an analysis of each of the five corridors, and concludes with an overview of next steps and future areas of research.
National Context
Commercial truck traffic, measured in vehicle-miles traveled, has doubled over the past two decades, spurred on by economic growth and international trade that now amounts to approximately 25 percent of gross domestic product (GDP) (USDOT FHWA 2006). According to estimates from FHWA's Freight Analysis Framework, trucks carried about two-thirds of the value of goods and 60 percent of the tons moved in 2002 (US DOT FHWA 2006). The FAF also estimates that 25,000 miles of the highway system carry over 5,000 trucks each day and approximately one-fifth of those miles are significantly congested (USDOT FHWA 2002).
During this same period, passenger traffic doubled as well. These large volume increases are overwhelming existing capacity and placing a strain on the physical condition and performance of the highway network. This is particularly true in highly traveled areas and corridors. According to an estimate by the Texas Transportation Institute (TTI), congestion in 85 urban areas around the country tripled in total between 1982 and 2003. Congestion in 2003 caused 3.7 billion hours of travel delay at a cost of $63 billion (TTI 2005). As these stresses and strains multiply, businesses are finding it increasingly difficult to move goods swiftly and reliably.
The trucking industry's ability to respond to the Nation's growing economy requires a transportation system that facilitates the timely and efficient movement of goods. Congestion affects the industry's ability to respond to customer requirements and directly affects the cost of goods bought and sold in the United States. One estimate puts the cost of carrying freight on the highway system at between $25 and $200 an hour depending on the type of product and other factors (USDOT FHWA 2001). Congestion also causes productivity losses. The most obvious productivity losses relate to fuel efficiency and the trucking industry's ability to predict and meet delivery times. Missed deliveries to manufacturing plants and retail outlets can halt production and hinder sales. Less obvious are the effects that congestion has on the industry's ability to hire and retain drivers and the number of available hours of service.
The reliability of the highway system—enabling goods to get where they need to be, when they need to be there—is now recognized as a very important performance indicator. Unexpected delays can increase the cost of transporting goods by 50 to 250 percent (USDOT FHWA 2001). Shippers, particularly those employing just-in-time management techniques expect freight carriers to deliver goods on time, in the right amount, and undamaged. Efficient and reliable goods movement produces numerous benefits for businesses. It enables them to respond rapidly to changes in customer and consumer demand, to shorten product cycle times, and to reduce inventory. The Council of Supply Chain Management estimates that since 1991 inventory costs have declined by about 60 percent (The Economist 2006). Additionally, the reliability of the transportation system influences logistics decisions, such as the number and location of manufacturing plants and distribution centers, that affect regional, state, and local economies.
Solutions to the strains placed on the Nation's highway system by increases in freight and passenger movements require both long-term and short-term actions. In some instances freight congestion and delay can only be addressed by adding capacity. In other instances, changes in the operations and management of the system can produce positive change. In the public sector, many operations strategies focus on addressing the causes of non-recurring congestion such as incidents and work zones and better demand management. In the private sector, strategies center on operational changes such as shifting hours of operations of shipment facilities (e.g., distribution centers), optimizing route selection (e.g., comparing travel times of the shortest route with a longer less-direct route), improving shipment planning (e.g. shipper providing more precise information on load times, weights), and load optimization.
Future success in addressing highway system needs will require development of a systematic approach for identifying priorities and allocating scarce resources to projects that will have the greatest impact. At the federal, state and local levels there are different ways to prioritize a project. The speed and reliability data produced by the FPM initiative can be additive to other data used to prioritize projects and make investment decisions.
Travel Time Methodology
DATA COLLECTION
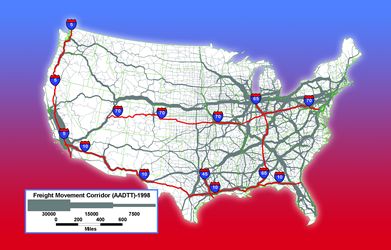
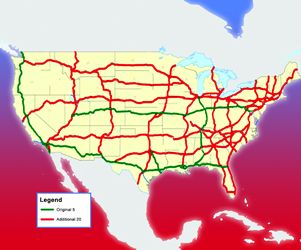
ATRI and FHWA collected data on five freight-significant corridors: Interstate 5, Interstate 10, Interstate 45, Interstate 65, and Interstate 70—from automatic vehicle location equipment aboard approximately 250,000 trucks nationwide. Using an anonymous randomly generated identification number to maintain the confidentiality of truckers and trucking companies, position (latitude and longitude) and time and date data are received from trucks at predetermined intervals. These data are then matched to latitude and longitude coordinates of the five Interstates analyzed in this research. When a match is made, the data are recorded in a database. More than 14 million records are contained in the database for 2005.
According to the 1998 Freight Analysis Framework (FAF), the five corridors account for nearly 25 percent of commodity-carrying truck vehicle-miles traveled. Map 1 shows the five Interstates superimposed on an estimate of daily truck traffic. Table 1 lists the states and selected major cities on or near each Interstate route.
| Interstate Route | State | Total Miles | MAJOR CITIES SERVED (Population larger than 5,000) |
|---|---|---|---|
| I-5 | California | 796.53 | San Diego, Los Angeles, Stockton, Sacramento, Red Bluff, Anderson, Redding, Eureka |
| I-5 | Oregon | 308.14 | Ashland, Medford, Grants Pass, Roseburg, Eugene, Salem, Portland |
| I-5 | Washington | 276.62 | Vancouver, Kelso, Chehalis, Centralia, Olympia, Tacoma, Seattle, Everett, Mt. Vernon, Bellingham |
| I-5 | TOTAL | 1,381.29 | |
| I-10 | California | 242.54 | Santa Monica, Los Angeles, Pomona, Ontario, San Bernardino, Beaumont, Banning Indio, Blythe |
| I-10 | Arizona | 392.33 | Phoenix, Casa Grande, Tucson |
| I-10 | New Mexico | 164.27 | Lordsburg, Deming, Las Cruces |
| I-10 | Texas | 881 | El Paso, Ft. Stockton, Kerrville, San Antonio, Houston, Beaumont, Orange |
| I-10 | Louisiana | 274.42 | Lake Charles, La Fayette, Baton Rouge, Kennery, New Orleans |
| I-10 | Mississippi | 77.19 | Gulfport, Biloxi, Pascagoula |
| I-10 | Alabama | 66.31 | Mobile |
| I-10 | Florida | 362.28 | Pensacola, Tallahassee, Jacksonville |
| I-10 | TOTAL | 2,460.34 | |
| I-45 | Texas | 284.91 | Galveston, Texas City, Houston, Huntsville, Corsicana, Ennis, Dallas |
| I-65 | Alabama | 367.00 | Mobile, Greenville, Montgomery, Clanton, Birmingham, Cullman, Decatur, Athens |
| I-65 | Tennessee | 121.71 | Nashville |
| I-65 | Kentucky | 137.32 | Bowling Green, Elizabethtown, Louisville |
| I-65 | Indiana | 261.27 | New Albany, Seymour, Columbus, Franklin, Indianapolis, Lebanon, La Fayette, Gary |
| I-65 | TOTAL | 887.30 | |
| I-70 | Utah | 232.15 | Cove Fort, Richfield, Green River |
| I-70 | Colorado | 451.04 | Grand Junction, Denver |
| I-70 | Kansas | 424.15 | Goodland, Hays, Russell, Salina, Abilene, Junction City, Topeka, Lawrence, Kansas City |
| I-70 | Missouri | 251.66 | Kansas City, Boonville, Columbia, St. Louis |
| I-70 | Illinois | 135.94 | East St. Louis, Vandalia, Effingham |
| I-70 | Indiana | 156.6 | Terre Haute, Indianapolis, Richmond |
| I-70 | Ohio | 225.6 | Springfield, Columbus, Zanesville, Cambridge |
| I-70 | W. Virginia | 14.45 | Wheeling |
| I-70 | Pennsylvania | 167.92 | Washington, Monessen-Charleroi, Breezewood |
| I-70 | Maryland | 93.62 | Hancock, Hagerstown, Frederick, Baltimore |
| I-70 | TOTAL | 2,153.13 |
SOURCE: Extracted from Main Routes of the Dwight D. Eisenhower National System Of Interstate and Defense Highways as of October 31, 2002 at https://www.fhwa.dot.gov/reports/routefinder/table1.htm
CALCULATING SPEED AND RELIABILITY
The reporting of location and time along a route enables the calculation of average speed for each truck on a specific road segment. The speeds of multiple trucks are then aggregated to determine average speed on a road segment.
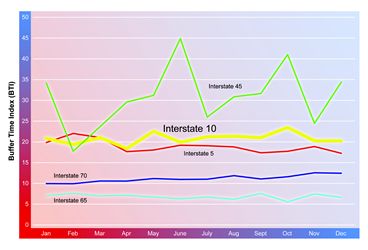
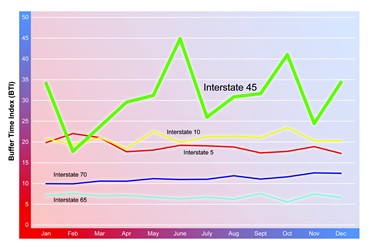
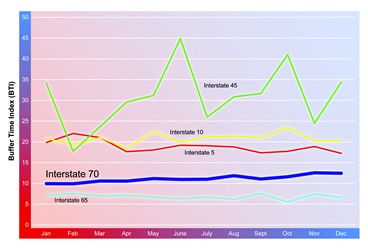
Speeds are then used to calculate travel time reliability, using a buffer index (BI) that is similar to the measure developed by the Texas Transportation Institute and used in FHWA's urban congestion monitoring program. BI describes how much more time needs to be budgeted to make a trip on time at a given level of certainty. It is unlikely that shippers and receivers would accept a situation in which only half of trip arrivals are on time. A more likely scenario is that shippers and receivers expect on-time arrival 95 percent of the time. This translates to being on time on 19 out of 20 trips. In this report, BI is calculated using 95 percent on-time arrival rate.
Factors that Affect Speed and Reliability of Freight Movement
A wide range of factors affect truck speed and travel-time reliability, including terrain, infrastructure design and capacity, weather, incidents, work zones, and time of travel. These factors are discussed here. Appendix A provides examples of how FPM data can be used to show the effects these factors have on freight movement.
TERRAIN: Landscape features can dramatically affect the speed of commercial trucks, unlike most passenger vehicles. Mountainous regions, in particular, can dramatically slow heavy trucks on long inclines and downhill runs with tight curves. According to one study steep grade bottlenecks on freeways and arterials accounted for 66 million hours of truck delay in 2004. Places where steep grades are a problem include I-5 in the Californian counties of Kern and Siskiyou and the counties of Jackson, Josephine, Douglas, Marion in Oregon and I-10 in Riverside, CA (USDOT FHWA 2005a).
Largely immutable, the problems of terrain can sometimes be ameliorated by improvements in roadway geometry and changes in the operations of a facility. For instance, the I-70 Mountain Coalition's Travel Demand Management Plan suggests “increasing the availability of chain up, chain down, and parking/rest areas for trucks” as a strategy to improve operations of heavy vehicles in the mountainous areas of I-70. The Plan notes “winter truck accidents cause extensive delays and are often avoidable if the truck driver chained up his or her vehicle” (Interstate 70 Central Mountain Transportation Coalition 2006).
INFRASTRUCTURE: The sheer volume of traffic in relation to roadway capacity is the single biggest contributor to travel delay and unreliable travel times. It is estimated that 40 percent of congestion in urban areas is related to highway capacity constraints (USDOT FHWA, 2005b). As volumes have grown, so too have the fluctuations in demand that cause less reliable travel times. Some of the worst congestion is found in southern California. Los Angeles consistently ranks as the most congested urban area in the country and San Diego, an important border crossing, ranked 12th in 2003 (TTI 2005). Urban areas are important of course, but traffic volumes are also growing on highways beyond urban boundaries.
Nationally, according to the American Association of State Highway and Transportation Officials, investment in the highway system is not keeping up with growing demand and deterioration. In 2002, AASHTO estimated that an annual investment of $92.0 billion by all levels of government for highways and bridges would be necessary to maintain both physical condition and performance characteristics of the system over 20 years. They noted that in fiscal year 2000, $64.5 billion from all levels of government was invested in highway and bridge capital improvements. Additionally, AASHTO estimated that an annual investment of $125.6 billion by all levels of government for highways and bridges would be necessary to improve both physical condition and performance characteristics of the system over 20 years (AASHTO 2002).
The type of facility and its specific characteristics and design affect the speed and reliability of trucks. In this report only corridors defined by Interstate highways are examined. Interstate highways account for about 40 percent of truck vehicle-miles traveled (vmt) but only 3 percent of America's roadway lane miles (USDOT FHWA 2006). The specific characteristics of Interstates and other types of roads can also play a role in vehicle speed and reliability. Roadway characteristics that affect performance include the number and width of lanes, the presence or absence of shoulders, the form of merge areas at interchanges, and roadway alignment such as grades and curves.
While long-term infrastructure improvements are one solution to capacity constraints, short-term operational strategies can be employed to overcome limitations. Strategies include but are not limited to monitoring, detecting, verifying, responding to, and clearing incidents quickly; the use of high-occupancy vehicle lanes; ramp metering; traffic signal timing; advanced traveler information systems; electronic toll collection and screening; automatic enforcement of truck size and weight and safety laws; and high-occupancy toll lanes, truck-only lanes and truck-only toll (TOT)facilities.
Adding truck-only lanes (with or without a toll element) and truck bypass lanes to existing highway infrastructure may improve truck travel times and reliability on Interstates. Using four selected sections of I-10, the National I-10 Freight Corridor Study estimated that truck-automobile separation would save nearly $69.3 billion from 2002 to 2025, or $6.25 million annually per mile of improvement. The study used an average value of $25 per hour to estimate truck delay costs (Texas Department of Transportation 2002). A 2005 Georgia State Road and Tollway Authority study concluded that “TOT lanes hold substantial promise in not only improving commercial vehicle mobility, but also in improving the performance of the regional network of limited access highways and local roads (Georgia State Road and Tollway Authority 2005).
WEATHER: Adverse weather is estimated to account for 15 percent of all highway delay, with rain accounting for about 70 percent of the problem (USDOT FHWA 2005b). Most obviously, winter weather in the form of ice and snow can slow or stop vehicle movements for a few hours or even a few days in extreme cases. High winds are another problem for high-sided vehicles like commercial trucks. Less obvious, perhaps, sun glare can significantly affect vehicle movements.
One study estimates that each year trucking companies or commercial vehicle operators lose an estimated 32.6 billion vehicle hours due to weather-related congestion in 281 metropolitan areas. The study further notes that nearly 12 percent of total estimated truck delay is due to weather in 20 cities with the greatest volume of truck traffic. The estimated cost of weather-related delay to trucking companies ranges from $2.2 billion to $3.5 billion annually (http://www.ops.fhwa.dot.gov/weather/q1_roadimpact.htm).
The above estimate does not include catastrophic events such as floods and hurricanes that can have a major effect on the transportation system. In August 2005, Hurricane Katrina destroyed several parts of I-10. It was not until January 2006 that service was reestablished in both directions, albeit with speed restrictions and a ban on oversized and overweight traffic. I-10 was also damaged where it spans the Pascagoula River in Mississippi, and was restored in October 2005.
Road weather management practices such speed management improve safety by prompting drivers to adjust speed based on conditions. Roadway geometry, the volume of truck traffic and recreational travelers unfamiliar with local conditions contributed to a winter crash rate that was four times the annual average on I-90, Washington State's primary east-west route. Washington State DOT employs a speed management technique on a 40-mile segment of I-90 to improve roadway safety in fog, snow, and ice conditions. Although the primary reason for implementation is safety, (if the desired outcome of a reduction in winter crash rate is achieved), it is logical to expect improvements in mobility resultant from avoidance of incidents and associated clearance times (USDOT FHWA n.d.).
INCIDENTS: Highway incidents are a major impediment to the free flow of traffic, causing an estimated one-quarter of highway delay (USDOT FHWA 2005b). Major crashes are a significant source of incident-related delay, but just as important are less dramatic incidents such as “fender-benders” vehicle breakdown, and road debris. FHWA is working with states and localities to clear incidents more quickly and more safely. Its “Quick Clearance” and “Move-It” best practices are being used around the country to improve mobility and safety (I-95 Coalition 2003; TRB 2003). Such programs not only open roads more quickly thereby reducing congestion they also improve mobility and safety by cutting down on secondary accidents. An evaluation of the I-95 Traffic and Incident Management System (TIMS) in Philadelphia found that freeway closure time was cut by up to 55 percent, freeway incidents were reduced by 40 percent, and the incident severity rate was reduced by 8 percent (USDOT FHWA 2000a).
WORK ZONES: Overall, work zones cause about 10 percent of delay nationwide (USDOT FHWA 2005b). Road and bridge construction and maintenance are a necessary part of managing the highway system, yet also a significant cause of delay. Work zones cause congestion by altering the roadway environment and sometimes, through total shutdowns, the road network itself. Roadway changes include reducing the number of and/or width of travel lanes, lane shifts, and shoulder elimination. Construction equipment, personnel, and signs all create distractions that can lead to work-zone incidents and delay. It is estimated that over 3,000 work zones are in effect on the NHS during the summer, affecting about 13 percent of the NHS roadway (USDOT FHWA 2003).
Although work zones affect all road users, some techniques (e.g. night time operations) used to minimize the impact on commuters may have a disproportionate effect on trucks. Additionally, major construction projects that will significantly improve conditions can also cause major delay and congestion. For example, a Washington State DOT improvement project that will facilitate goods movement by adding three lanes to the narrow two-lane roadway required closing a designated truck lane on State Route 543 (Pacific Highway) for an entire year. The closure will affect trucks using the Pacific Highway border crossing and could impact passenger vehicles using the Peace Arch border crossing on I-5 (Washington State DOT 2006).
TIME OF TRAVEL: Speed and reliability on the highway system is heavily dependent on the specific time of travel. Trucks are often slowed by congestion in metropolitan areas due to the morning and evening rush period during the workweek. Increasingly, particularly in larger metropolitan areas, congestion occurs on the weekend as more and more driving is done to accomplish shopping, recreation, and other household activities. Interstate highways accommodate many of these local trips as drivers find them convenient. Although Interstates were conceived as limited access highways for intercity trips, closely spaced ramps allow Interstates to be used for short trips, contributing to congestion problems.
Trip timing can also be important in the case of planned special events and seasonal traffic patterns. Planned special events, such as sporting contests, concerts, and holiday parades, can also lead to highway congestion. For instance, the Indianapolis 500 motor race attracts more than 250,000 people annually, affecting highways for miles around. Tourism areas that are delay free for most of the year may experience major congestion problems during the peak-season. The Oregon Coast, the Tidewater region of Virginia, Branson, MO, Cape Cod, MA, and the New Jersey Shore were named as some of the areas with the worst summer traffic by one study (American Highway Users Alliance, et al., 2005).
2005 FPM DATA Analysis
This chapter presents an analysis of the five freight-significant corridors using FPM data collected in 2005.
CORRIDOR PROFILES
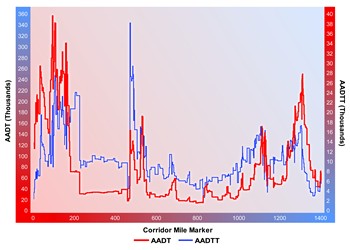
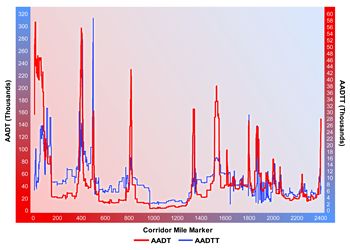
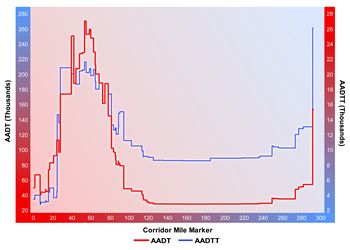
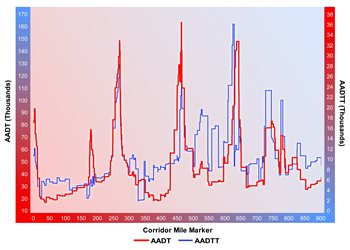
The first element of the profile is a map depicting the route, major cities served, and average annual truck speed. The second element of the profile is a graph depicting the Average Annual Daily Traffic (AADT) and Average Annual Daily Truck Traffic (AADTT) using 2004 data from FHWA's Highway Performance Measurement System (HPMS). The amount of freight moving by truck between origins and destinations on and near each corridor translates to the AADTT on any given segment. The AADT includes all types of passenger and freight vehicles.
While the corridor analysis presented in this report is largely limited to annual speed and reliability averages, in the future FPM will be used to better understand and quantify congestion and delay truckers experience enroute to their destination. Coupling FPM data with other available data, such as truck volumes and the value of goods moved between cities, will allow other measures to be formulated. Future measures might include the hourly value of delay per vehicle and annual vehicle hours of delay. Because truckers travel through multiple urban areas, and often through multiple states, corridor measures can be particularly useful in developing plans and allocating resources for freight projects of regional and national significance.
INTERSTATE 5 (I-5)
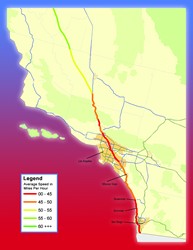
I-5 runs along the west coast of the United States from Blaine, WA on the Canadian border to San Diego, CA on the Mexican border, a distance of 1,381 miles. Some of the major cities I-5 passes through or near include Los Angeles, San Francisco, and Sacramento, California; Portland, Oregon; and Seattle, Washington. The southern and northern portions of I-5 have major U.S. land border crossings while the terrain in northern California and southern Oregon is particularly mountainous. On average, these areas had the slowest truck speeds (Map 2). I-5 passes through some of the largest urban areas in the United States, areas that suffer from high levels of congestion. As shown in Appendix A (Map A1), average truck speeds on I-5, through both the Los Angeles metropolitan area and the San Diego metropolitan area and through a mountainous area, known as the Siskiyou Pass, are relatively slower that other segments.
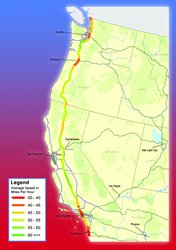
Figure 1 shows AADT and AADTT for I-5. These two traffic estimates are presented on different scales for readability. Traffic volume overall is greatest through the major metropolitan areas of southern California and through Portland and Seattle. There are also major spikes when I-5 passes near San Francisco and through Sacramento. Truck traffic follows these overall patterns, but with the highest traffic on the section of I-5 where it joins with I-205 going towards San Francisco (at about the 460 mile marker).
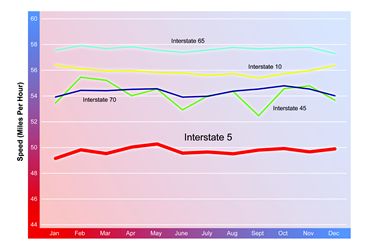
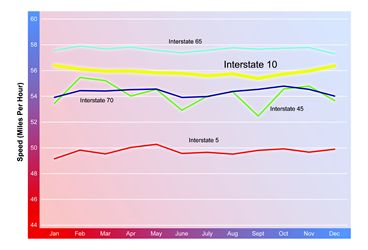
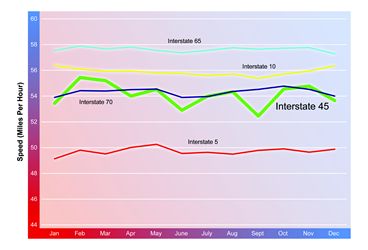
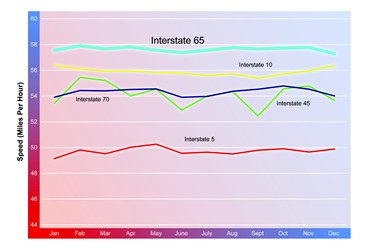
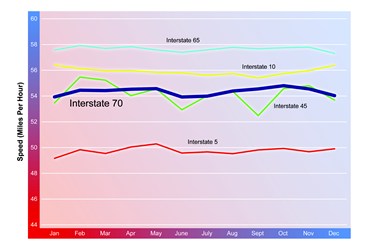
The average speed of trucks on the I-5 corridor is significantly lower overall than on other corridors analyzed in this report in part because many sections of I-5 are so heavily traveled and a large portion of the corridor has a maximum-posted truck speed of 55 miles per hour (mph). In 2005, the average speed of trucks on the I-5 corridor was around 50 miles per hour (mph), a speed that was relatively constant throughout the year.
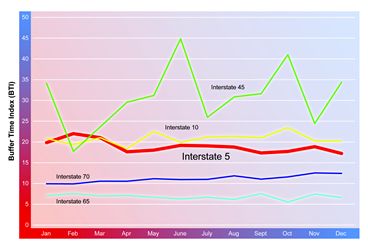
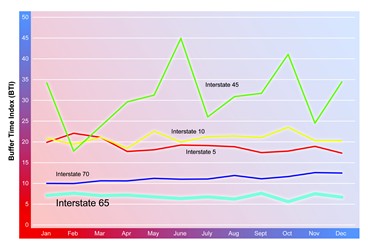
The buffer index (BI) for I-5 averaged 19 percent in 2005 with little variation throughout the year. Based on this result, I-5 is less reliable on average than I-65 and I-70, but about as reliable as I-10. Thus, while speeds are relatively slow on I-5, reliability is moderate (Figure 3).
Speed and reliability in the I-5 corridor in the future will be influenced by infrastructure improvements. One of the planned projects along the corridor includes the widening of I-5 from Salmon Creek, WA to I-205. Washington State Department of Transportation engineers estimate that if this improvement is not made, afternoon travel speeds in 2010 and 2020 would be 42 mph and 26 mph respectively. With the widening completed, however, average travel speeds in 2010 and 2020 are projected to increase to 60 mph and 50 mph respectively. Other I-5 projects include a widening of the road near Chehalis, WA and the building of a new interchange. This 40-mile section of I-5 from the Toutle River Safety Rest Area in Cowlitz County to the Maytown interchange in Thurston County is only two lanes in each direction. As a result, congestion is a problem, and even minor incidents can result in significant traffic backups. The new interchange is designed to improve the connection between the Port of Chehalis and I-5.
INTERSTATE 10 (I-10)
I-10 was designed as the cross-continental route for the southern tier of the United States. It connects eight states between Santa Monica, CA, a part of the Los Angeles metropolitan area, and Jacksonville, FL a distance of 2,460 miles. Some of the major cities I-10 passes through or near include Phoenix and Tucson, AZ; Las Cruces, NM; El Paso, San Antonio, Houston, and Beaumont, TX; Baton Rouge and New Orleans, LA; Mobile, AL; and Pensacola and Tallahassee, FL. In 2005 average truck speeds were greatest in the western parts of Arizona, New Mexico and Texas, and as expected major freight gateways such as Jacksonville, Los Angeles, El Paso, Houston, and New Orleans have significantly lower speeds (Map 3).
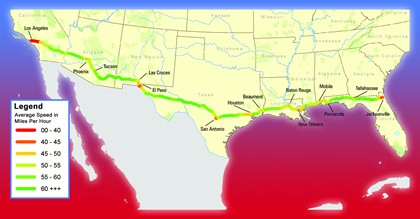
Figure 4 shows AADT and AADTT for I-10. These two traffic estimates are presented on different scales for readability. Traffic volume overall is greatest in the major metropolitan areas, particularly Los Angeles and Phoenix. Truck traffic follows these overall patterns, but with the highest traffic on the sections of I-10 near Tucson where I-19 comes in from the border crossing of Nogales, Arizona (mile marker 490).
The average truck speed on I-10 is relatively high at about 56 mph (Figure 5). Of the corridors studied in this report, I-10 had the second highest average speed. Travel-time reliability averaged 21 percent over the whole year (Figure 6). The BI indicates that I-10 had the second most unreliable travel time of the five corridors studied.
Border regions like the El Paso area have experienced significant increases in both truck and passenger traffic. Between 1995 and 2005, the number of trucks entering the United States in El Paso increased by 22 percent (USDOT RITA BTS 2006). The El Paso District of the Texas Department of Transportation is studying the feasibility of a Southern Relief Route for I-10 to address congestion and the challenges associated with expanding the right-of-way along existing corridors (TX DOT 2005).
Catastrophic events, such as Hurricane Katrina that struck the Gulf Coast on August 29, 2005, can have a major effect on truck mobility and cause concentrated damage to transportation infrastructure. (See Appendix A for information on the average truck speed on I-10 following Hurricane Katrina.) Historical travel time data for catastrophic and unusual events such as fires, crashes, hurricanes, earthquakes, flooding, and blizzards, could add value to transportation planning efforts. As an example, historical data could contribute to the development of evacuation plans for before, during, or after an event. These data could also aid in the development of traffic management plans that facilitate effective and efficient delivery of emergency supplies and services. Although FPM data represent only commercial vehicles, this information could inform the development of traffic management strategies for catastrophic events such as when to use counterflow operations or highway shoulders as traffic lanes. Regarding the rebuilding of transportation infrastructure after an event and planning for long-term improvements, FPM data could be useful in identifying those areas of the transportation network where resiliency should be added to ensure the system can continue functioning if a major link is damaged or destroyed.
INTERSTATE 45 (I-45)
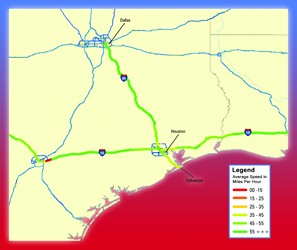
At 285 miles, I-45 is much shorter than the other corridors analyzed in this report. Wholly within Texas, I-45 runs from Dallas to the Gulf of Mexico at Galveston and passes through Houston. Dallas and Houston are two of the largest metropolitan areas in the United States. Galveston and Houston are major ports for the export and import of goods, goods that often arrive or depart the port by truck, as well as important departure ports for cruise ships. Measured by weight in 2003, the Port of Houston and the Port of Galveston ranked 2nd and 63rd of all U.S. ports, respectively, in terms of freight handled (USACE 2005). The same year, Galveston was the ninth most important cruise ship port in the United States (USDOT MARAD 2006). Average truck speeds on I-45 between Galveston and Houston are relatively slow, particularly compared with speeds on the section between Houston and Dallas (Map 4).
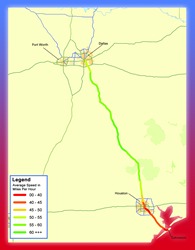
Figure 7 shows AADT and AADTT for I-45. These two traffic estimates are presented on different scales for readability. Traffic volume overall is greatest through Houston and Dallas. Truck traffic on I-45 is also greatest through those cities, but does not drop off as much between them. In other words, a lot of truck traffic moving on I-45 is intercity traffic rather than just local.
Average speed and reliability are more volatile on I-45 than on the other corridors. Slight variations in travel on a 285-mile road will have a much bigger effect than similar variations on a 2,000-mile trip. The average speed over the entire year was 54 mph, with a high in February of 55.4 mph and a low in September of 52.5 mph (Figure 8). The BI averaged 31 percent over the whole year with the most unreliable travel times in June with a BI of 45 percent and the most reliable in February with a BI of 18 percent (Figure 9).
As noted earlier, natural catastrophes, such as earthquakes and hurricanes, can have a major effect on the highway network both in terms of disruption to traffic and damage. Although it eventually came ashore near the Texas-Louisiana border on September 24, 2005 as a Category 3, Hurricane Rita was forecast to strike Galveston, Texas as a Category 4. It is likely that Hurricane Rita influenced the 52.5 mph average speed for the month of September. Appendix A provides two maps that demonstrate the effect that evacuation activities had on I-45 truck speeds.
Based on the 2005 results, the FPM research team will conduct additional research and analysis to understand variations along the I-45 corridor. The goal is to better understand the factors that influence variations, such as capacity, time of travel, and weather.
INTERSTATE 65 (I-65)
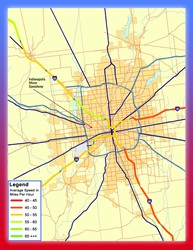
Interstate 65 runs north-south 887 miles connecting four states from Gary, IN in the Chicago metropolitan area to Mobile, AL on the Gulf of Mexico. I-65 passes through or near Indianapolis, IN; Louisville, KY; Nashville, TN; and Huntsville, Birmingham, and Montgomery, AL. After Chicago, Indianapolis is the largest with a population of 1.6 million, followed by Nashville (1.4 million), Louisville (1.2 million), and Birmingham (1.1 million). Mobile, Montgomery, and Huntsville each have a population of about 400,000. Average truck speeds overall on I-65 are remarkably high, even passing through or near these urban areas (Map 5).
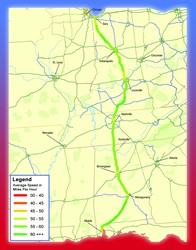
Figure 10 shows AADT and AADTT for I-65. These two traffic estimates are presented on different scales for readability. Traffic volume overall is greatest through the major metropolitan areas, particularly Birmingham, Nashville, and Louisville. Truck traffic follows these overall patterns but with the highest traffic on the sections from Nashville and Louisville.
Of the five corridors studied, I-65 had the highest average speed and the most reliable travel times. Speeds averaged 58 mph over the length of the corridor in 2005 (Figure 11). The BI averaged just 7 percent (Figure 12).
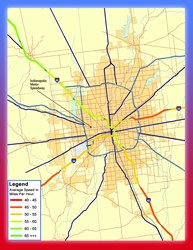
Planned special events often disrupt the normal operation of the highway system with a large increase in travelers to and from the event and sometimes road closures. One of the largest planned special events anywhere in the world is the Indianapolis 500 motor race that occurs annually over the Memorial Day weekend at the Indianapolis Motor Speedway. The Speedway is located on the western side of Indianapolis approximately five miles from downtown. Although an official estimate of people attending the event is never announced, the Speedway is known to have about 250,000 seats and standing room for about 10,000 more spectators. Despite the size of this event, average truck speed on race weekend in May 2005 was only slightly slower than on a weekend a month before the race (Appendix A), indicating minimal disruption.
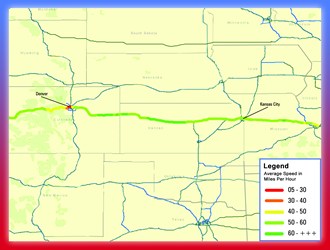
INTERSTATE 70 (I-70)
I-70 runs a total of 2,153 miles connecting ten states through the midsection of the continental United States from Cove Fort, Utah to Baltimore, Maryland. I-70 passes through Denver, CO; Topeka, KS; Kansas City and St. Louis, MO; Indianapolis, IN; Dayton and Columbus, OH; Wheeling, WV; and Hagerstown and Frederick, MD. The western half of I-70 is overwhelmingly rural except for Denver. Here terrain is responsible for relatively slow average speeds on some sections. By contrast, the eastern half, stretching from Kansas City to Baltimore has more closely spaced urban areas and is part of a relatively dense network of Interstates and other major highways. Here traffic volumes and problems caused by intersecting highways are more likely to slow trucks. The stretch of I-70 between Denver and Kansas City has none of these problems and, therefore, relatively high average truck speeds (Map 6).
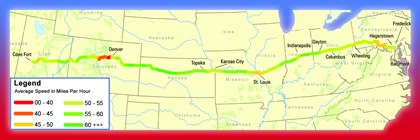
Figure 13 shows AADT and AADTT for I-70. These two traffic estimates are presented on different scales for readability. Traffic volume overall is greatest through the major metropolitan areas of Denver, St. Louis, Indianapolis, and Columbus. In general truck traffic follows these overall patterns. But truck traffic is more constant particularly between the junction with I-75 west of Columbus and the junction with I-79 east of Wheeling.

The average speed on I-70 in 2005 was 54 mph, in the mid-range of the corridors studied (Figure 14). The buffer index was relatively low, averaging 11 percent (Figure 15).
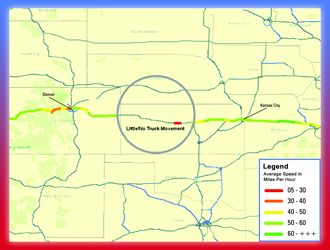
Adverse weather, including everyday events like rain and fog, is another factor that affects truck mobility. A major snowstorm that closed parts of I-70 between Denver and Salina, Kansas in November 2005 is a good example of how weather can affect trucking. Maps A8 and A9 in Appendix A show the effect that this snowstorm had on average truck speeds on segments of I-70.
Next Steps
The work done to date on the initial five FPM study corridors represents the first step in an ongoing project to develop a comprehensive framework to measure freight-related highway performance. In April 2007 one year of speed and reliability data will be available for twenty additional Interstate corridors (Map 6). Based on FHWA's 1998 FAF, these 25 corridors account for more than 80 percent of the commodity-carrying truck VMT on the Interstate highway system.
Key next steps are to analyze the connecting links between major cities and to use FPM-derived data to develop other meaningful freight performance measures. Potential measures for future consideration include, but are not limited to, the percentage of on-time arrivals, average variability in point-to-point travel times, and average vehicle hours of delay.
Applying a methodology similar to that used for the corridors, FHWA is also collecting data on five U.S.-Canada land border crossings: Blaine (Pacific Highway), WA; Pembina, ND; Ambassador Bridge: Detroit, MI; Peace Bridge: Buffalo, NY; and Champlain, NY. These five border crossings account for more than 50 percent of U.S.-inbound truck traffic (USDOT BTS 2005).
In early 2007, an analysis of one full year of data will be available for these crossings. The information derived from this effort, such as total crossing time, average delay, and reliability, will provide information on freight performance that reflects the processing time required for inspection and enforcement on both sides of the borders as well as on highway conditions and operations. From a national perspective, measures of total border-crossing time, delay, and reliability are important indicators of freight-system performance.
Another key next step is partnering with state, regional and local transportation agencies, academia, and the private sector to determine how the data derived from the FPM can be applied at the local level. Work with public transportation agencies will examine several issues such as: 1) whether a long-term FPM program would be useful in guiding project prioritization and investment decisions, 2) how data derived from FPM can be used to analyze transportation network performance, and 3) whether data can be used to monitor project performance. As part of the assessment of data usage, FHWA plans to develop a Web-based tool that will allow transportation agencies to access corridor freight travel time information based on user-defined requirements (i.e. specific segment of a corridor, time of day, direction). Work with the private sector will focus on providing data to carriers, shippers and other freight industry stakeholders to inform their business decisions and strategies to improve productivity. Using FPM data to improve shipment routing, identify areas that require more detailed analysis, and provide before and after system performance review for project implementation are other promising applications.
Additionally, work with academia will research the usefulness of FPM data in developing new or improved existing freight models and travel time reliability and prediction models. Many existing models depend on travel speed data from fixed location systems such as loop detectors or use volume and capacity to make assumptions on speed. Moreover, these models are primarily used to predict and estimate travel time reliability in urban areas. Because FPM uses probe-based data collection, its coverage is greater, which can potentially improve existing models by providing more data. The aim of future research is to determine whether FPM data can be used to develop an accurate and reliable model of predicting travel time between points along freight-significant corridors. If successful, the modeling effort can be used to inform public sector transportation planning, design, and operations as well as private sector distribution network configurations.
Conclusion
The Department of Transportation recognizes that the efficient movement of freight is important to the Nation's economy. Efficiency is affected by slow speeds and unreliable travel times due to congested highways. For the freight industry, slow and unreliable travel results in diminished productivity by reducing the efficiency of operations, increasing costs of goods, increasing fuel costs, reducing drivers' available hours for service, and reducing equipment productivity. Reducing highway congestion will produce important benefits for the freight industry and contribute to our Nation's growing economy. Solutions will require long-term and short-term solutions and participation from the public sector and private sector.
Although FPM itself is not a system improvement, it is a mechanism for collecting and analyzing data to assist national, state, regional, and local transportation agencies in better measuring and managing highway transportation system performance. Unlike other FHWA efforts, the focus of FPM is on major freight-significant corridors, intercity pairs along those corridors, and major U.S. international land-border crossings. The availability of FPM data has the potential to inform future investment decisions that produce benefits of regional and national significance. FPM data when coupled with other sources can provide a better understanding of travel time, reliability, congestion, and delay.
Measuring speed and reliability on corridors with significant freight movement provides measures that are useful as national indicators of highway system performance. Because a high level of reliability does not necessarily reflect that conditions are good, only that they are consistent (e.g., it could reflect consistently slow or high-cost service), future FPM work will look at other measures that can be derived from the data collected. As an example, it would be useful to combine FPM data with highway characteristics data and other attributes of freight transportation cost.
FHWA's goal is to continue to refine this research over the next few years and to move towards the establishment of a freight data source that could be used to inform future policy, programming, and investment decisions. A key first step in reaching this goal is to demonstrate that FPM data can be used to identify where needs exist so that strategies and tactics for improving highway performance can be developed. The next step—paramount to the success of the FPM initiative—is to get the data into the hands of state and local transportation agencies responsible for planning, prioritizing, funding and delivering system improvements.
References
American Association of State Highway and Transportation Officials (AASHTO). 2002. Transportation, Invest in America: The Bottom Line (Washington, DC).
American Highway Users Alliance, American Automobile Association, and TRIP. 2005. Are We There Yet? A Report on Summer Traffic Bottlenecks and Steps Needed to Ensure that Our Favorite Vacation Destinations Remain Accessible (Washington, DC), available at http://www.highways.org/pdfs/travel_study2005.pdf as of May 30, 2006.
The Economist. 2006. The Physical Internet: A Survey of Logistics, June 17.
Georgia State Road and Tollway Authority. 2005. Truck Only Toll Facilities: Potential for Implementation in the Atlanta Region, available at http://www.hotandtotstudy.com/study_info/pdf/TOTFinalReport1005.pdf.
Houston Chronicle. 2005. Most Say They'd Evacuate Again, November 10.
I-95 Corridor Coalition. 2003. Quick Clearance and “Move-It” Best Practices: Final Report, September (Rockville, MD), available at http://144.202.240.28/pman/projectmanagement/Upfiles/reports/full189.doc as of June 39, 2006.
Interstate 70 Central Mountain Transportation Coalition. 2006. Final Draft, Recommendations for the I-70 Mountain Corridor on Travel Demand Management (Silverthorne, CO), available at http://www.nwc.cog.co.us.
Texas Department of Transportation (TX DOT). 2002. National I-10 Freight Corridor Study, prepared by Wilbur Smith Associates (Austin, TX), available at http://www.i10freightstudy.org/assets/Final%20Report.pdf as of October 30, 2006.
Texas Department of Transportation (TX DOT). 2005. I-10 Southern Relief Route (Austin, TX), available at http://www.elpasomobility.org/overview.html as of October 30, 2006.
Texas Transportation Institute (TTI). 2005. 2005 Urban Mobility Report (College Stations, TX), available at http://mobility.tamu.edu/ums/ as of May 30, 2006.
The Road Information Project (TRIP). 2005. Growing Traffic in Rural America: Safety, Mobility, and Economic Challenges in America's Heartland (Washington, DC), available at http://www.tripnet.org/RuralRoads2005Report.pdf as of June 23, 2005.
Transportation Research Board (TRB). 2003. Safe and Quick Clearance of Traffic Incidents, NCHRP Synthesis 318 (Washington, DC), available at http://onlinepubs.trb.org/onlinepubs/nchrp/nchrp_syn_318.pdf as of June 29, 2006.
U.S. Army Corps of Engineers (USACE). 2005. Waterborne Commerce of the United States, Calendar Year 2003 (New Orleans), available at http://www.iwr.usace.army.mil/ndc/wcsc/pdf/wcusnatl03.pdf as of July 24, 2006.
U.S. Department of Transportation (USDOT), Federal Highway Administration (FHWA). 2000a. Incident Management Successful Practices: A Cross-Cutting Study (Washington, DC), available at http://ntl.bts.gov/lib/jpodocs/repts_te/11484.pdf.
U.S. Department of Transportation (USDOT), Federal Highway Administration (FHWA). 2000b. NHS Intermodal Connectors: A Report to Congress (Washington, DC), available at http://ops.fhwa.dot.gov/freight/freight_analysis/nhs_connect.htm as of July 11, 2006.
U.S. Department of Transportation (USDOT), Federal Highway Administration (FHWA). 2001. Creating a Freight Sector within HERS, white paper prepared for FHWA by HLB Decision Economics, November 15 (Washington, DC).
U.S. Department of Transportation (USDOT), Federal Highway Administration (FHWA). 2002. Office of Freight Management and Operations, Freight Analysis Framework (Washington, DC).
U.S. Department of Transportation (USDOT), Federal Highway Administration (FHWA). 2003. A Snapshot of Summer 2001 Work Zone Activity: Based on Information Reported on State Road Closure and Construction Web Sites (Washington, DC), available at http://ntl.bts.gov/lib/jpodocs/repts_te/13793.html as of May 30, 2006.
U.S. Department of Transportation (USDOT), Federal Highway Administration (FHWA). 2005a. An Initial Assessment of Freight Bottlenecks on Highways (Washington, DC), available at https://www.fhwa.dot.gov/policy/otps/bottlenecks/bottlenecks.pdf as of June 6, 2006.
U.S. Department of Transportation (USDOT), Federal Highway Administration (FHWA). 2005b. Traffic Congestion and Reliability: Trends and Advanced Strategies for Congestion Mitigation (Washington, DC), available at http://ops.fhwa.dot.gov/congestion_report/congestion_report_05.pdf as of May 30, 2006.
U.S. Department of Transportation (USDOT), Federal Highway Administration (FHWA). 2006. Office of Freight Management and Operations, Freight Facts and Figures 2006 (Washington, DC), available at www.ops.fhwa.dot.gov/freight/.
U.S. Department of Transportation (USDOT), Federal Highway Administration (FHWA). No date. Office of Operations, Best Practices for Road Weather, Washington State Department of Transportation Speed Management, available at http://ops.fhwa.dot.gov/Weather/best_practices/casestudies/029.pdf.
U.S. Department of Transportation (USDOT), Maritime Administration (MARAD). 2006. North American Cruise Passenger Statistics (Washington, DC), available http://www.marad.dot.gov/MARAD_statistics/index.html as of July 24, 2006.
U.S. Department of Transportation (USDOT), Research and Innovative Technology Administration (RITA), Bureau of Transportation Statistics (BTS). 2006. Border Crossing/Entry Data (Washington, DC), available at www.bts.gov as of October 30, 2006
U.S. Department of Transportation (USDOT), Research and Innovative Technology Administration (RITA), Bureau of Transportation Statistics (BTS). 2006. Pocket Guide to Transportation 2006 (Washington, DC), available at www.bts.gov/publication/pocket_guide_to_transportation/2006.
Appendix
This appendix provides examples of how FPM data can be used to examine system performance from various perspectives.
In 2003, Los Angeles and San Diego were ranked as the 1st most congested and the 12th most congested urban areas in the country, respectively (TTI 2005). These levels of congestion are reflected in relatively low average truck speeds. Truck speeds on most of I-5 through both the Los Angeles metropolitan area and the San Diego metropolitan area average below 45 mph (Map A1).
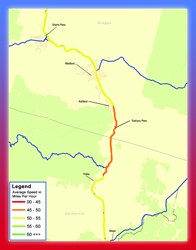
The Siskiyou Pass, commonly known as the “Siskiyous,” is a very hazardous part of Interstate 5 on the California and Oregon border. The summit in Southern Oregon is at an elevation of 4,310 feet. Traveling north on I-5 from the highest point involves losing about 2,300 feet in six miles at a 6 percent downgrade. There are sharp curves, and fog and cold temperatures combine to produce very hazardous visibility and road surface conditions in the area. About half of the accidents that occur on this stretch of roadway involve tractor-trailers. In 2005, average truck speeds through the Siskiyous fell in the 45 to 50 mph range compared with 50 to 55 mph on the approaches in California and Oregon (Map A2).
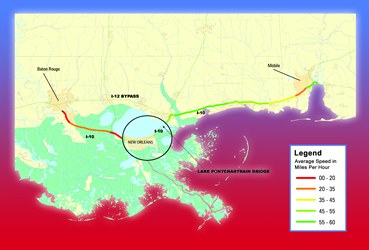
Data collected from trucks on I-10 in the days after Katrina shows that the freight system was severely affected but not completely closed. Several factors account for that: I-10 was restored in a short-period of time, alternative routes were available in places that were severely damaged, and far fewer vehicles were on the roadway with only authorized vehicles allowed in some places and cars and trucks avoiding the area.
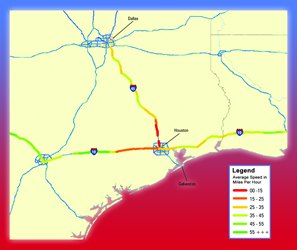
Hurricane Rita hit the Galveston area on September 24, 2005 as a Category 3 hurricane. An estimated 2.5 million people heeded warnings and left the area, approximately one-third on September 21 and half on September 22. Congestion on evacuation routes was a major problem. (Houston Chronicle 2005). I-45 was one of the major evacuation routes and the congestion problems that ensued are reflected in truck speeds on those days. Average truck speeds between 7 am and 7 pm dropped from an average of 55 mph in most of the corridor before the evacuation on September 20 to speeds below 35 mph on most segments during the height of the evacuation on September 22. The unshaded segments of the corridor are the result of too few observations reflecting little or no truck movement (Map A4 and A5).
The Indianapolis Motor Speedway is located on the western side of Indianapolis approximately 5 miles from downtown. Although an official estimate of people attending the event is never announced, the Speedway is known to have about 250,000 seats and standing room for an additional 10,000 spectators. Despite the large crowd for the event, average truck speeds I-65 and I-70 on race weekend in May 2005 were only slightly slower than on a weekend in April 2005, indicating minimal disruption. FPM data also showed that there were 50 percent more trucks positions on I-65 on race weekend than on a weekend a month earlier (Maps A6 and A7).
The November average for the western portion of Kansas along I-70 shows speeds of over 60 mph (Map A8). The eastward progression of a major snowstorm on November 27 slowed speeds to the 40 mph to 50 mph range.
The snowstorm closed parts of I-70 between Denver and Salina, Kansas on November 28. With the road closed there were few observations, reflecting little or no truck movement on that part of the corridor (Map A9)..
Technical Report Documentation Page
1. Report No. FHWA-HOP-07-071 |
2. Government Accession No. |
3. Recipient's Catalog No. |
|
4. Title and Subtitle Freight Performance Measurement: Travel Time in Freight-Significant Corridor |
5. Report Date December 2006 |
||
6. Performing Organization Code |
|||
7. Author(s) William Mallett, Battelle |
8. Performing Organization Report No. |
||
9. Performing Organization Name and Address Battelle |
10. Work Unit No. (TRAIS) |
||
11. Contract or Grant No.
|
|||
12. Sponsoring Agency Name and Address U.S. Department of Transportation |
13. Type of Report and Period Covered
|
||
14. Sponsoring Agency Code
|
|||
15. Supplementary Notes
|
|||
16. Abstract This report provides an analysis of truck performance (speed and reliability) in five freight-significant corridors based on data collected in calendar year 2005. The five corridors analyzed are Interstate 5, Interstate 10, Interstate 45, Interstate 65, and Interstate 70. FHWA selected the five corridors for data collection and analysis based on a variety of factors including annual average daily truck traffic, geography, and corridor length. FHWA established a partnership with the American Transportation Research Institute (ATRI) to collect this confidential data using automatic vehicle location equipment aboard approximately 250,000 trucks nationwide. The work done to date on the initial five corridors represents the first step in an ongoing project to develop a comprehensive framework to measure freight-related highway performance. FHWA is also collecting data on five U.S.-Canada land border crossings and twenty additional Interstate corridors. |
|||
17. Key Words Freight transportation, freight mobility, productivity, trade, economy, safety, energy use, emissions, employment |
18. Distribution Statement
|
||
19. Security Classification (of this report) Unclassified |
20. Security Classification (of this page) Unclassified |
21. No of Pages 44 |
22. Price
|
Form DOT F 1700.7 (8-72) Reproduction of completed page authorized
U.S. Department of Transportation
Federal Highway Administration
Office of Freight Management and Operations
Phone: 202-366-9210
Fax: 202-366-3302
Web site: http://www.ops.fhwa.dot.gov/freight/
December 2006
FHWA-HOP-07-071
EDL 14341