Freight Facts and Figures 2011
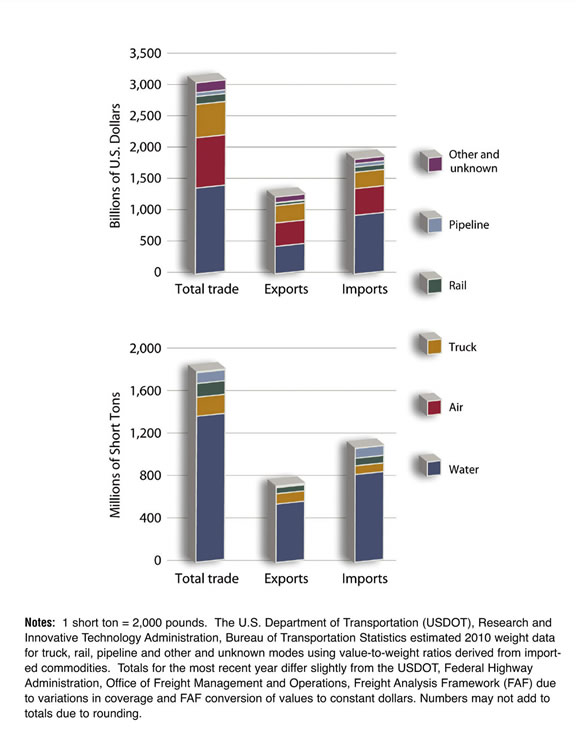
Figures 2-2 and 2-2M. U.S. International Merchandise Trade by Transportation Mode: 2010
Nearly 80 percent of freight tonnage in U.S. foreign trade moves by water, but air and truck transportation are also important when freight value is considered. By value, the water share drops to 47 percent, with air and truck accounting for 27 percent and 18 percent respectively. Rail and pipeline account for about 6 percent.
Figure 2-2 (standard units)
[PDF 1MB]
Data represented in the figure.
| Mode | Billions of U.S. dollars Total trade |
Billions of U.S. dollars Exports |
Billions of U.S. dollars Imports |
|---|---|---|---|
| Water | 1,434 | 455 | 979 |
| Air | 837 | 393 | 444 |
| Truck | 557 | 285 | 272 |
| Rail | 131 | 46 | 85 |
| Pipeline | 63 | 5 | 58 |
| Other, unknown, and miscellaneous | 167 | 94 | 73 |
| Total, all modes | 3,190 | 1,278 | 1,912 |
| Mode | Millions of short tons Total trade |
Millions of short tons Exports |
Millions of short tons Imports |
|---|---|---|---|
| Water | 1,435 | 574 | 862 |
| Air | <1 | <1 | <1 |
| Truck | 187 | 102 | 86 |
| Rail | 134 | 60 | 74 |
| Pipeline | 106 | 9 | 97 |
| Other, unknown, and miscellaneous | 9 | 6 | 3 |
| Total, all modes | 1,872 | 751 | 1,121 |
Sources:
Total, water and air data: U.S. Department of Commerce, U.S. Census Bureau, Foreign Trade Division, FT920 - U.S. Merchandise Trade: Selected Highlights (Washington, DC: February 2011).
Truck, rail, and pipeline data: U.S. Department of Transportation, Research and Innovative Technology Administration, Bureau of Transportation Statistics, North American Transborder Freight Data, available at http://www.bts.gov/transborder/ as of August 29, 2011.
Other and unknown: U.S. Department of Transportation, Research and Innovative Technology Administration, Bureau of Transporation Statistics, special tabulation, August 2011.
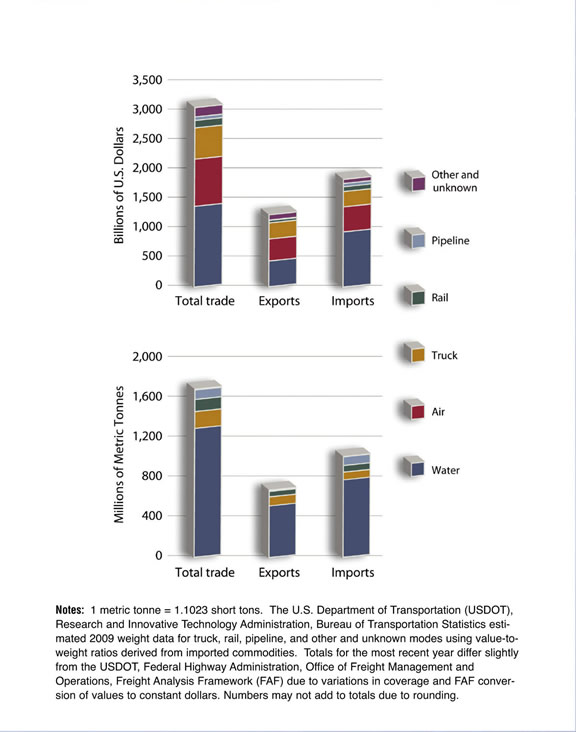
Figure 2-2M (metric units)
[PDF 945KB]
Data represented in the figure.
| Mode | Billions of U.S. dollars Total trade |
Billions of U.S. dollars Exports |
Billions of U.S. dollars Imports |
|---|---|---|---|
| Water | 1,434 | 455 | 979 |
| Air | 837 | 393 | 444 |
| Truck | 557 | 285 | 272 |
| Rail | 131 | 46 | 85 |
| Pipeline | 63 | 5 | 58 |
| Other, unknown, and miscellaneous | 167 | 94 | 73 |
| Total, all modes | 3,190 | 1,278 | 1,912 |
| Mode | Millions of metric tonnes Total trade |
Millions of metric tonnes Exports |
Millions of metric tonnes Imports |
|---|---|---|---|
| Water | 1,302 | 521 | 782 |
| Air | <1 | <1 | <1 |
| Truck | 170 | 92 | 78 |
| Rail | 122 | 54 | 67 |
| Pipeline | 96 | 8 | 88 |
| Other, unknown, and miscellaneous | 8 | 5 | 2 |
| Total, all modes | 1,698 | 681 | 1,017 |
Sources:
Total, water and air data: U.S. Department of Commerce, U.S. Census Bureau, Foreign Trade Division, FT920 - U.S. Merchandise Trade: Selected Highlights (Washington, DC: February 2011).
Truck, rail, and pipeline data: U.S. Department of Transportation, Research and Innovative Technology Administration, Bureau of Transportation Statistics, North American Transborder Freight Data, available at http://www.bts.gov/transborder/ as of August 29, 2011.
Other and unknown: U.S. Department of Transportation, Research and Innovative Technology Administration, Bureau of Transporation Statistics, special tabulation, August 2011.
To view Excel files, you can use the Microsoft Excel Viewer.
You will need the Adobe Reader to view the PDFs on this page.