Freight Facts and Figures 2010
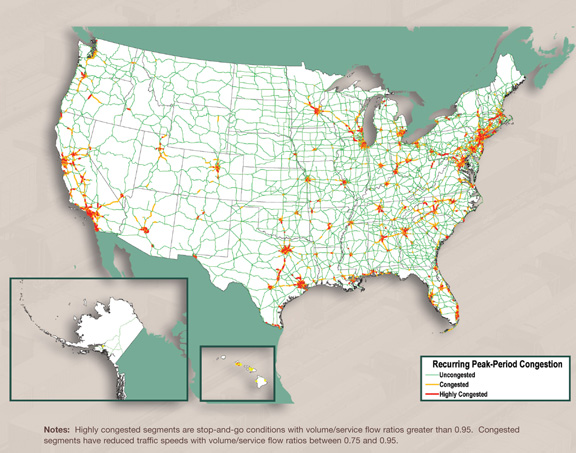
Figure 3-9. Peak-Period Congestion on the National Highway System: 2007
Recurring congestion caused by volumes of passenger vehicles and trucks that exceed capacity on roadways during peak periods is concentrated primarily in major metropolitan areas. In 2007, peak-period congestion resulted in traffic slowing below posted speed limits on 11,700 miles of the NHS and created stop-and-go conditions on an additional 6,700 miles.
Sources:
U.S. Department of Transportation, Federal Highway Administration, Office of Highway Policy Information, Highway Performance Monitoring System; and Office of Freight Management and Operations, Freight Analysis Framework, version 3.1, 2010.
![]() You will need the Adobe Reader to view the PDFs on this page.
You will need the Adobe Reader to view the PDFs on this page.