Freight Facts and Figures 2009
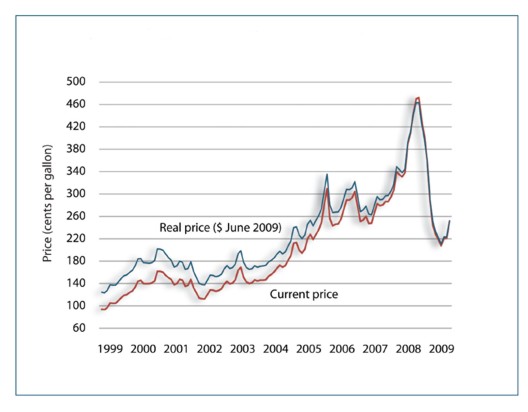
Figure 5-2. Monthly Diesel Prices: January 1999-June 2009
Diesel prices were about 81 percent higher in June 2009 than 10 years earlier (in inflation-adjusted terms).
[PDF 45KB]
Data represented in the figure.
Table in Excel format
Cents per gallon
| Date |
Current Price |
Real Price
(June 2009 dollars) |
| Jan-1999 |
96.7 |
126.9 |
| Feb-1999 |
95.9 |
125.7 |
| Mar-1999 |
99.7 |
130.3 |
| Apr-1999 |
107.9 |
140.1 |
| May-1999 |
107.3 |
139.3 |
| Jun-1999 |
107.4 |
139.4 |
| Jul-1999 |
112.2 |
145.1 |
| Aug-1999 |
117.2 |
151.3 |
| Sep-1999 |
121.5 |
156.1 |
| Oct-1999 |
122.8 |
157.5 |
| Nov-1999 |
126.3 |
161.9 |
| Dec-1999 |
129.2 |
165.6 |
| Jan-2000 |
135.6 |
173.3 |
| Feb-2000 |
146.1 |
185.6 |
| Mar-2000 |
147.9 |
186.3 |
| Apr-2000 |
142.2 |
179.0 |
| May-2000 |
142.0 |
178.5 |
| Jun-2000 |
142.1 |
177.8 |
| Jul-2000 |
143.4 |
179.0 |
| Aug-2000 |
146.6 |
183.0 |
| Sep-2000 |
163.7 |
203.3 |
| Oct-2000 |
163.7 |
202.9 |
| Nov-2000 |
162.1 |
200.9 |
| Dec-2000 |
156.5 |
194.0 |
| Jan-2001 |
152.4 |
187.7 |
| Feb-2001 |
149.2 |
183.1 |
| Mar-2001 |
139.9 |
171.3 |
| Apr-2001 |
142.2 |
173.4 |
| May-2001 |
149.6 |
181.6 |
| Jun-2001 |
148.2 |
179.6 |
| Jul-2001 |
137.5 |
167.1 |
| Aug-2001 |
139.0 |
168.8 |
| Sep-2001 |
149.5 |
180.9 |
| Oct-2001 |
134.8 |
163.7 |
| Nov-2001 |
125.9 |
153.0 |
| Dec-2001 |
116.7 |
142.4 |
| Jan-2002 |
115.3 |
140.4 |
| Feb-2002 |
115.2 |
139.7 |
| Mar-2002 |
123.0 |
148.4 |
| Apr-2002 |
130.9 |
157.0 |
| May-2002 |
130.5 |
156.6 |
| Jun-2002 |
128.6 |
154.1 |
| Jul-2002 |
129.9 |
155.6 |
| Aug-2002 |
132.8 |
158.5 |
| Sep-2002 |
141.1 |
168.1 |
| Oct-2002 |
146.2 |
173.9 |
| Nov-2002 |
142.0 |
168.9 |
| Dec-2002 |
142.9 |
170.4 |
| Jan-2003 |
148.8 |
176.6 |
| Feb-2003 |
165.4 |
194.9 |
| Mar-2003 |
170.8 |
200.0 |
| Apr-2003 |
153.3 |
179.8 |
| May-2003 |
145.1 |
170.6 |
| Jun-2003 |
142.4 |
167.2 |
| Jul-2003 |
143.5 |
168.3 |
| Aug-2003 |
148.7 |
173.7 |
| Sep-2003 |
146.7 |
170.8 |
| Oct-2003 |
148.1 |
172.7 |
| Nov-2003 |
148.2 |
173.3 |
| Dec-2003 |
149.0 |
174.4 |
| Jan-2004 |
155.1 |
180.6 |
| Feb-2004 |
158.2 |
183.3 |
| Mar-2004 |
162.9 |
187.5 |
| Apr-2004 |
169.2 |
194.2 |
| May-2004 |
174.6 |
199.2 |
| Jun-2004 |
171.1 |
194.6 |
| Jul-2004 |
173.9 |
198.0 |
| Aug-2004 |
183.3 |
208.6 |
| Sep-2004 |
191.7 |
217.7 |
| Oct-2004 |
213.4 |
241.1 |
| Nov-2004 |
214.7 |
242.4 |
| Dec-2004 |
200.9 |
227.7 |
| Jan-2005 |
195.9 |
221.6 |
| Feb-2005 |
202.7 |
227.9 |
| Mar-2005 |
221.4 |
247.0 |
| Apr-2005 |
229.2 |
254.0 |
| May-2005 |
219.9 |
244.0 |
| Jun-2005 |
229.0 |
253.9 |
| Jul-2005 |
237.3 |
261.9 |
| Aug-2005 |
250.0 |
274.6 |
| Sep-2005 |
281.9 |
305.8 |
| Oct-2005 |
309.5 |
335.1 |
| Nov-2005 |
257.3 |
280.9 |
| Dec-2005 |
244.3 |
267.7 |
| Jan-2006 |
246.7 |
268.4 |
| Feb-2006 |
247.5 |
268.7 |
| Mar-2006 |
255.9 |
276.2 |
| Apr-2006 |
272.8 |
292.0 |
| May-2006 |
289.7 |
308.5 |
| Jun-2006 |
289.8 |
308.0 |
| Jul-2006 |
293.4 |
310.9 |
| Aug-2006 |
304.5 |
322.1 |
| Sep-2006 |
278.3 |
295.8 |
| Oct-2006 |
251.9 |
269.3 |
| Nov-2006 |
254.5 |
272.4 |
| Dec-2006 |
261.0 |
279.0 |
| Jan-2007 |
248.5 |
264.8 |
| Feb-2007 |
248.8 |
263.7 |
| Mar-2007 |
266.7 |
280.1 |
| Apr-2007 |
283.4 |
295.7 |
| May-2007 |
279.6 |
290.0 |
| Jun-2007 |
280.8 |
290.7 |
| Jul-2007 |
286.8 |
297.0 |
| Aug-2007 |
286.9 |
297.6 |
| Sep-2007 |
295.3 |
305.5 |
| Oct-2007 |
307.5 |
318.3 |
| Nov-2007 |
339.6 |
348.5 |
| Dec-2007 |
334.1 |
343.1 |
| Jan-2008 |
330.8 |
338.0 |
| Feb-2008 |
337.7 |
344.1 |
| Mar-2008 |
388.1 |
392.0 |
| Apr-2008 |
408.4 |
410.1 |
| May-2008 |
442.5 |
440.6 |
| Jun-2008 |
467.7 |
461.0 |
| Jul-2008 |
470.3 |
461.2 |
| Aug-2008 |
430.2 |
423.5 |
| Sep-2008 |
402.4 |
396.7 |
| Oct-2008 |
357.6 |
356.1 |
| Nov-2008 |
287.6 |
292.0 |
| Dec-2008 |
244.9 |
251.3 |
| Jan-2009 |
229.2 |
234.1 |
| Feb-2009 |
219.5 |
223.1 |
| Mar-2009 |
209.2 |
212.1 |
| Apr-2009 |
222.0 |
224.6 |
| May-2009 |
222.7 |
224.6 |
| Jun-2009 |
252.9 |
252.9 |
Sources:
Diesel price: U.S. Department of Energy, Energy Information Agency, U.S. Petroleum Prices, available at www.eia.doe.gov as of August 5, 2009.
Consumer price index: U.S. Department of Labor, Bureau of Labor Statistics, Consumer Price Index – All Urban Consumers, Monthly, available at www.bls.gov as of August 5, 2009.
To view Excel files, you can use the Microsoft
Excel Viewer.
 You will need the Adobe
Acrobat Reader to view the PDFs on this page.
You will need the Adobe
Acrobat Reader to view the PDFs on this page.
previous |
table of contents |
next