Freight Facts and Figures 2008
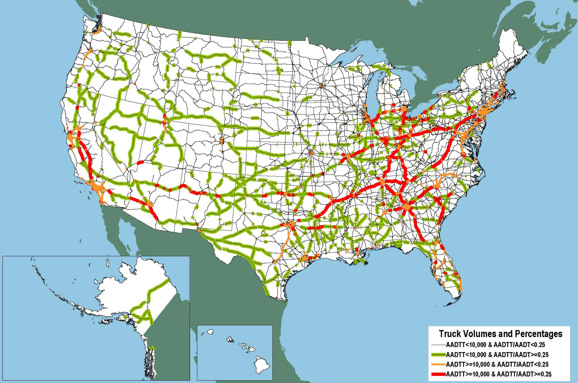
Figure 3-6. Major Truck Routes on the National Highway System: 2002
Selected routes carry a significant concentration of trucks, either as an absolute number or as a percentage of the traffic stream. More than 4,000 miles of the National Highway System (NHS) carry more than 10,000 trucks per day on sections where at least every fourth vehicle is a truck.
Notes:
AADTT is average annual daily truck traffic, and includes freight-hauling long-distance trucks, freight-hauling local trucks, and other trucks with six or more tires. AADT is average annual daily traffic, and includes all motor vehicles.
Source:
U.S.Department of Transportation, Federal Highway Administration, Office of Freight Management and Operations, Freight Analysis Framework, version 2.2, 2007.
![]() You will need the Adobe
Acrobat Reader to view the PDFs on this page.
You will need the Adobe
Acrobat Reader to view the PDFs on this page.