Freight Facts and Figures 2008
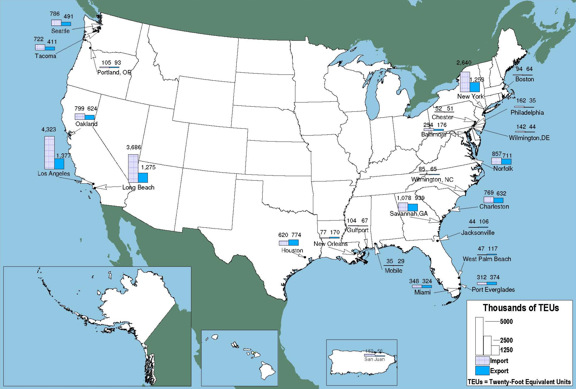
Figure 3-16. Top 25 Water Ports by Containerized Cargo: 2007
Containerized cargo has grown rapidly over the past few years and is concentrated at a few large water ports. The Ports of Los Angeles and Long Beach together handle about 37 percent of all container traffic at water ports in the United States. Container trade at these two ports doubled between 1997 and 2007, slightly higher than the growth rate reported for container cargo overall.
Data represented in the figure.
Thousands of Twenty-foot Equivalent Units (TEUs)
| Ports | Rank | Export | Import |
|---|---|---|---|
| Los Angeles, CA | 1 | 1,377 | 4,323 |
| Long Beach, CA | 2 | 1,275 | 3,686 |
| New York, NY | 3 | 1,253 | 2,640 |
| Savannah, GA | 4 | 939 | 1,078 |
| Norfolk, VA | 5 | 711 | 857 |
| Oakland, CA | 6 | 624 | 799 |
| Charleston, SC | 7 | 632 | 769 |
| Houston, TX | 8 | 774 | 620 |
| Seattle, WA | 9 | 491 | 786 |
| Tacoma, WA | 10 | 411 | 722 |
| Port Everglades, FL | 11 | 374 | 312 |
| Miami, FL | 12 | 324 | 348 |
| Baltimore, MD | 13 | 176 | 254 |
| New Orleans, LA | 14 | 170 | 77 |
| San Juan, PR | 15 | 56 | 151 |
| Portland, OR | 16 | 93 | 105 |
| Philadelphia, PA | 17 | 35 | 162 |
| Wilmington, DE | 18 | 44 | 142 |
| Gulfport, MS | 19 | 67 | 104 |
| West Palm Beach, FL | 20 | 117 | 47 |
| Boston, MA | 21 | 64 | 94 |
| Jacksonville, FL | 22 | 106 | 44 |
| Wilmington, NC | 23 | 65 | 85 |
| Chester, PA | 24 | 51 | 52 |
| Mobile, AL | 25 | 29 | 35 |
Source:
U.S. Department of Transportation, Maritime Administration, U.S. Waterborne Container Trade by U.S. Custom Ports, 1997-2007, based on data provided by Port Import/Export Reporting Service, available at www.marad.dot.gov/library_landing_page/data_and_statistics/Data_and_Statistics.htm as of June 20, 2008.
To view Excel files, you can use the Microsoft Excel Viewer.
![]() You will need the Adobe
Acrobat Reader to view the PDFs on this page.
You will need the Adobe
Acrobat Reader to view the PDFs on this page.