Appendix B
Transportation Infrastructure, Freight Services Sector and Economic Growth: A Synopsis
Prepared by
T. R. Lakshmanan
William P. Anderson
Center for Transportation Studies
Boston University
January 2002
Table of Contents
- Introduction
- The Freight Services Sector: Technical Change, Evolution and Contribution to the Economy
- Different Approaches to Measuring the Economic Benefits of Transport
- General Equilibrium Benefits
- Lessons Learned
- References
Introduction
The U.S. Department of Transportation, Federal Highway Administration (FHWA) has had a long interest in gaining a clear understanding of the nature of linkages between transport infrastructure investments and economic growth and performance.
Several factors underlie this continuing interest of FHWA. First, FHWA directly and indirectly invests significant amounts in highway infrastructure each year, and needs to know that these investments are justified by rational decision criteria. Second, FHWA is committed by the Department’s Strategic Plan to promote the nation’s economic growth and economic competitiveness in the way it conducts its investment and non-investment activities. To accomplish this strategic mission, FHWA clearly needs knowledge on the nature and scope of the relationships between the provision of highway investments and economic growth and performance. An important dimension of these economic impacts relates to the impacts of transport investments on the performance of the rapidly evolving freight services sector, whose improved productivity in turn enhances the productivity of the overall economy.
Research aimed at improving our understanding of these linkages between transport infrastructure, the freight services sector, and economic performance can potentially address a range of issues:
- What is the nature and magnitude of the relationship between transport investments and the performance of the freight services sector, of other economic sectors, and indeed of the overall economy? What effects does transport public capital have on the productivity of labor and capital? What is the willingness to pay on the part of a private sector firm or industry for an additional increase in transport public capital? How robust are these relationships when the transport infrastructure investments are made in different contexts—say a link completion in a core region vs. a road in a peripheral region, or an investment in a growth period vs. in a declining era, etc.? To what degree does transport investment influence economic growth and to what extent is it in turn an outcome of economic growth?
- Since the convergence of transport policy reforms (particularly the new economic incentives and competition created by transport deregulation and liberalization in recent years) and novel transport and information technologies have promoted major productivity-enhancing service and process innovations in the freight services sector, a further question arises: what is the role played by transport public investments in promoting such structural changes as the reorganization of the logistical processes, which may augment productivity both in the transport service sectors and in the many transport-using sectors in the economy? In other words, what are the multiple and complex linkages between public investments in transport, the freight services sector and economic performance?
- Yet, our current understanding of these transport-economy linkages derives largely from models of aggregate relationships between transport and the economy. How should we open such “black box” models? How do we characterize and analyze the economic mechanisms by which improvements in transport infrastructure and freight services course through the national and regional economies? As freight transport cost-service improvements promote market expansion and integration, what interactive changes occur in labor, land, and product markets within and between various economic sectors? How do these interactions turn out in the world of “The New Economic Geography” with its increasing returns and imperfectly competitive markets? How can we trace the general equilibrium responses rippling through the economy, integrating under the stimulus of transport infrastructure improvements? What implications follow from this analysis for assessing transport’s role in the nation’s economic competitiveness?
This document is a synopsis of a larger White Paper that surveys and assesses current knowledge on these multiple and complex linkages among transport infrastructure investments, the freight services sector, and economic performance, as viewed from the perspective of the issues raised above.
The Freight Services Sector: Technical Change, Evolution and Contribution to the Economy
Two attributes characterize the crux of the evolution of the U.S. freight services sector in recent decades. First, the quantitative change, is reflected by the continuous growth in the volume and distance of freight moved—both of which have promoted spatial integration and robust growth of the American economy. In a broad sense, the American economy has become less freight intensive. Declines in the ratio of freight tons to GDP reflect the growing importance of services relative to goods producing industries and the shift from commodities production to diversified goods with higher ratios of value to weight. Until about 1980, ton-miles grew at a much faster rate than tons (although still declining in ratio to GDP) as the U.S. economy became more spatially integrated and firms sought more distant markets. This effect appears to have been played out by 1980, however, after which tons and ton-miles grew at roughly the same rate. However, it would be a mistake to interpret these trends as meaning that freight is becoming less important. The value of goods shipped per dollar of GDP continues to expand, so the trends in tons and ton-miles reflect economic shifts away from low value commodities rather than a decreasing dependence on the movement of goods within the U.S. economy, which is getting more globally organized.i
The second attribute is a broad qualitative change in the last two decades in the nature and scope of services the freight services industry offers to transport-using firms. As transport deregulation and liberalization policies in the U.S. in the last two decades have provided supportive economic incentives and a competitive environment, freight services firms have adopted many enabling and space-shrinking technologies of transport and communications. The resulting technical innovations have had two types of effects: first, these technologies have lowered sharply transport costs of various modes (Figures 1b and 1c).
Figure 1a. Difference Between International Fares (U.S. - Foreign) and U.S. Domestic Fares Adjusted for Distance, Selected Years, 1978-1996.
Figure 1b. Operating Costs of Less Than Truckload and Truckload Carriers, 1988-1995 (1995 dollars per vehicle-mile)
Figure 1c. Railroad Operating Costs per Revenue Ton-Mile, 1980-1995 (1995 Dollars)
Second, these new information technologies (IT) have yielded a variety of transport service and process innovations, which have made possible improvements in the transport logistics process and its fruitful reorganization. Firms in all industries have undergone a logistical revolution whereby inventories are thinner and production and transportation activities are more highly coordinated. As freight-consuming firms make these changes they place ever greater demands on freight service firms to deliver goods in narrower time windows and to provide services in support of more precise logistical management. In response, freight service firms offer a) process changes, such as better management systems (improved vehicle utilization, handling systems, etc.) and product flow rescheduling (use of JIT, quick response system, etc.). These process changes reflect improving efficiency and, through changing load factors and carrying capacity, influence the total level of goods transport; service changes, such as realignment of supply chains (new patterns of sourcing, vertical disintegration of production value chains, changing markets); and refashioning of the logistical systems (the spatial concentration of inventories and production).
These new services provided by freight firms represent not only reliability and timeliness but also flexibility and new modes of operation for customer firms--thereby offering the manufacturing and service industry customers system-wide cost reduction and additional production value and strategic comparative advantage.
The major consequences of the logistical improvements promoted by transport infrastructure investments occur in the various freight transport service-using sectors—primary, manufacturing, and service sectors — which make up the larger economy. How do the cost reductions and service enhancements in the freight sector provide benefits to various industries producing goods and services? What are the mechanisms and interacting pathways by which the logistics improvements course through the different transport-using economic sectors and improve the overall performance of the economy? How do we measure the economic benefits of transport investments?
Different Approaches to Measuring the Economic Benefits of Transport
It is part of conventional wisdom that transport investments are a crucial factor in economic growth, and in the transformation of regions and cities. The contribution of transport investments to the growth and development of the U.S. economy in the last two centuries has been noted extensively -- first the canals, then the railroads stimulating the agricultural development of the Midwest, then the transcontinental railroad linking the two coasts and helping alter the distribution of population and economic activity by around 1900, and finally the auto and the Interstate System transforming the urban landscapes shaped earlier by the streetcar.ii Similarly, the World Bank, which has funded $50 Billion in a large number of transport projects in recent decades in developing countries, estimates an average annual rate of return of 22% for all transport projects—as compared to a 15% rate of return for projects in all sectors.iii
In spite of these and other impressive inferences on transport’s impacts on overall economic performance from economic history and from transport project appraisals, there has been a continuing debate (among planners, policy types, and academics) between those who hold that transport investments are crucial to economic growth at the regional and national levels and those that maintain an opposite view, suggesting that there is limited evidence of a causal connection between transport improvements and economic performance. Part of the debate swirls around the magnitude or size of transport’s economic impact as well.
This debate is complicated by the absence of a received analytical wisdom that can settle these issues. Instead, there is a large body of analytical studies on transport-economy linkages, which vary widely in the scope of the issues they consider, in their technical sophistication, and in the rigor of their results. A high proportion of the studies focus on the aggregate contribution of transport infrastructure to the larger economy, usually measured by Gross Domestic Product (GDP) or Personal Income. Others emphasize the direct cost savings to firms from transport improvements as well as the indirect impacts of the cost and time savings in the form of gains from logistical reorganization. Finally, there is a nascent analytical concern with capturing explicitly the 'network' or general equilibrium effects of transport improvements on the various transport-using sectors in the broader economy. This emerging approach attempts the delineation of the various economic processes and mechanisms involved in translating transport improvements (via labor, and product markets and technical and organizational changes) into the wide-ranging economic impacts in the larger economy.
For the purposes of this paper, three broad approaches can be recognized in the available knowledgebase on transport-economy linkages. They are:
- Macroeconomic Models
- Microeconomic Models (including gains from logistics reorganization), and
- Models of General Equilibrium Effects.
Macroeconomic Models
The greatest proportion of analytical effort on the transport-economy linkages is represented by Macroeconomic modeling. The thrust of this approach is to relate the investments in transport infrastructure to GDP (Gross Domestic Product) in the economy. It views infrastructure as a direct injection to the economy and introduced typically as a factor of production additional to the traditional factors of capital and labor in a production function (Figure 2). In this form, it is possible to observe whether and to what degree infrastructure increases the level of economic output and enhances the productivity of private capital. Such positive economic relationships have been observed in most studies—both in the U.S. and abroad over the last two decades -- though the magnitude of the relationships between infrastructure investments and economic output varies widely across studies.
Figure 2. Infrastructure and Economic Growth
(a la Mera, Aschauer, Nadiri, et al)
Since the pioneering application of macroeconomic modeling to an estimation of transport-economy linkages by Koichi Mera (1973) in Japan, there has emerged a significant body of empirical work in the field as applied to U.S., Japan, India, Sweden, U.K., Germany, France, and Mexico. Despite a broad agreement among the studies in the U.S. and abroad on the positive contribution of transport infrastructure to the overall economy, there has been debate about the magnitude of this contribution. Some studies make dramatic claims about transport's contribution to American economic growthiv, while most studies in the U.S. and elsewhere infer more modest but variable contributions of transport infrastructure to economic productivity.
The consequent debate in the early 1990s about the magnitude of the economic impact of transport has had two salutary effects. First, a careful inspection and analysis of the differences among the empirical studies in this field – in terms of their model structures, in the statistical methods used, in their variable measurement concepts, and in their data – has led to broad acceptance of a positive and modest economic impact of transport infrastructure (Table 1).
| Country | Sample | Infrastructure Measure | Elasticity Range |
|---|---|---|---|
| United States | aggregate (ts) | public capital | output: 0.05 to 0.39 |
| United States | states (xs) | public capital | output: 0.19 to 0.26 |
| United States | states (ts/xs) | highway capital | output: 0.04 to 0.15 |
| United States | regions, trucking industry (ts/xs) | highway capital | cost: 0.044 to -0.07 |
| Japan | regions (ts/xs) | transportation & communication infrastructure | output: 0.35 to 0.42 |
| United Kingdom | aggregate (ts) | public capital | cost: negative, statistically significant |
| France | regions (xs) | public capital | output: positive, statistically significant |
| Germany | industry (ts/xs) | public capital, highway capital | cost: negative, statistically significant |
| India | aggregate (ts), states (xs) | economic infrastructure: roads, rail, electric capacity | cost: -0.01 to -0.47 |
| Mexico | national, 26 industries | transportation, communication & electricity, public capital | returns to public capital: 5.4% - 7.3% |
Note: ts=time series; xs=cross section
Second, a recent sophisticated study by Nadiri and Mamuneas (1996), that has addressed the methodological deficiencies of some earlier studies, has provided results on disaggregate impacts of transport infrastructure, which are widely well received. This study has made robust estimates of cost elasticities, marginal benefits of highway capital, and the contribution of highway capital to productivity growth for each of 35 industries in the U.S. economy. The rich framework developed in this study is helpful for posing a variety of related policy issues such as the willingness for a private sector to pay for an additional unit of transport infrastructure and the optimality of transport infrastructure.
Two major deficiencies remain with the macroeconomic approach. First, a major deficiency of the macroeconomic research is that it does not take into account the network character of roads or other transport modes. The productivity-enhancing impact of transport infrastructure depends on the spatial, temporal, and development stage of the network.v Second, the specification of impacts of transport infrastructure on production factors (labor, capital, and other factors) in macroeconomic models is too aggregate to be more than a “black box”. This black box needs to be unbundled. Transport infrastructure improvements, as noted below, impact on labor and other factor markets and on product markets in complex ways with positive and negative feedback loops--in the context of spatial agglomeration and potential innovation stimuli. The net outcomes of these complex mechanisms, namely the general equilibrium effects, are uncertain and contextual. Further research from the macroeconomic perspective must be complemented by an analysis from the general equilibrium view.
Microeconomic Benefits
Investments in transportation infrastructure can lead to better or cheaper freight services, which in turn lead to increased productivity of individual firms. We refer to these effects collectively as microeconomic benefits. Cost Benefit Analysis (CBA) is the conventional means of assessing microeconomic benefits. In this section we describe the different forms that microeconomic benefits can take and discuss how and to what extent they may be captured by CBA.
Figure 3. Microeconomic Impacts
The first and most obvious of these benefits is the reduction in inbound and outbound transportation costs. Highway infrastructure improvements – which may include additions of new roads, expansion or improvement of existing roads, and expansion of effective capacity though implementation of ITS – reduce costs for two reasons (Figure 3). First, as the network expands the density of its links increases, making point-to-point trips less circuitous and thereby reducing distances. Second, addition of new roads and capacity expansions on existing roads may decrease congestion and thereby travel times. Either way, the amount of transportation input per unit of production–measured in the first case in vehicle miles and in the second case in vehicle hours –goes down, hence an improvement in productivity.
CBA assesses such benefits according to the theoretical framework described in Figure 4. Here the horizontal supply function S is the constant cost of the transportation servicevi, and the downward sloping demand function D, is the amount users are willing to purchase at various prices. The difference between D and S (up to the amount Q, which is the equilibrium level of services consumed) is called the consumer surplus (CS). This is a measure of social benefit because it is the difference between what consumers actually pay and what they are willing to pay.
Figure 4. Microeconomic Impacts
Now suppose that an investment in transportation infrastructure reduces the cost of the services, as demonstrated by the downward shift of the supply function from S to S’. The increase in CS is the sum of the areas A (the benefit of reduced cost for Q) and B (the consumer surplus on the increase in services consumed from Q to Q' due to the cost reduction). This is the way CBA measures the user benefit arising from an infrastructure improvement.vii
It is important note here that CBA functions under the assumption that all benefits accrue to the consumer of transportation services. If the service provider has monopoly power, some of that benefit may be appropriated in the form of excess profits. Conventional CBA does not have a mechanism for calculating the value of such a producer surplus.viii
Given the assumption of perfect competition, the CBA framework can be extended in a number of ways. For example, if there is a negative externality associated with level of service consumed, the net benefit may be calculated as the user benefit minus the increase in the externality. If the transportation infrastructure in question is subject to congestion, the supply function S is increasing with Q, implying a reduction in CS for higher levels of service consumption.ix
Microeconomic benefits can, however, take a number of forms that are not easily captured in the conventional CBA framework. We discuss four here: logistical adjustments, consolidation of facilities, location effects and value added effects (Figure 3).
Logistical Adjustments
Logistics costs are the costs of assembling inputs at the production site and distributing output to the ultimate consumer. In addition to transportation costs, they include the cost of procuring and dispatching goods and the cost of carrying inventory. In recent decades, manufacturing, wholesaling and retailing industries have undergone a “logistical revolution” whose outcome has been substantial reductions in typical carrying costs (insurance, interest, and warehousing costs) achieved by reducing typical inventory levels. This is the essence of the “just-in-time” inventory principal.
The reduction in inventories is achieved by receiving and dispatching a larger number of smaller shipments. In order to reduce the possibility of stock shortfalls, shipments must arrive within fairly narrow time windows. Thus, inventory reductions are achieved at the cost of consuming more transportation services, both in a quantitative sense (more vehicle shipments) and a qualitative sense (more reliable delivery times.) Thus we have a substitution relationship between inventory-related inputs and transportation inputs.x
It therefore stands to reason that if an investment in infrastructure results in a decline in transportation costs, firms will reduce their inventory carrying costs by using more and better transportation services.xi But the benefit of the improved infrastructure to the firm will come not in the form of reduced transportation costs per unit of output, but rather in the form of reduced inventory carrying cost. How can we capture such a benefit in the CBA framework? (We return to this question shortly.)
Consolidation of Facilities
Falling transportation costs due to improved infrastructure can also make it possible for firms to concentrate production or distribution operations into a smaller number of facilities. Imagine a national wholesaler with ten warehouses scattered around the country. If the firm were able to consolidate its operations into a few locations, it could benefit from scale economies and save warehouse costs. However, consolidation would imply that the average length of shipments would be longer, thus scale economies are achieved only at the cost of more transportation services.
Again, it stands to reason that if transportation costs go down, firms will have an incentive to consolidate facilities.xii Thus, the benefits of the improved infrastructure will be realized in terms of savings in non-transportation costs.
Incorporating Logistical Savings and Consolidations in CBA
It is not at first clear that the conventional CBA framework as shown in Figure 4 can capture the benefits accruing from logistical adjustments and facilities consolidation because it does not reflect changes in inputs other than transportation. Since in either case non-transportation costs are reduced by increasing the consumption of transportation inputs, however, they can be captured by the effect of an outward shift in the demand function from D to D’ as shown in Figure 5. The story is as follows. If logistical practices and the number of facilities are held fixed, a reduction in cost from S to S’ leads to an increase in transportation services consumed from Q to Q’. If firms are able to make changes to logistical practices or consolidate facilities, there is a further increase from Q’ to Q’’. The increase in benefits now has two components: The areas A and B from Figure 4 and the area F shown in Figure 5. The latter captures the benefits of savings in non-transportation inputs.xiii
Figure 5
Location Effects
There are a number of ways that improvements in transportation infrastructure may contribute to productivity growth through mechanisms that involve the location choice of the firm.xiv For example, infrastructure investments promote productivity when firms are able to take advantage of agglomeration economies – essentially the efficiency benefits of locating in large clusters.xv Naturally, the benefits of agglomeration are at some point offset by the costs of congestion. In this sense, major investments in infrastructure that offset congestion within, as opposed to between production centers, expand the potential for agglomeration.
Expansion of transportation infrastructure – especially the Interstate Highway system – has increased the range of possible locations for producers of goods and services. “Greenfield” production sites located at the periphery of metropolitan areas or in rural areas have been sought by many producers to economize on land costs. Thus, just as firms are able to reduce inventory- carrying costs by increasing their use of transportation services, firms choosing peripheral locations along highways reduce land costs while consuming more transportation services.
It may seem contradictory to argue that transportation infrastructure promotes productivity on the one hand by allowing firms to cluster together in cities and on the other by allowing firms to spread out into the periphery. But this must be viewed in light of the fact that different firms benefit from different locations.xvi
For new, innovative products, acquiring appropriate labor skills, developing product innovations, and market penetration are the key concerns, so firms do best in urban core locations. For more established goods and services, implementing process innovations, and economizing on the cost of inputs such as labor and land are the main competitive strategies, so firms do best in the periphery. The main point is that a transportation system that provides sufficient capacity and connectivity benefits all firms by expanding the range of locations from which they can choose.
Transportation and Value Added
So far we have discussed the microeconomic benefits of transportation system improvements in terms of cost reduction. Cost reductions translate into productivity enhancements and therefore they can explain much of the impact of transportation infrastructure on productivity growth as observed in the macroeconomic literature.
Another way that transportation infrastructure can enhance productivity is by adding value to the output of either the freight using firms or the transportation service provider. Take fresh fish as an example. The best way to add value to a fish is do nothing to it – except get it to the consumer quickly. Fresh fish is worth more than salted, frozen, or otherwise processed fish. Improvements in transportation service that make it possible to get a fish from Maine to St. Louis in less than 24 hours after it is caught are a major source of productivity enhancement. The justification for interpreting this as a case of adding value, rather than just reducing costs, is that the fish can only be produced in one or a few places and may have a scarcity value elsewhere. Thus, transportation makes it possible for the fish-producing firm not only to expand markets but to reach markets where its output has a higher value than in its local market.
As another example, consider a machine that is used in a production process. The firm that uses the machine will pay more for it if they can be certain that it will never be out of service for more than a few hours. The firm that produces the machine will able to make such a guarantee – and therefore charge a higher price – if they know that it will be possible to ship necessary parts to the machines location if there is ever a breakdown. Thus the availability of high-quality transportation service increases the value of that machine.
Improved infrastructure can also add value to the services of transportation providers. For example, higher capacity and implementation of ITS infrastructure can help trucking firms deliver goods not only cheaper but also within narrower time windows. They can also provide real time tracking information and a high level of flexibility regarding the volume, location and frequency of shipments. All of this makes the service more valuable to the client.xvii
General Equilibrium Benefits
We now turn to those benefits from improvements to transportation infrastructure that cannot be assessed at the level of the individual firm. General equilibrium benefits occur when cost reductions or improvements in transportation services result in a redistribution of resources across firms and regions in such a way as to increase aggregate productivity. An important question here is whether CBA can adequately capture the general equilibrium benefits of infrastructure investment.
Figure 6. General Equilibrium Effects
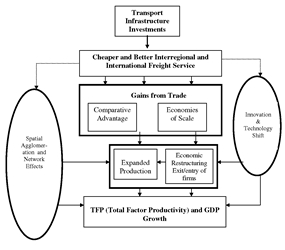
General equilibrium benefits arise in the form of gains from trade. One of the main historical consequences of improved transportation services has been a shift from a regime of economic autarky, whereby each region or nation produces a wide variety of goods to satisfy its own demands, to one of specialization and trade, whereby each region or nation concentrates its productive resources on a smaller number of goods and services and trades in order to satisfy it full range of demands.
This may yield economic benefits for two reasons. First, different regions have different resource endowments, which make them most efficient at producing different things. If each region specializes in those things it can produce most efficiently, overall productivity is enhanced. Second, even if all regions are similarly endowed, specialization implies that each region produces fewer goods, but more of each good it produces. Thus, economies of scale are realized. These two explanations for gains from trade are associated with two streams of economic theory—the theory of comparative advantage and the “new economic geography”—each of which has something interesting to say about the effects of improved transportation.
Comparative Advantage
The theory of comparative advantage has its roots in the 19th century when the British economist David Ricardo argued against the “corn laws” which restricted imports of agricultural commodities into Great Britain. Corn law supporters argued that there could be no possible economic justification for importing grain since British agriculture was at least as efficient as agriculture in countries from which cheap imports originated. Ricardo countered that even if Britain had a small efficiency edge on other countries in agricultural production, it had a very large efficiency advantage in manufacturing production. Since there were fixed amounts of labor and capital resources available in Britain, British agricultural production had a high opportunity cost because it diverted resources from more lucrative manufacturing production. Thus even though Britain had an absolute advantage over its potential trading partners in both agriculture and manufacturing, it had a comparative advantage only in manufacturing. British agriculture was at a comparative disadvantage because of its high opportunity cost. Therefore, if foreign grain were imported and resources were transferred from agriculture to manufacturing, both Britain and its trading partners would be better off.
Ricardo's ideas have been refined by modern economists,xviii but the basic message is the same: all trading partners are better off if they specialize in those things in which they have comparative advantage than if they seek to achieve self sufficiency by producing a large variety of goods. Note that this is a general equilibrium benefit in that it does not arise due to improved productivity in individual production units, but rather from a redistribution of production that leads to higher aggregate productivity. An important caveat to this, however, is that gains from trade can only be realized to the extent that they exceed the transportation costs needed to achieve them. Therefore one of the most important benefits of improved transportation infrastructure arises from its role in enabling gains from trade.
The theory of comparative advantage has been the major economic argument in favor of liberalizing international trade. One might assume therefore that economic benefits in the form of gains from trade arise primarily from investments in infrastructure built mainly for international trade: international shipping and air facilities, international bridges, facilities for rapid border clearance etc. In fact, recent experience shows that such infrastructure, along with complementary institutional changes, is critical to the success of regional economic integration initiatives (Lakshmanan Subramanian, Anderson and Leautier, 2001.) The role of infrastructure in trade creation, however, extends more broadly to the national infrastructure system, since domestic transportation is needed to bring export goods to international gateways.xix
More importantly, the notion that transportation infrastructure yields economic benefits that come in the form of gains from trade applies just as well to domestic trade as to international trade – especially in an economy as large and diverse as ours. The United States economy is a multiregional economy comprising a set of distinct but highly integrated economic regions, each with a system of urban centers and resource hinterlands. In such a national economy the theory of comparative advantage applies just as well as it does in, say, Europe where differentiated regional economies exist within national frontiers.
The railroads, the inland and coastal waterways, and the National Highway System provide the critical links that make regional specialization and interregional trade possible. Evidence of the increasing specialization over the second half of the twentieth century is found in the fact that ton-miles of freight grew more rapidly than tons of freight, especially in the period for 1960 to 1980 (see Table 1). Under systems of autarky and regional specialization, the same number of tons might be shipped, but the average distance of shipment would be much greater in the latter. Thus growth in the average distance over which a ton of freight is shipped is consistent with increasing regional specialization and interregional trade.
What implication does this have for assessing the benefits of transportation investments? Any project that makes interregional trade easier and cheaper results in improved efficiency (and thereby reduced costs) for those goods that are shipped interregionally. At first blush it might seem that CBA, with an apparently partial equilibrium orientation, will miss this benefit. However, under of conditions of perfect competition the increase in trade will occur up to the point where the cost reduction from specialization and trade is just offset by the transportation cost. Thus, the benefits derived from increased travel captures the gains from trade.
This argument is fine from a theoretical perspective, but it suffers somewhat in the implementation. CBA is normally applied ex ante - that is the calculation is made before the infrastructure investment is made. (Otherwise it would be of little use as a decision tool.) This means that the analyst must predict the increase in the demand for transportation services in order to calculate growth in consumer surplus. Accurate predictions of the full range of economic integrations that may occur after the addition of a major infrastructure improvement is a challenging requirement that is seldom met in applied CBA. Not only would changes in aggregate trade flows need to be predicted, but since this is a relatively long-term phenomenon the timing of the changes must be estimated in order to conduct appropriate discounting.xx
An initial step toward assessing the magnitude of gains from trade attributable to infrastructure investments would be to conduct a series of ex post cost benefit analyses where the observed trade impacts are measured some years or decades after an improvement is made. This ex post approach would serve both as a means of assessing the magnitude of the benefits from highway construction that arise due to growth in interregional trade and as a means of comparing benefits calculated after the fact to those found in ex ante CBA studies for the same projects.
The New Economic Geography
Comparative advantage essentially says that gains from trade arise out of diversity across nations. But many of the most important trade relations occur between places that are in fact very similar, such as the United States and Canada or states within the European Community. Furthermore, in many bilateral trade partnerships, goods in the same industry group flow in both directions across the border. Such intra-industry trade is again inconsistent with the theory of comparative advantage, which envisions only exchanges of dissimilar goods.
In light of the inability of comparative advantage to explain some important trends in trade, a new analytical framework called the “new economic geography” has emerged. Where the theory of comparative advantage is driven by variations in endowments, the new economic geography is driven by scale economies. The crux of this theory is that even if all regions have identical endowments, if each region specializes in unique goods that it supplies to all other regions, it will achieve higher productivity though economies of scale. Naturally the theory is more complicated than this.xxi It is based in a model where product variety is the critical component of competition so that all firms produce distinct but substitutable goods. Consumers’ utility functions are defined in such a way that they prefer to consume a variety of goods rather than to concentrate their production on a small number of goods. Thus goods are imperfect substitutes. This means that each firm has some degree of monopoly power and can therefore set its price above its marginal cost. The cost structure for each firm includes a fixed component and a constant marginal cost, which results in a downward sloping average cost function indicative of scale economies.
By opening up trade, producers in each region are able to reach broader markets for their unique goods, allowing them to move down their average cost curves and earn greater profits. Naturally this market expansion effect is limited by interregional transportation costs so any reduction in transportation costs yields increased trade benefits.xxii The model also integrates consumer demand and labor markets.
While a fuller explanation of the theory is provided in section IV of the paper, a few of its advantages are worth noting. By stressing the role of product differentiation, it brings theory more in line with modern economies, where homogeneous commodities play shrinking roles. Product differentiation naturally leads to imperfect competition and the inclusion of scale economies permits a formal treatment of spatial phenomena such as agglomeration economies and regional wage differences. Most importantly from our perspective, the inclusion of space naturally leads to a more central role for transportation.
A recent study commissioned by the Standing Advisory Committee on Trunk Road Assessment in the United Kingdom illustrates some of the new insights that can be gained by applying the analytical framework of the new economic geography to questions of transportation investment.xxiii The authors developed a computable general equilibrium (CGE) model based on hypothetical data and parameters incorporating the principals of monopolistic competition as described above. It includes two or more regions, each with endowments of two primary inputs: immobile capital and labor, which is mobile in the long run. Equilibrium wage rates are determined at the regional level. Each region includes some competitive and some monopolistically competitive industries and input-output parameters describe the linkages among industries in terms of intermediate goods flows. Since firms will enter any monopolistically competitive industry where excess profits are being earned, expansion will occur in industries and regions whose profits expand due to a change in transportation costs.
Because of the multiregional structure of the simulation, it was possible to identify circumstances where reductions in transportation costs would have differential regional impacts. For example, the hypothetical simulations illustrated that:
- Lower transportation costs lead to greater regional specialization;
- Reducing transportation costs along two routes simultaneously yields benefits that are greater than the sum of benefits when they are lowered independently;
- Transport cost reductions that have positive benefits in aggregate may have negative effects on some regions; and
- Reduction in transportation cost may reduce or increase interregional wage differences, depending upon the context.
The report also asked the question: Is CBA an accurate method for evaluating transportation infrastructure investments when the industries that consume transportation services are monopolistically, rather than perfectly, competitive? Their answer was no, for two reasons. The first we have already discussed: under imperfectly competitive markets, certain types of benefits are hidden from conventional measurement of CBA. The second reason is perhaps less evident: in a world of imperfect competition and scale economies, certain general equilibrium effects are too small to be ignored. In each of the simulations conducted with the model, the authors compared the general equilibrium benefits to those that would be calculated using conventional CBA and found the latter to underestimate benefits by wide margins. (How to interpret the size of these margins is an open question, however, given the hypothetical nature of the simulations.)
These results have a variety of implications. For one thing, they reinforce the message that in an imperfectly competitive world, conventional CBA analysis tends to underestimate benefits of transportation investments. They also show that specific transport cost reductions can have spatially variable impacts and that reductions that are beneficial in the aggregate can be detrimental to certain places – a result that economic historians will hardly find surprising! More generally, they illustrate the point we made earlier that the benefits accruing from an infrastructure investment depend on the context within which the investment is set.
But what is the implication for the evaluation of individual projects? The importance of context as highlighted in these results suggests that is unlikely that a simple one-size-fits-all framework can identify all the potential benefits and costs of non-marginal infrastructure projects. Is it therefore necessary to abandon CBA and adopt more complex and flexible CGE models as the standard framework?
To answer this, we must be mindful of the fact that both the theoretical and especially the empirical development of these models is in its infancy. CGE models as they exist today are complex and data hungry, so promising benefits from hypothetical simulations don't necessary imply that working empirical models can be developed.
The most prudent course is therefore to continue using CBA – including the most current methods to adjust for externalities, demand shifts etc. – as an initial quantitative estimate of the efficiency of any project, but to follow up with more qualitative analyses to determine whether the CBA results are likely to underestimate or overestimate true net benefits. In these more qualitative analyses, the types of issues pointed out in the new economic geography should be given special attention.
Technology Shifts
There have been times in history when expanded freight services have made radical changes in the structure of production possible. For example, the development first of canals and later of railroads made it possible for huge areas of the central lowlands of the U.S. to be developed for specialized agriculture serving a national market. To a degree this fits into the standard comparative advantage argument described above, except that rather than a shift from autarky to specialization it involved the creation of new economic regions whose growth was driven from an early stage primarily by export commodities. Furthermore, it involved a fundamental transformation of production technologies, achieving much higher productivities through specialization and large-scale production. It can be argued that a host of improvements in agricultural technology were induced, at least in part, by the expanded market opportunities made possible by freight improvements.
Another example is the industrial revolution in textile production that occurred on a global scale in the 19th century. In this case, improved freight carriage made it possible to develop a production system that required the movement of material inputs of cotton from production region (US South, Egypt, India) to production centers in England and New England. Thus, unlike the example above where freight made it possible for a specialized production region to reach broader markets, in this case freight made it possible for widely separated but complementary regions to be integrated into a specialized production system. Again, this story has elements of comparative advantage, but it involves a fundamental shift in technology made possible by improved freight. The key issue is this, while both comparative advantage and the new economic geography assume production technologies which are exogenous and fixed, historical examples suggest that new trade opportunities have at times given rise to technological shifts, resulting in an endogenous change in the production technology.
The two historical examples illustrate the role that freight improvements play in fundamental shifts in technology. It is likely that freight improvements provide opportunities for more marginal shifts on an ongoing basis. For example, the interstate system not only allowed producers to seek out locations with lower land costs, but also allowed them to implement more space-intensive technologies to enhance efficiency. Reductions in the cost of global trade due to innovations such as containerization set the stage for a general transformation to global production systems whereby inputs and components are sourced internationally.
While it is almost impossible to predict technology shifts, a lot could be learned from ex post empirical studies that attempt to identify them. Case studies of industries that have undergone rapid transformations in production technologies or logistical organization could seek to determine whether technological progress was either enabled or spurred on by new or improved freight transportation options. Such studies need not be limited to goods producing industries, but could also include large-scale retail operations that are currently in a phase of rapid technological transformation.
Lessons Learned
Freight transportation continues to play a critical role in the U.S. economy. In recent years this role has been reinforced by qualitative changes in the nature and scope of freight services offered. Not only have the costs of freight services declined, but firms in the freight service sector now offer a broader range of enhanced services allowing freight-using firms more flexibility to restructure their logistical and production activities, and thereby achieve non-transportation cost reductions. This is in large part the outcome of novel applications of IT in the freight service sector and continued public investment in transportation infrastructure. Given its central role in the development of the highway network, FHWA has a critical interest in a better understanding of the role of transport investments in enabling freight service firms to achieve these logistical improvements and related efficiencies, which not only enhance these firms' productivity, but also that of transport using firms in the larger economy.
Prior to the seminal work of Koichi Mera in the 1970’s, assessments of the economic impacts of investments in transportation infrastructure were limited to appraisals of individual projects. Such appraisals provided relatively little insight into the broader role that transportation infrastructure plays in aggregate economic growth and productivity. Despite variations in data, methods, and the magnitude of the effects they uncovered, the sequence of macroeconomic analyses conducted in the U.S. and abroad over the past twenty-five years has identified a persistent, positive influence of transportation investments on aggregate economic performance.
While it is important to know that highway and other transportation investment programs are conferring economic benefits, macroeconomic studies tell us relatively little about the actual mechanisms through which these benefits arise. Policy formulation must address not only the question of whether to invest in infrastructure, but also the question of which among an array of potential projects will yield the greatest economic return. In order to answer this second question, it is necessary to open up the “black box” of macroeconomic studies and attribute economic benefits to specific mechanisms that may vary across projects due to location, network relationships, and other contextual factors.
In this paper we have looked at the underlying mechanisms from two perspectives: the microeconomic (partial equilibrium) perspective and the general equilibrium perspective. From the microeconomic perspective, individual firms benefit from cheaper, better, and faster freight services – benefits that can be captured in a conventional CBA framework. But cheaper and better transportation services may lead to savings in non-transportation inputs as well. For example, presented with lower transportation costs producers may choose to reduce inventories or consolidate facilities, even if it means consuming more transportation services. Important work is underway to incorporate these types of effects into CBA calculations.xxiv There are still other possible benefits that, to date, have not been incorporated into the CBA model. For one thing, improved infrastructure increases the locational flexibility of firms, which in turn can lead to a variety of efficiency improvements. Also, there are a number of ways in which improved infrastructure allows firms to add value – this includes both providers of transportation services and freight-consuming producers of other goods and services.
The general equilibrium perspective highlights a different kind of benefits from improved transportation. These benefits arise from economy-wide adjustments and redistributions. The key notion here is gains from trade, whereby aggregate efficiency is enhanced when cheaper or better transportation promotes interregional and international specialization and trade. The theory of comparative advantage tells us that producers and consumers are better off when each region specializes in those goods and services it can produce most effectively. High quality, affordable transportation makes this possible. The “new economic geography” shows that in the presence of scale economies and imperfect markets, reduced transportation costs can lead to a host of economic transformations that yield aggregate economic benefits. One of the most important lessons from this emerging line of theory is that the impacts of transportation improvements are context dependent. So, for example, the outcome of a new corridor connecting two regions depends on such things as the state of the pre-existing transportation network; the relative size, wage level, and state of economic development of the two regions; and the degree of type and competition of markets functioning in both regions. Clearly, if this is the case, economic assessments must incorporate a broader range of interrelationships and data than is typical in current practice.
Beyond conventional gains from trade, better transportation can also lead to major shifts in technology that bring about improvements in aggregate efficiency. Specialized commercial agriculture, the industrial revolution, and the globalization of production all represent technological transformations that would not have been possible without non-marginal improvements in transportation systems. Smaller, more incremental technological shifts most probably arise with each successive boost in transportation performance.
With the exception of the direct cost and time savings that are captured in conventional CBA, our ability to measure any of the main categories of benefits described here is relatively poor. Many of the impacts we describe have only been derived from theory or demonstrated by means of hypothetical simulation. Some experts, while conceding that a broad range of indirect benefits may exist, argue that the values of these benefits are probably small and therefore conventional CBA is sufficient. xxv Others counter that once you abandon assumptions of perfect competition and constant returns to scale, indirect effects can be cumulative and large.xxvi
Given our degree of uncertainty about many of these benefits, research along two avenues is warranted. The first is the expansion of our analytical toolbox to include a broader range of economic mechanisms. This includes further elaboration of CBA to capture the effects of logistical transformation, productivity-enhancing location shifts, and value-added effects. It also includes the development of more comprehensive frameworks such as CGE (Computable General Equilibrium) models. While the application of these models to transportation analysis is still a nascent field, a lot can be learned from operational models that are currently applied to international trade, tax policy and a number of other fields.
The second avenue of research comprises ex post assessment of major infrastructure projects and programs. By means of a more historical perspective we can ask a number of critical questions such as: To what extent did improved infrastructure lead to increased specialization and expansion of markets? How do freight service firms take advantage of improved infrastructure to offer cheaper and better services? What logistical, technological and locational innovations followed in the years after the project's completion? How did such economic adjustments translate into higher productivities and incomes? Naturally, such assessments must be more than just case studies; they must apply appropriate analytical methods to identify those economic changes that can be attributed to the infrastructure improvement from those that would have occurred without it.
Such a research program is ambitious, but its payoffs may be great. Its goal will be to create both a better understanding of the role of transportation in the economy and better analytical capacity to support more informed decisions about transportation infrastructure decisions in the future, and an increased capacity to serve the Department of Transportation Strategic missions of improving the national economy and national competitiveness.
REFERENCES
Aschauer D. A., 1989. “Is Public Expenditure Productive?”, Journal of Monetary Economics, vol. 23., pp. 177-200.
BTS (Bureau of Transportation Statistics), 1995. Transportation Statistics Annual Report: The Economic Performance of Transportation, Washington. D.C.
Ciccone, A. and R.E. Hall, 1996. “Productivity and Density of Economic Activity”, American Economic Review, 86: 54-70.
Dixit, A. and J.E. Stiglitz, 1977. “Monopolistic Competition and Optimum Product Diversity” American Economic Review, 67(3): 297-308.
Findlay, Ronald, 1995. Factor Proportions, Trade and Growth, Cambridge MA: MIT Press.
Fisholow, A., 1965. American Railroads and the Transformation of the Ante-Bellum Economy Cambridge, MA: Harvard University Press, pp. 306-11.
Fujita, M., Paul Krugman, and A.J. Venables, 1999. The Spatial Economy, The M.I.T. Press. Cambridge, Mass.
Hickling, Lewis, Brod Inc., 1995. Measuring the Relationship Between Freight Transportation and Industry Productivity: FINAL REPORT, NCHRP 2-17(4), Washington: Transportation Research Board, National Research Council.
HLB Decision Economics Inc., 2001. Cost-Benefit Analysis of Highway Improvements in Relation to Freight Transportation: Micro-Economic Framework, Draft Report, Federal Highway Administration, July 12, 2001.
Lakshmanan, T.R., U. Subramanian, W.P. Anderson and F. Leautier, 2001. Integration of Transport and Trade Integration Book Series in “Directions in Development”, World Bank. Washington. D.C.
Lewis, D., 1991. Methodologies for Evaluating the Effects of Transport Policies on the Economy. National Cooperative Highway Research Program Report 342., Transport Research Board, Washington, D.C.
Mackie, Peter and John Nellthorp, 2001. “Cost Benefit Analysis in Transport” in K.J. Button and D.A. Hensher (eds.) Handbook of Transportation Systems and Traffic Control, Oxford: Pergamon.
McCann, Philip, 1998. The Economics of Industrial Location: A Logistics-Costs Approach, Heidelberg: Springer.
McKinnon, Alan C. and Allan Woodburn, 1996. “Logistical Restructuring and Road Freight Traffic Growth: An Empirical Assessment,” Transportation, 23:141-161.
Mera, K., 1975. Income Distribution and Regional Development, University of Tokyo Press, Tokyo, Chapter IV.
Munnell, A. H., 1990. “Why has Productivity Growth Declined: Productivity and Public Investment,” New England Economic Review. January/February: 2-33.
Nadiri, Ishaq, M. and T. P. Mamuneas, 1996. Constitution of Highway Capital to Industry and National Productivity Groups. Report prepared for FHWA. Office of Policy Development.
Shirley, Chad and Clifford Winston, 2001. An Econometric Model of the Effect of Highway Infrastructure Investment on Inventory Behavior, Project Status Report to FHWA, May 2001.
Venables, Anthony J. and Michael Gasiorek, 1999. Welfare Implications of Transport Improvements in the Presence of Market Failure, Report to the Standing Committee on Trunk Road Assessment, London: Department of Environment, Transport and the Regions.
Weisbrod, Glen and Frederick Treyz, 1998. “Productivity and Accessibility: Bridging Project-Specific and Macroeconomic Analyses of Transportation Investment,” Journal of Transportation Statistics, 3:65-79.
i National Transportation Statistics, BTS, USDOT
ii e.g. Fishlow, 1965; BTS, 1995
iii Eno, 1997
iv Aschaeur, 1989; Munnel, 1990
v The problem is elaborated upon in the more detailed white paper of which this paper is a synopsis.
vi The cost includes tolls and users costs of labor, fuel, capital depreciation etc. The user costs may be a function of distance, travel time, or both.
vii The user benefit is approximated by the “rule of half”: ½ (S-S’)(Q+Q’). This general procedure is repeated for personal transportation users as well as freight transportation users and the sum of freight and personal benefits are weighed against the project cost.
viii This sort of market distortion is not limited to the case where there is imperfect competition in the market for transportation services. The same applies if there is a monopolist in a freight consuming goods or service market. Benefits of investments in transportation infrastructure may be assessed from the perspective of derived demand for transportation services. Venables and Gasiorek (1999) have shown that in such cases CBA underestimates benefits
ix These extensions are explained further in the companion paper.
x A good theoretical treatment of total logistics cost minimization is found in McCann, 1988. The idea of a substitution relationship between transportation inputs and other inputs is due to HLB, 2001.
xi In support of this idea, there is recent empirical evidence that expenditures on highway infrastructure has a negative effect on inventory levels at the state level (Shirley and Winston, 2001.)
xii Empirical studies in the United States (Hickling, 1995) and the United Kingdom (McKinnon and Woodburn, 1996) indicate an important trend toward cost savings through facilities consolidation, although neither can demonstrate a direct causal link with transportation costs.
xiii This approach, which is expanded upon in the companion paper, was introduced in HLB 2001, which also presents potential means of calculating the value of F.
xiv This runs counter to the conventional wisdom whereby location shifts should not be counted among the benefits of highway infrastructure. That argument is correct so far as the shifts simply reflect transfers of identical production activities from one location to another. But the spatial shifts described here are productivity enhancing and in therefore they produce real benefits.
xv The notion of agglomeration economies has long been used by geographers as a conceptual tool to explain the emergence of cities, and has gained empirical support from recent econometric studies that attribute significant productivity benefits to economic agglomeration (Ciccone and Hall, 1996.)
xvi The product life-cycle model (Vernon, 1966) argues that products and the industries that produce them pass through stages in their histories over which their main business requirements evolve.
xvii In assessing these benefits, care must be taken to avoid double counting – for example, the increase in the value of a trucking firm's services may be equivalent to the logistics cost savings of its client
xviii The modern version of the theory of comparative advantage is known as the Heckscher – Ohlin – Samuelson framework (Findlay, 1995.)
xix For example, a recent study by the Bureau of Transportation shows that 10.4% of U.S. freight movements over domestic road and rail infrastructure are ultimately to support international trade.
xx Some attempts have been made to incorporate competitive business expansion impacts into CBA (Weisbrod and Treyz, 1998) but they are rather ad hoc and generally only applied to changes in output for a single region or cluster of regions.
xxi The basic model exploits the analytical breakthrough of Dixit and Stiglitz (1977) who incorporated scale economies into a general equilibrium model assuming a monopolistically competitive market structure. A good overview is found in Fujita, Krugman and Venables 1999.
xxii In the long run, however, more firms – each providing a unique product variety – will enter any market where profits are being earned. The presence of more firms shifts the demand curves of all preexisting firms downward until excess profits are exhausted. Thus it is entry of new firms that brings about an equilibrium.
xxiii Venables and Gasiorek, 1999.
xxiv Lewis 1991; HLB 1995, 2001.
xxv See for example Mackie and Nellthorp, 2001
xxvi Venables and Gasiorek, 1999.
previous | next