Freight and Congestion
Congestion affects economic productivity in several ways. American businesses require more operators and equipment to deliver goods when shipping takes longer, more inventory when deliveries are unreliable, and more distribution centers to reach markets quickly when traffic is slow. Likewise, both businesses and households are affected by sluggish traffic on the ground and in the air, reducing the number of workers and job sites within easy reach of any location. The growth in freight is a major contributor to congestion in urban areas and on intercity routes, and congestion affects the timeliness and reliability of freight transportation. Long-distance freight movements are often a significant contributor to local congestion, and local congestion typically impedes freight to the detriment of local and distant economic activity.
Growing freight demand increases recurring congestion at freight bottlenecks, places where freight and passenger service conflict with one another, and where there is not enough room for local pickup and delivery. Congested freight hubs include international gateways such as ports, airports, and border crossings, and major domestic terminals and transfer points such as Chicago's rail yards. Bottlenecks between freight hubs are caused by converging traffic at highway intersections and railroad junctions, steep grades on highways and rail lines, lane reductions on highways and single-track portions of railroads, and locks and constrained channels on waterways. A preliminary study for the Federal Highway Administration (FHWA) identified intersections in large cities, where both personal vehicles and trucks clog the road, as the largest highway freight bottlenecks (USDOT FHWA 2005a).
As passenger cars and trucks compete for space on the highway system, commuter trains and freight trains compete for space on the railroad network in metropolitan areas. The growth in rail freight is occurring at the same time rising fuel prices and environmental concerns are encouraging greater use of transit.
Congestion also is caused by restrictions on freight movement, such as the lack of space for trucks in dense urban areas and limited delivery and pick-up times at ports, terminals, and shipper loading docks. One estimate of urban congestion attributes 947,000 hours of vehicle delay to delivery trucks parked at curbside in dense urban areas where office buildings and stores lack off-street loading facilities (ORNL 2004). Limitations on delivery times place significant demands on highway rest areas when large numbers of trucks park outside major metropolitan areas each night waiting for their destination to open and accept their shipments (USDOT FHWA 2002).
Bottlenecks cause recurring, predictable congestion in selected locations while the temporary loss of capacity, or nonrecurring congestion, is widespread and less predictable. Sources of nonrecurring delay include incidents, weather, work zones, and other disruptions. These nonrecurring, often-unpredictable, sources of highway delay have been estimated to exceed delay from recurring congestion (ORNL 2004). Weather, maintenance activities, and incidents have similar effects on aviation, railroads, pipelines, and waterways. Aviation is regularly disrupted by local weather delays, and inland waterways are closed by regional flooding and droughts.
Additionally, freight congestion is caused by other factors that are considered either recurring if they are systemic problems or non-recurring if they represent an isolated event. Recurring and non-recurring sources of freight congestion include equipment shortages, short-term labor disruptions, and long-term shortages in key occupations such as truck drivers, inefficient operating practices at terminals and border crossings, and traffic backups at toll booths. Technology is reducing some of these sources, such as through electronic toll collection.
Highway Congestion
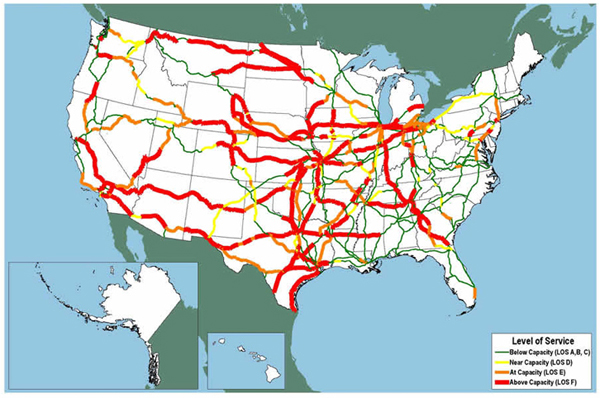
Trucks must contend with congested urban areas for most intercity trips. Recurring peak-period congestion slowed traffic on more than 10,600 miles of the NHS and created stop-and-go conditions on an additional 6,700 miles in 2002. Interstate commerce is most affected on congested segments that carry at least 10,000 trucks per day, including 3,300 miles with slowed traffic and an additional 3,000 miles with stop-and-go conditions (Figure 11, see page 18).
Figure 11. Peak-Period Congestion on High-Volume Portions of the National Highway System: 2002
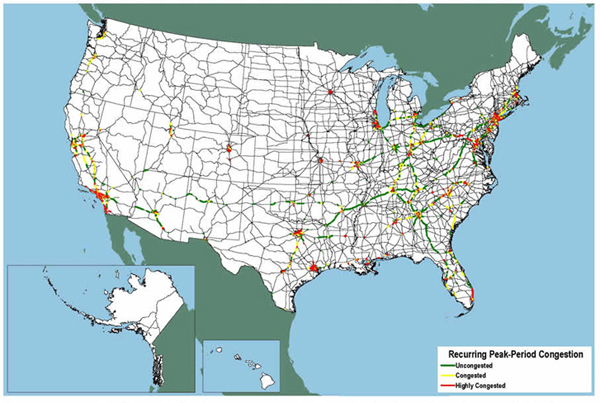
Source: U.S. Department of Transportation, Federal Highway Administration, Office of Freight Management and Operations, Freight Analysis Framework, version 2.2, 2007.
Congestion is forecast to spread from larger urban areas and a few intercity routes to large stretches of intercity highways in both urban and rural areas. Without operational improvements or additional capacity between now and 2035, recurring peak-period congestion is forecast to slow traffic on 20,000 miles of the NHS and create stop-and-go conditions on an additional 45,000 miles. Highway segments with slow traffic and more than 10,000 trucks per day are forecast to increase to more than 10,000 miles, while stop-and-go traffic on segments with more than 10,000 trucks per day is expected to occur on an additional 23,000 miles (Figure 12, see page 19).
Figure 12. Peak-Period Congestion on High-Volume Portions of the National Highway System: 2035
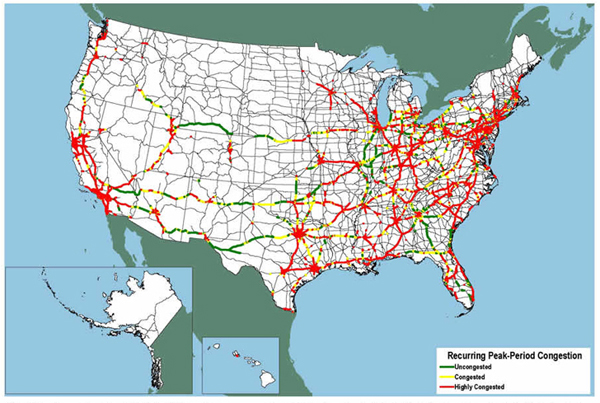
Source: U.S. Department of Transportation, Federal Highway Administration, Office of Freight Management and Operations, Freight Analysis Framework, version 2.2, 2007.
Although freight congestion occurs throughout the nation, some local bottlenecks account for a substantial share of the total disruption. The top 10 highway- interchange bottlenecks cause an average of 1.5 million annual truck hours of delay each, compared to less than 250,000 annual hours of truck delay for other truck bottlenecks (USDOT FHWA 2005a).
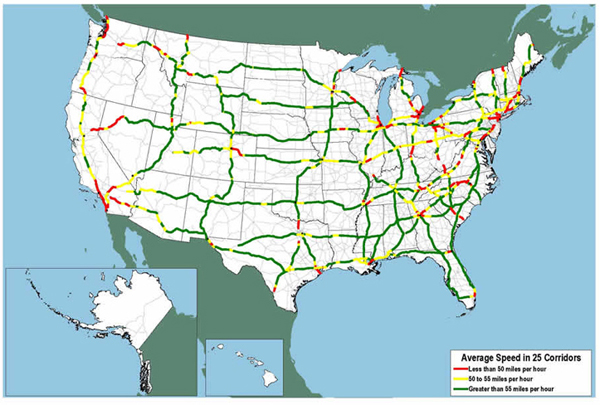
Until recently, estimates of highway delay have been based on comparisons of traffic volumes to physical highway capacity. To supplement these estimates with direct measures, FHWA and the American Transportation Research Institute are working together to calculate average truck speeds and travel time reliability using automatic vehicle location and mapping technologies. Data are being collected for approximately 32,000 miles of Interstate highways on 25 of the most heavily traveled routes (Figure 10) and at major border crossings (USDOT FHWA 2006). These data identify congested locations from all sources of delay, including both recurring and nonrecurring congestion.
Figure 10. Average Truck Speeds on Selected Interstate Highways: 2007
Railroad Congestion
Class 1 (large interregional) freight railroads are experiencing significant growth in demand after decades of responding to a relatively stagnant market by reducing trackage by about 50 percent between 1960 and 2000 (USDOT BTS 2002). Trailer-on-flatcar and container-on-flatcar service, once a small market, is now a major source of traffic and revenue, with high speed intermodal trains vying for space on the network with slower trains carrying bulk commodities. Seasonal surges in freight demand and disruptions from incidents and maintenance activities add to congestion as volumes reach capacity on the reduced mainline railroad network. Class 1 railroads are responding with operational improvements and capital expenditures. In 2006, railroads invested $8.5 billion on renewal of existing roadway, structures, and equipment, and on expansion to serve additional traffic (AAR 2007). The results are relative stability in average speeds and terminal dwell times for each of the major railroads in 2007 (Railroad Performance Measures 2008).
Investment in Southern California's Alameda Corridor illustrates how improved freight flows through a local bottleneck affect destinations well beyond the metropolitan area and the State. The project reduced congestion on rail connections between the Ports of Los Angeles and Long Beach and the rest of the nation, as well as congestion on streets in the Los Angeles area that formerly crossed the railroad at grade.
Congestion on the mainline railroad network is forecast to spread significantly by 2035 (Figures 13 and 14). Using volume-to-capacity comparisons similar to highway calculations, the Association of American Railroads reports that rail lines experiencing unstable flows and service break-down conditions will increase from 108 miles today to almost 16,000 miles (30 percent of the network) in 2035 if current capacity is not increased. Rail routes that have moderate to very limited capacity to accommodate maintenance without serious service disruptions and to recover quickly from incidents will increase from 6,413 miles today to over 12,000 miles in 2035, affecting 25 percent of the network (AAR 2007).
Figure 13. Current Train Volumes Compared to Current Capacity
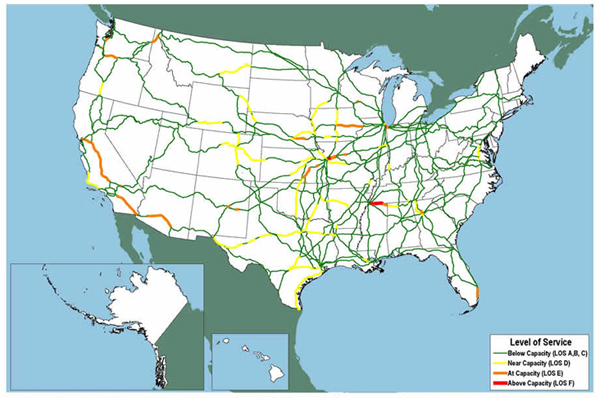
Source: Association of American Railroads, National Rail Infrastructure Capacity and Investment Study prepared by Cambridge Systematics, Inc. (Washington, DC: September 2007), figure 4.4, page 4-10.
Figure 14. Train Volumes in 2035 Compared to Current Capacity
Source: Association of American Railroads, National Rail Infrastructure Capacity and Investment Study prepared by Cambridge Systematics, Inc. (Washington, DC: September 2007), figure 5.4, page 5-5.
The picture for short-line and regional railroads is less clear. Very few statistics are collected on this segment of the industry, which included 34 regional railroads and 529 local railroads in 2001 (ASLRRA 2002). Some of these railroads provide links between port facilities and Class 1 railroads, while others serve small communities and shippers in rural areas.
Waterway Congestion
Deep draft ports experience congestion as space for increasing volumes of import and export cargo is limited by factors such as environmental and community concerns. Congestion also occurs when vessels arrive at the same time rather than spread through the week. Most ports must look to operational improvements to increase capacity and reduce congestion, such as reducing the amount of demurrage allowed for containers at terminals, instituting chassis pools, and moving to stack operations.
Even when ports can berth and unload a ship quickly, the increasing size of container ships is moving congestion from ports to access roads and railroads. The number of the world's Post-Panamax vessels, container ships that are too large to fit through the Panama Canal, increased from 331 in 2001 to 561 in 2004, with another 426 on order (USDOT MARAD 2005).
On inland waterways, lock operations and aging infrastructure cause continuous bottlenecks. In 2007, 31 percent of the 510,000 commercial vessel passages through federal and state locks experienced delay. Average delay for tows was 1 hour 32 minutes, and average processing time was about 30 minutes (USACE 2008). Inland waterways are especially susceptible to weather, including problems caused by flooding, droughts, and ice or other storm-related disruptions.
![]() You will need the Adobe Acrobat Reader to view the PDFs on this page.
You will need the Adobe Acrobat Reader to view the PDFs on this page.